The following example script initializes a variable using the var keyword on the first bar and then never updates it again.
The variable stores the value of the time built-in, which represents the time of the bar open in UNIX format (milliseconds since
00:00:00 UTC on 1 January 1970).
//@version=6
indicator('Time at first bar')
// Capture the time of the first bar in the dataset.
var int t = time
plot(t)
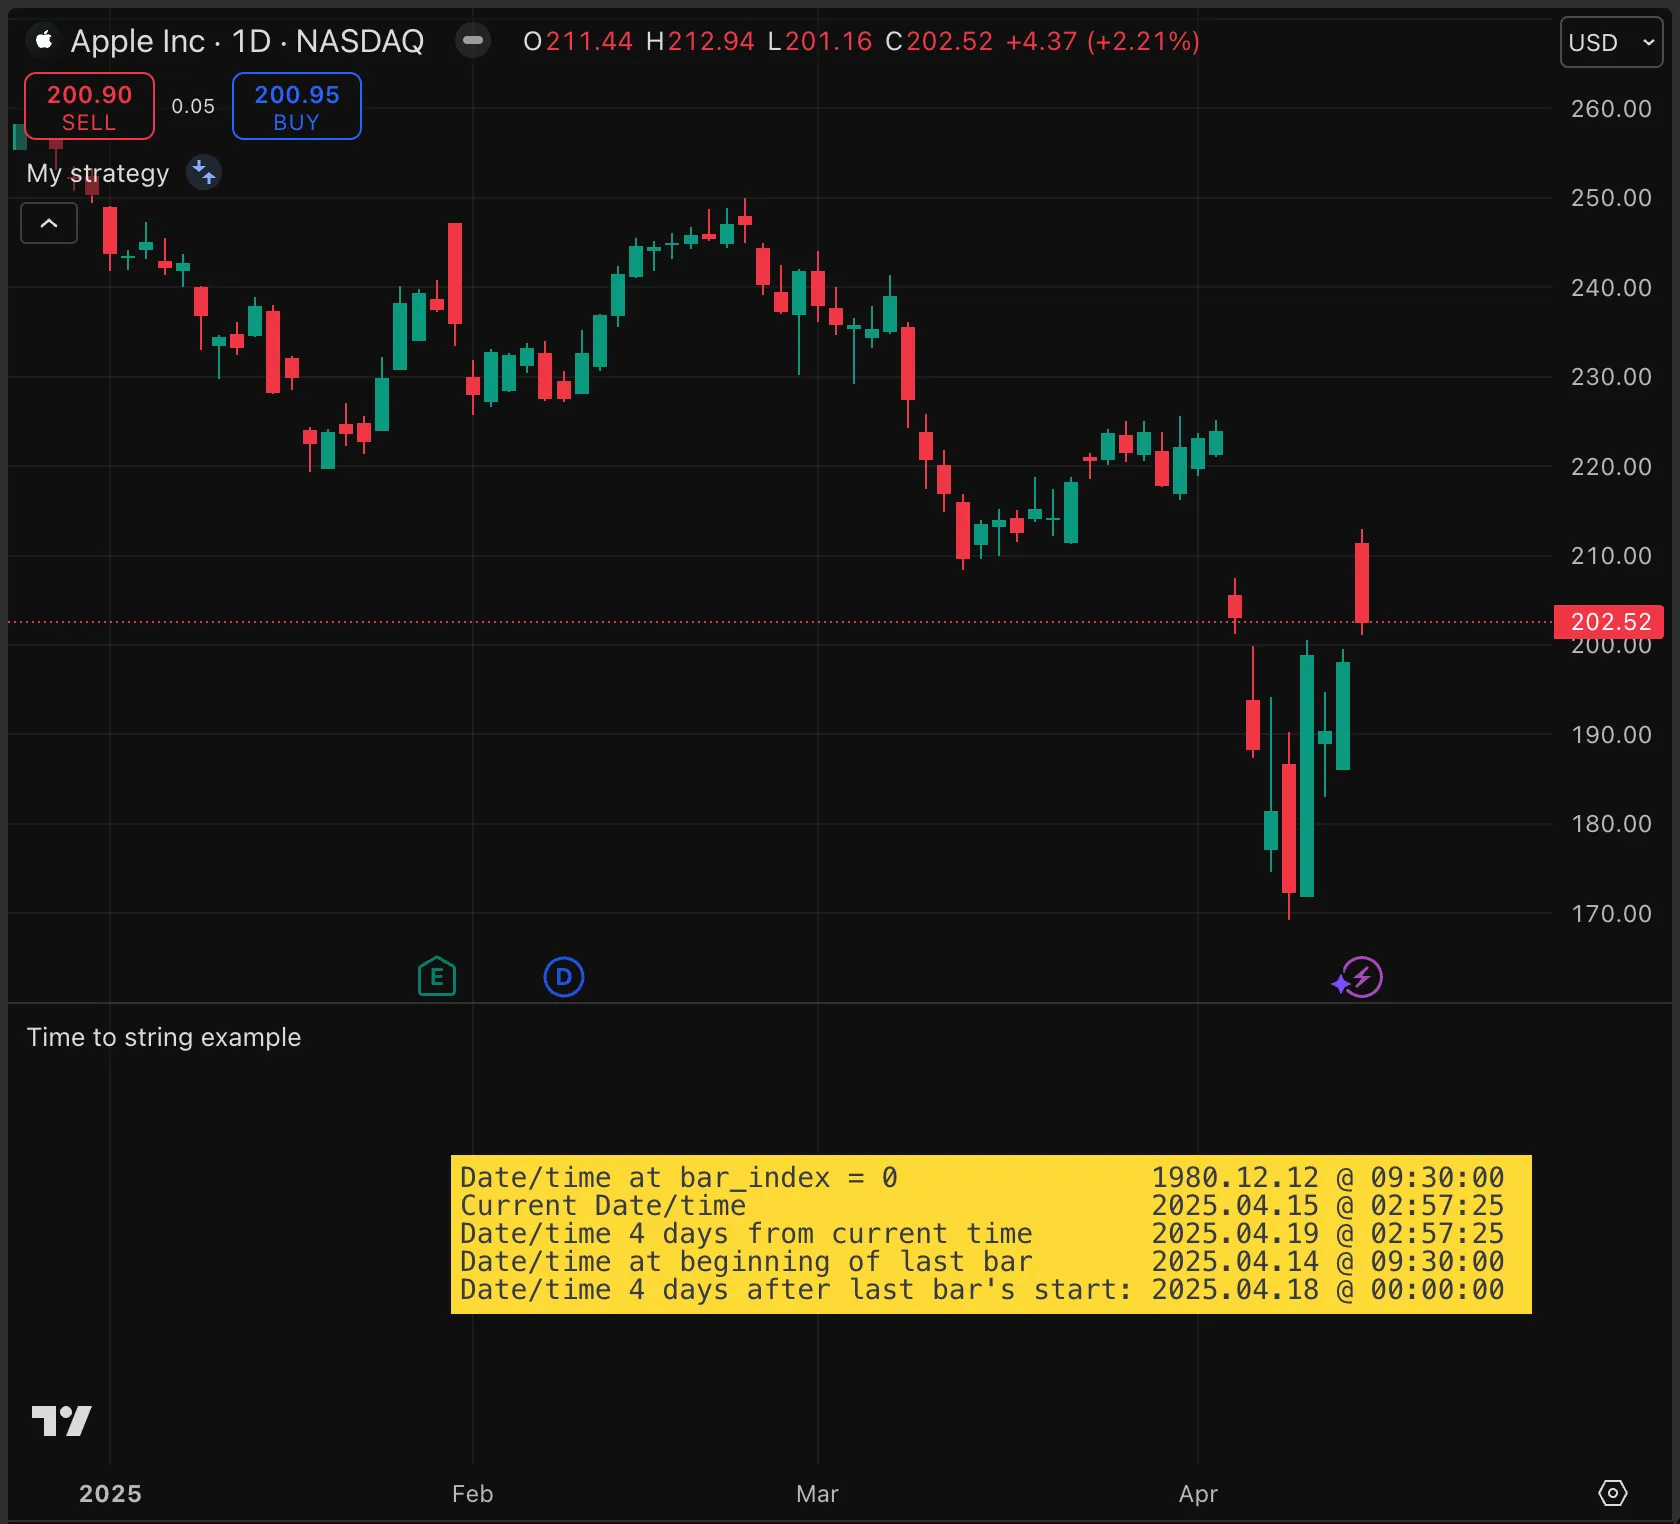
The built-in function str.format_time() translates a UNIX timestamp into a string representation of date and time.
In the following example script, we provide four distinct methods to obtain the date-time string, two of which offset the date and time into the future.
To improve readability, we use a custom function, timeToString(), which calls str.format_time() and applies a consistent format, instead of specifying the format for every function call.
The format "YYYY.MM.dd @ HH:mm:ss" is similar to the ISO 8601 date and time representation, but with periods to separate parts of the date, and an @ symbol between the date and time. For more formatting customization options, consult the str.format_time() documentation.
//@version=6
indicator("Time to string example")
//@function Converts a timestamp into a formatted date-time string.
timeToString(int t) =>
str.format_time(t, format = "YYYY.MM.dd @ HH:mm:ss")
// Capture the time of the first bar in the dataset.
var int firstBarTime = time
// Create a new table on the first bar only.
var table tbl = table.new(position.middle_right, 1, 1)
// On the first bar, build the table cell.
if barstate.isfirst
table.cell(
tbl, 0, 0, "", bgcolor = color.yellow, text_color = color.black,
text_halign = text.align_left, text_font_family = font.family_monospace
)
// On the last bar, build display text and populate the table.
else if barstate.islast
string txt = str.format(
"Date/time at bar_index = 0 {0}"
+ "\nCurrent Date/time {1}"
+ "\nDate/time 4 days from current time {2}"
+ "\nDate/time at beginning of last bar {3}"
+ "\nDate/time 4 days after last bar''s start: {4}",
timeToString(firstBarTime),
timeToString(timenow),
timeToString(
timestamp(
year(timenow), month(timenow), dayofmonth(timenow) + 4, hour(timenow),
minute(timenow), second(timenow)
)
),
timeToString(time),
timeToString(timestamp(year, month, dayofmonth + 4))
)
table.cell_set_text(tbl, 0, 0, txt)
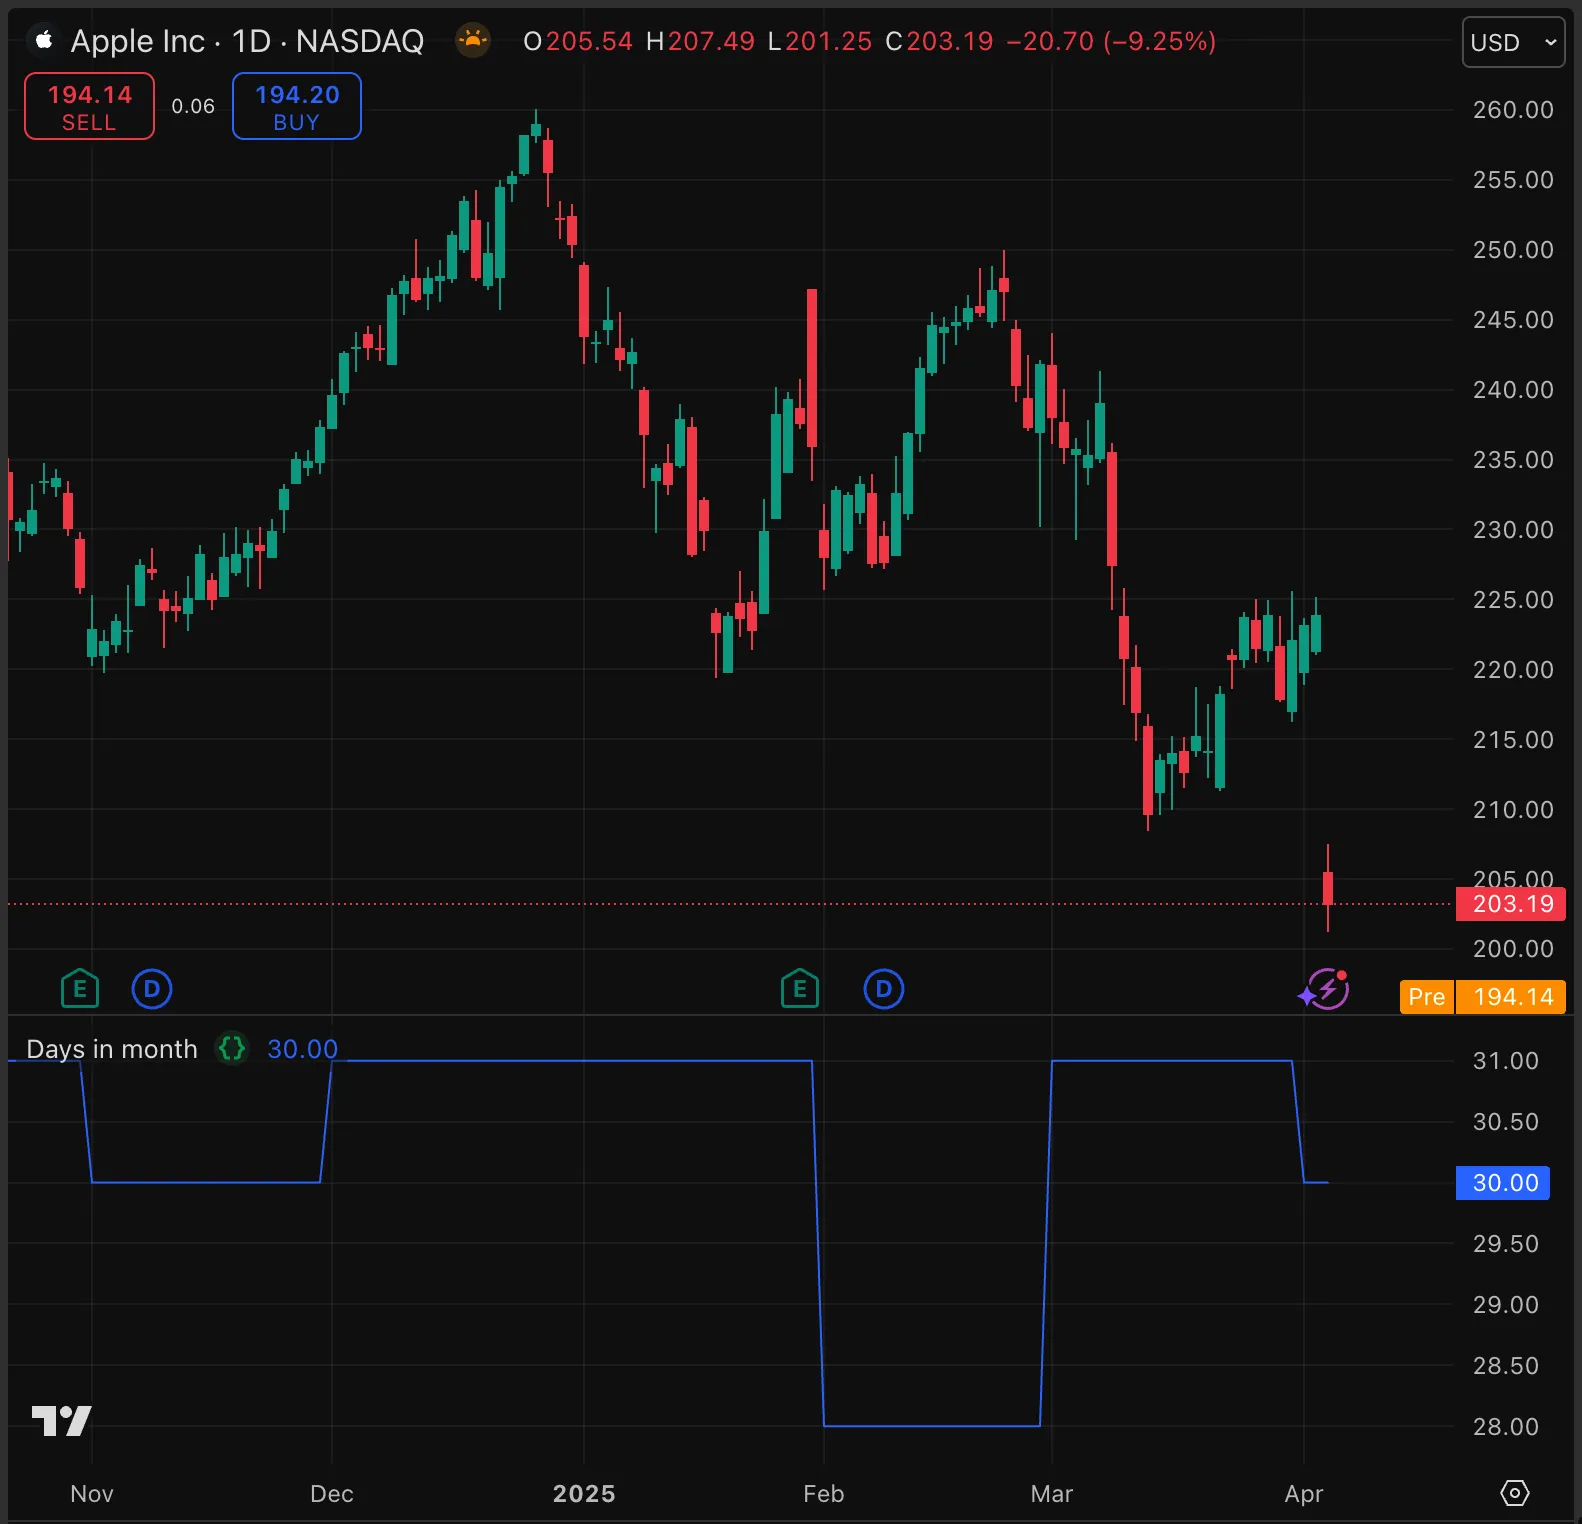
The following example script calculates the number of days in the current month, including adjustments for leap years.
By default, the daysPerMonth() function uses the current year and month, but any year or month number can be passed as arguments:
//@version=6
indicator("Days in month")
// @function Calculates the number of days in a specified month, accounting for leap years.
// @param yearNumber (int) The year of the `monthNumber` month. Optional. Default is the current year.
// @param monthNumber (int, optional) The month for which to find the number of days. Optional. Default is the current month.
// @returns (int) The number of days in the `monthNumber` month of the `yearNumber` year.
daysPerMonth(int yearNumber = year, int monthNumber = month) =>
bool leapYear = (yearNumber % 4 == 0 and yearNumber % 100 != 0) or (yearNumber % 400 == 0)
int result = switch
monthNumber == 2 => leapYear ? 29 : 28
=> 31 - (monthNumber - 1) % 7 % 2
plot(daysPerMonth())
Scripts can detect the last day on a chart in different ways. However, because the last_bar_time
and timenow variables constantly update to mirror the time of the newest bar, each subsequent realtime bar is also interpreted as if it is the chart’s last day.
This example script checks for all of these conditions:
- The daily timeframe begins a new day.
- The difference between the time of the last chart bar (retrieved using last_bar_time)
and the current bar’s time (from time) is less than the time in one day.
The script colors the background red on the last day.
//@version=6
indicator("Last day example", overlay = true)
var bool isLastDay = false
if timeframe.change("1D") and last_bar_time - time < timeframe.in_seconds("1D") * 1000
isLastDay := true
bgcolor(isLastDay ? color.new(color.red, 90) : na)
This script uses the timenow variable to retrieve the current time — not the time of the bar on which the script is executing, but the time of the latest chart update. We pass this time as input to the built-in functions year(), month(), and dayofmonth() to calculate the year, month, and day of the month for that time.
We compare these calculated values with the built-in variables year, month, and dayofmonth, which store the year, month, and day of the month of the current chart bar.
When the year, day and month of the latest chart update match the values of the current bar, then the script is executing on bars from the most recent day.
//@version=6
indicator("Detect today", overlay = true)
isToday() =>
int currentYear = year(timenow)
int currentMonth = month(timenow)
int currentDay = dayofmonth(timenow)
bool result = year == currentYear and month == currentMonth and dayofmonth == currentDay
bgcolor(isToday() ? color.new(color.red, 90) : na)
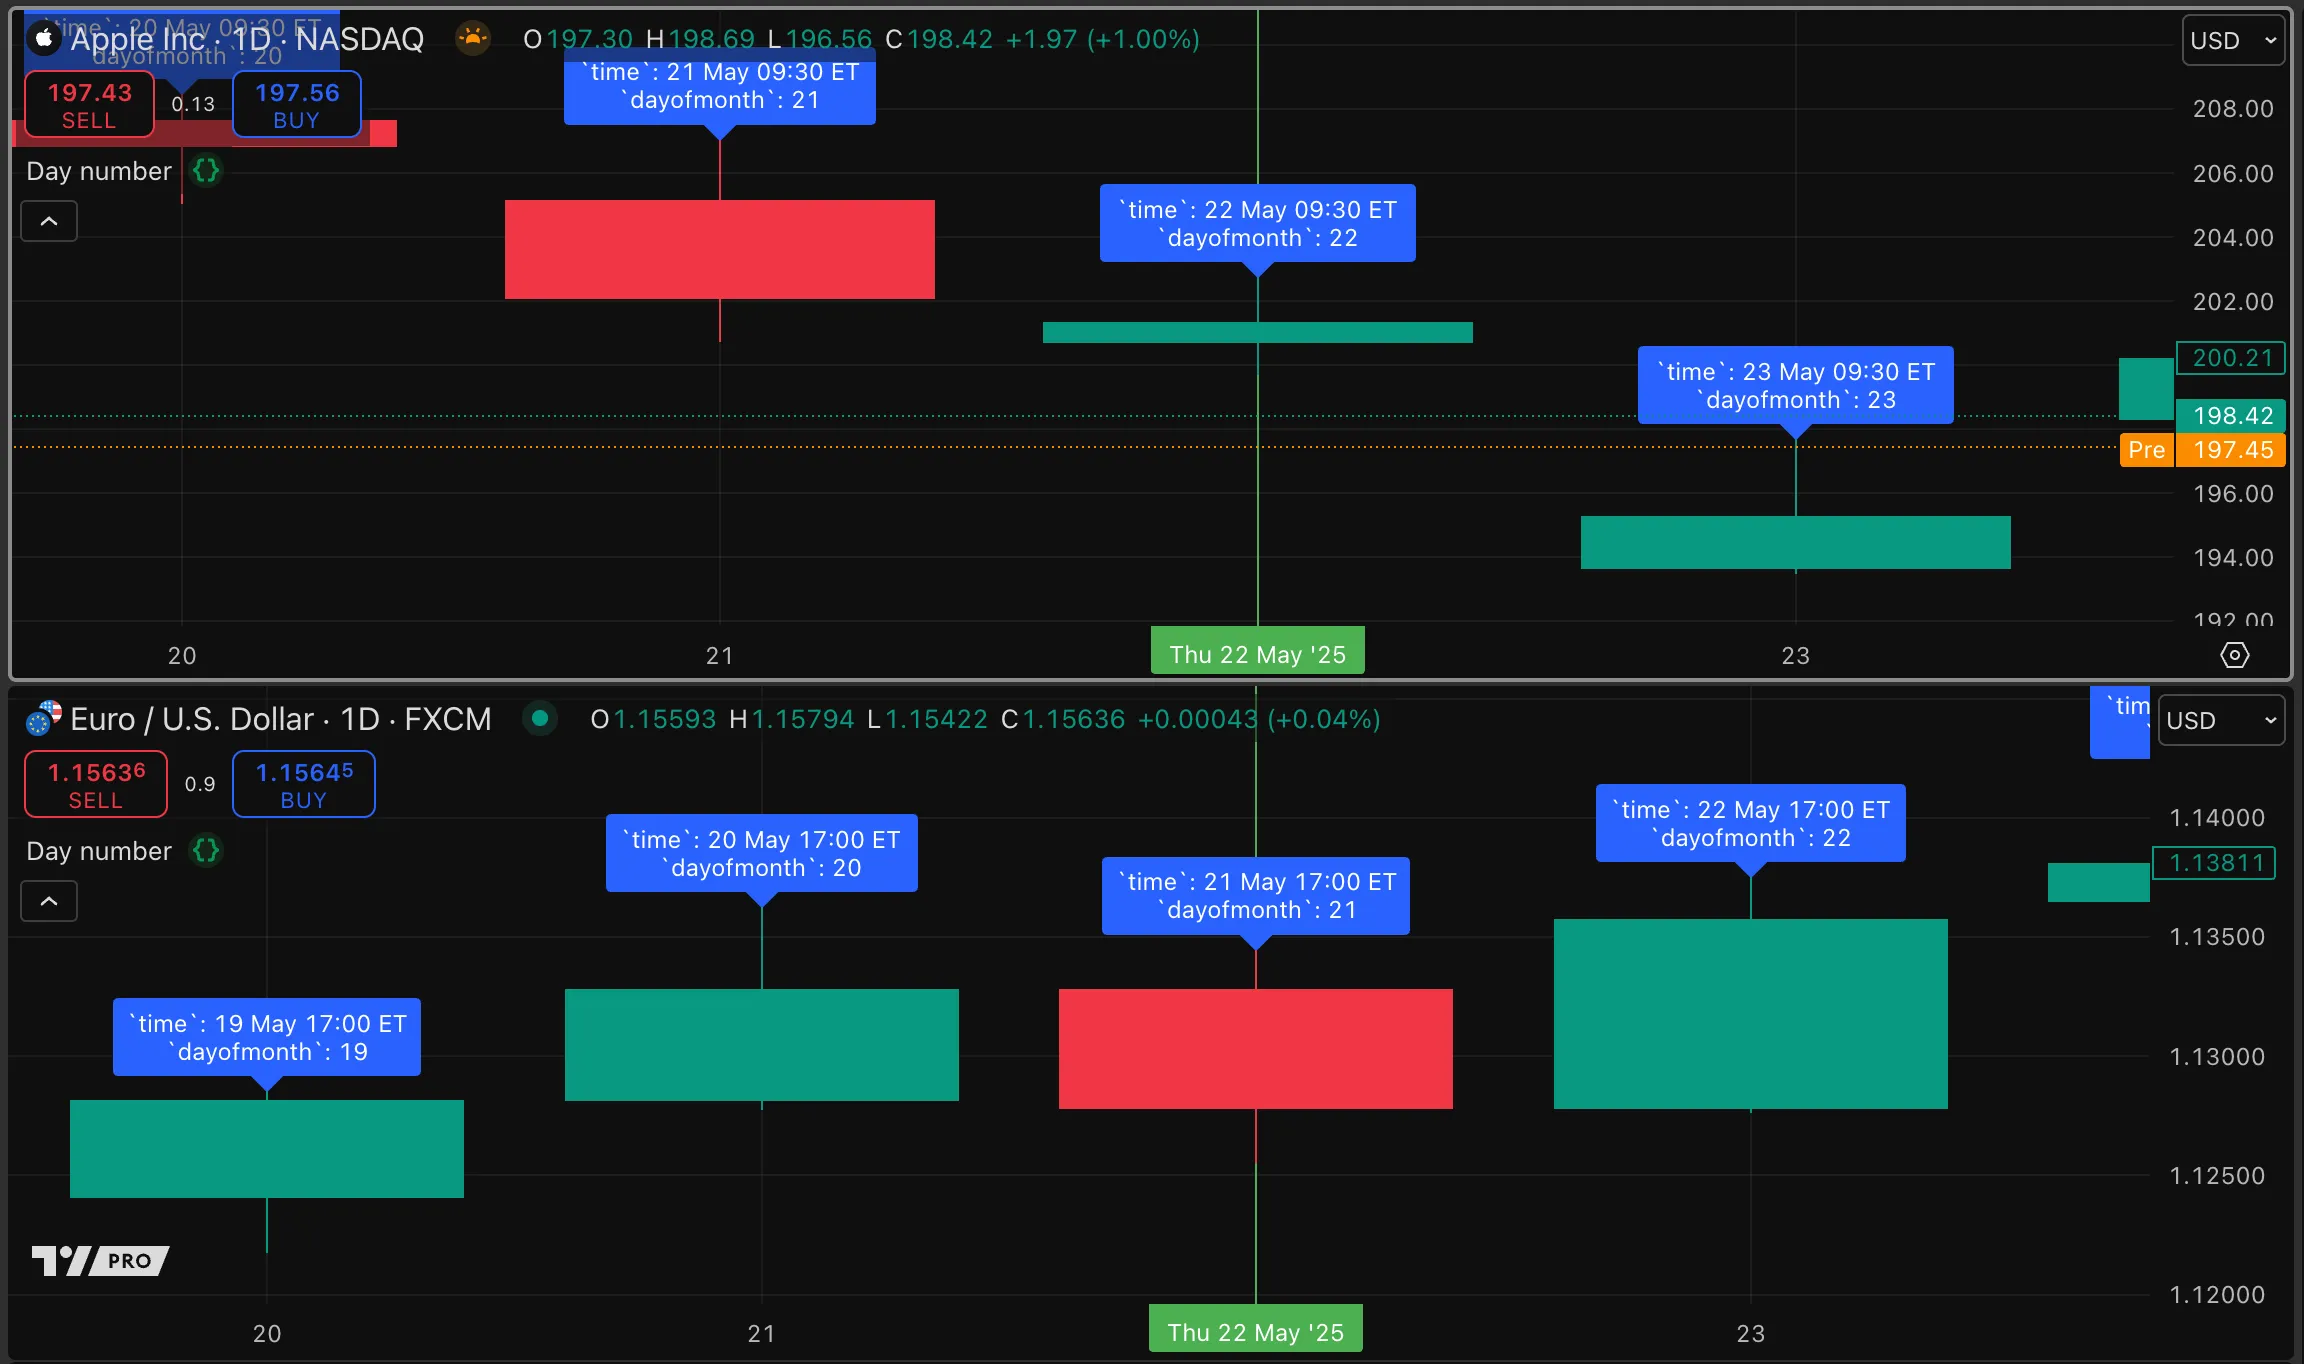
Some symbols trade overnight, which means that today’s trading day actually started yesterday, or even several days ago. Many futures and Forex pairs trade overnight. Trading hours are defined by the exchange. On timeframes of one day and above, the chart visually adjusts the dates of these bars to ensure the date corresponds to the bar’s trading day; on intraday timeframes the date and time are shown as they are.
In Pine Script, the opening time of a bar is represented by the variable time, which also returns the date and time without adjustment. Variables that return date-related values, like dayofmonth, weekofyear, etc., are calculated based on this opening time, which can lead to unexpected behavior on overnight symbols.
The example script below outputs the value of the built-in dayofmonth variable onto a chart as a label. The following screenshot shows the output of this script on two symbols: one stock and one Forex. We added a vertical line on the chart using the drawing tools to highlight the bar that represents May 22nd.
The stock symbol “NASDAQ:AAPL
” displays on the upper chart. Its trading hours open and close within a single day with no overnight session. Therefore, the label displays the same day as the vertical line.
In contrast, on the lower chart, which displays the “FX:EURUSD
” symbol, the label shows 21 on the bar marked May 22nd. This is because the trading for May 22 actually starts on May 21, at 17:00 in the exchange’s time zone, and the dayofmonth variable uses this time to determine the day of the month for this bar.
//@version=6
indicator("Day number", overlay = true)
currTradingDay = dayofmonth
labelStr = "`time`: " + str.format_time(time, "dd MMM HH:mm 'ET'")
labelStr += "\n`dayofmonth`: " + str.tostring(currTradingDay)
label.new(bar_index, high, labelStr)
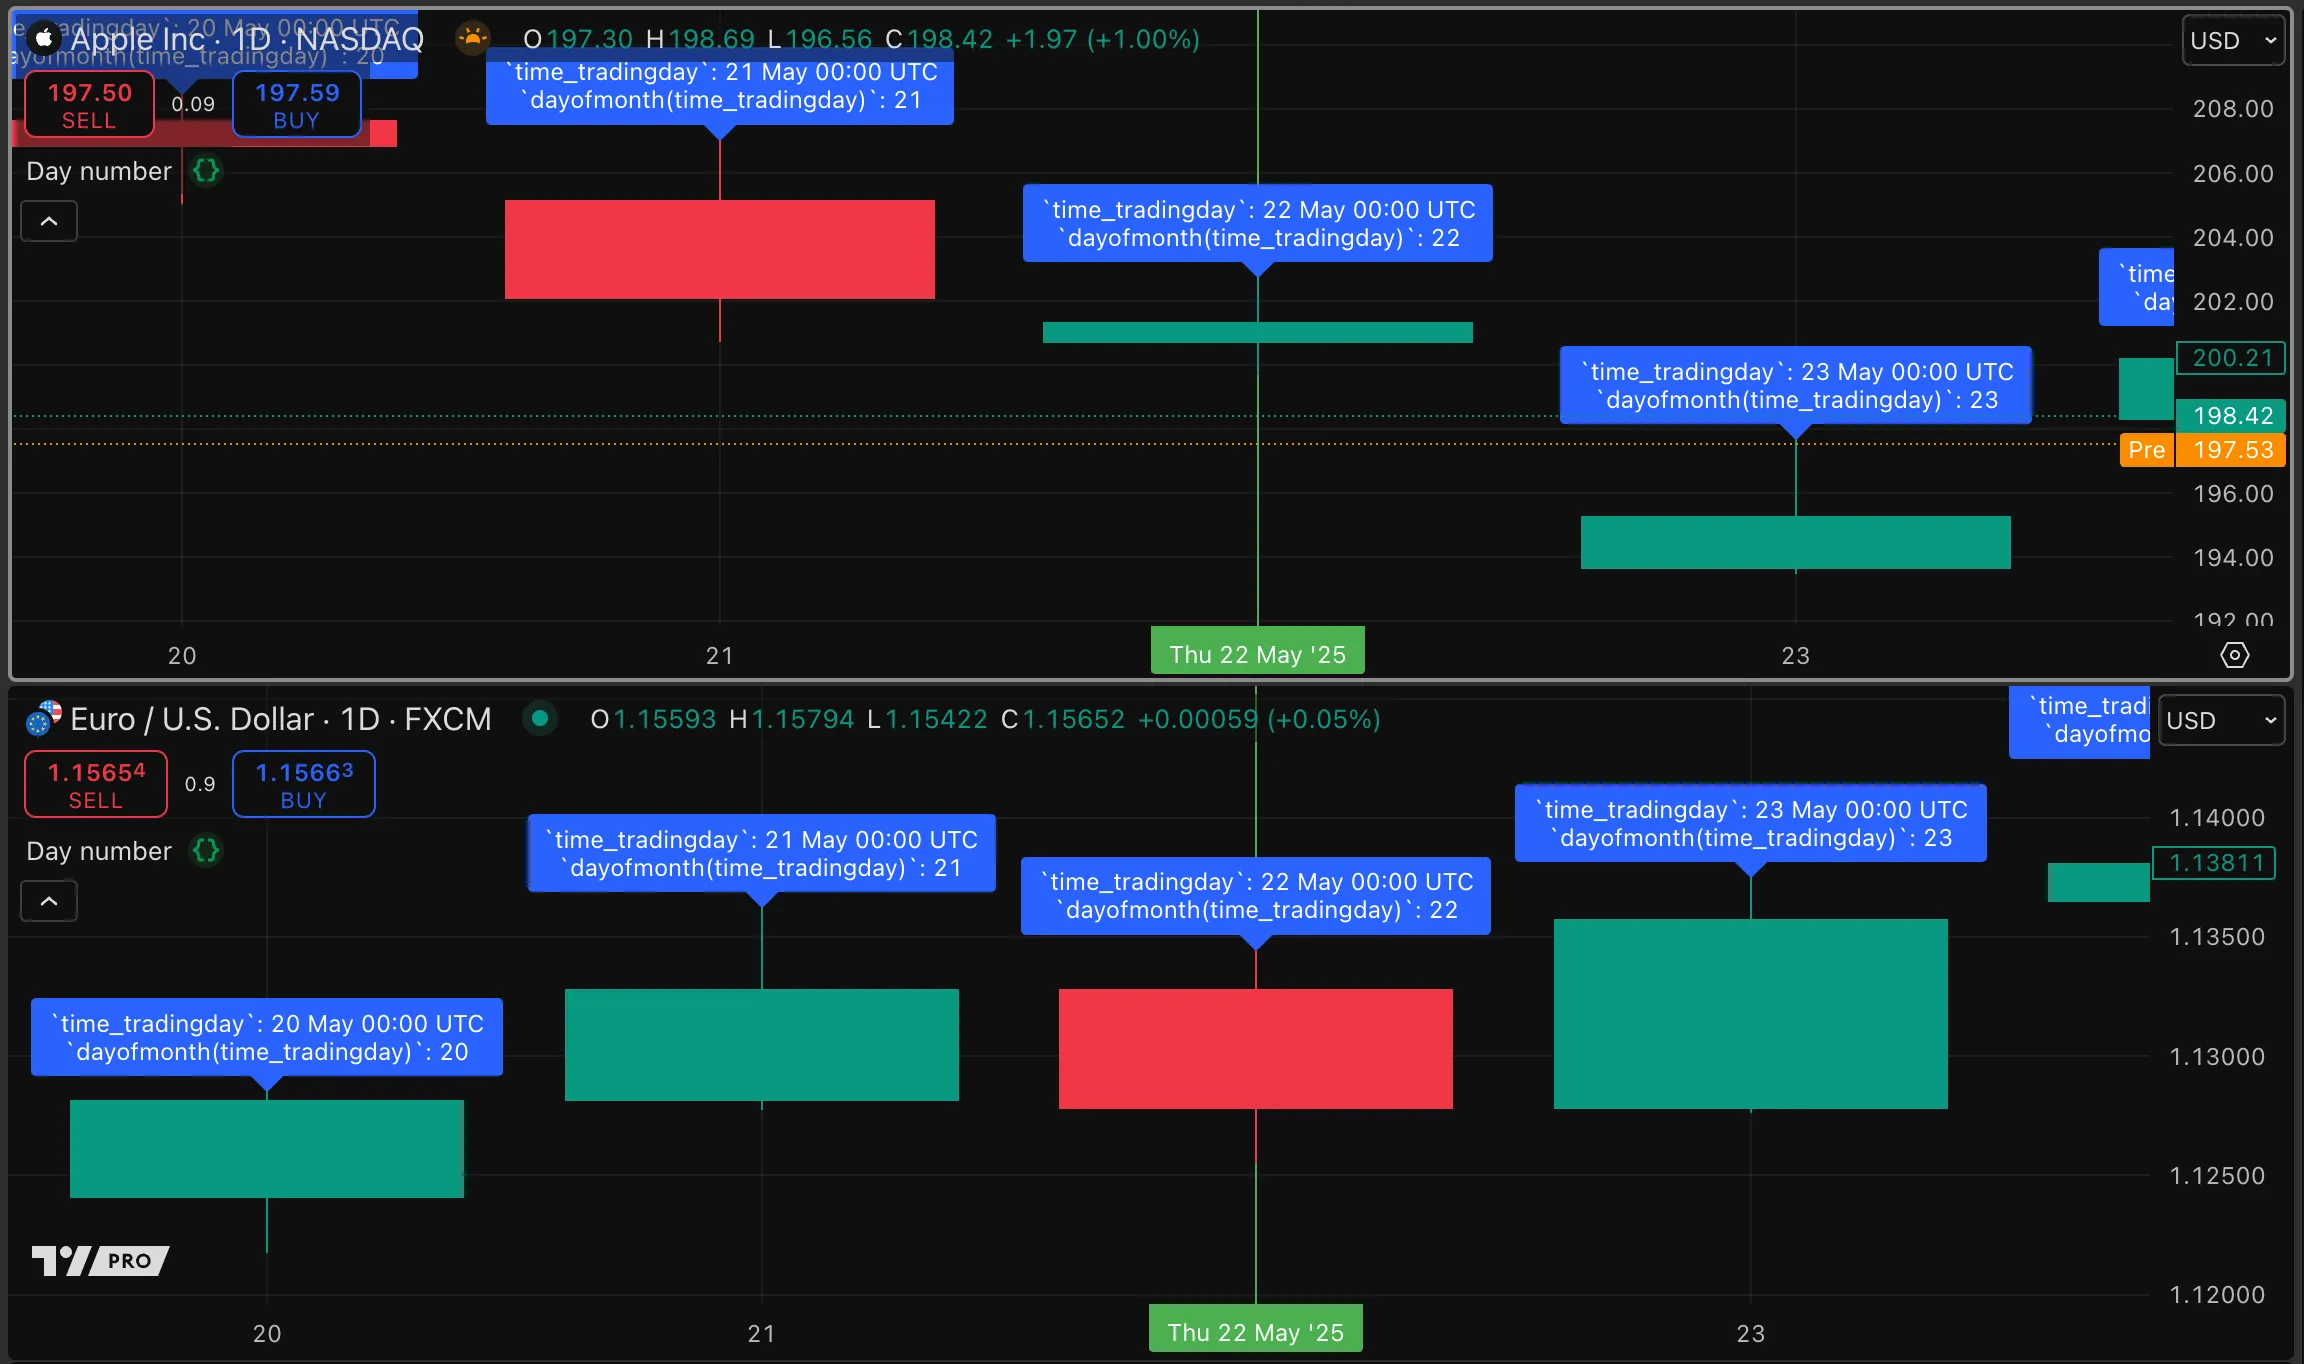
There is a way to avoid this issue. Each date-related variable like dayofmonth has a corresponding function with the same name, e.g., dayofmonth(). The function takes two parameters, time and timezone, which together allow you to specify the exact timestamp to convert to a date.
In addition, the time_tradingday variable returns the timestamp of 00:00 UTC of the trading day the bar belongs to, regardless of the bar’s actual opening time. You can pass this timestamp to the dayofmonth() function along with the "UTC" time zone to extract the date from the trading day of the bar, instead of its opening time. Below, we update our example script to use this method:
//@version=6
indicator("Day number", overlay = true)
currTradingDay = dayofmonth(time_tradingday, "UTC")
labelStr = "`time_tradingday`: " + str.format_time(time_tradingday, "dd MMM HH:mm 'UTC'", "UTC")
labelStr += "\n`dayofmonth(time_tradingday)`: " + str.tostring(currTradingDay)
label.new(bar_index, high, labelStr)
Note that:
- Here, we add
"UTC" as the time zone for the dayofmonth() calculation, because time_tradingday always returns the trading day as 00:00 in the UTC time zone. The variable returns 00:00 because its only purpose is to specify a year, month, and day, and its hour and minute components carry no specific meaning.
The timestamp() function can accept negative argument values and convert them to accurate dates.
For instance, a negative month value deducts the corresponding number of months from the outcome.
Our example script calculates the date three months prior to the current time, using the timestamp() function to create a timestamp that is the configured amount of time prior to the time now, as measured using timenow.
As the script executes on each bar, it compares the bar time with the previously calculated timestamp. When the time of a bar matches our specified target date, we assign the high of that bar as our value to plot and color the background red for demonstration.
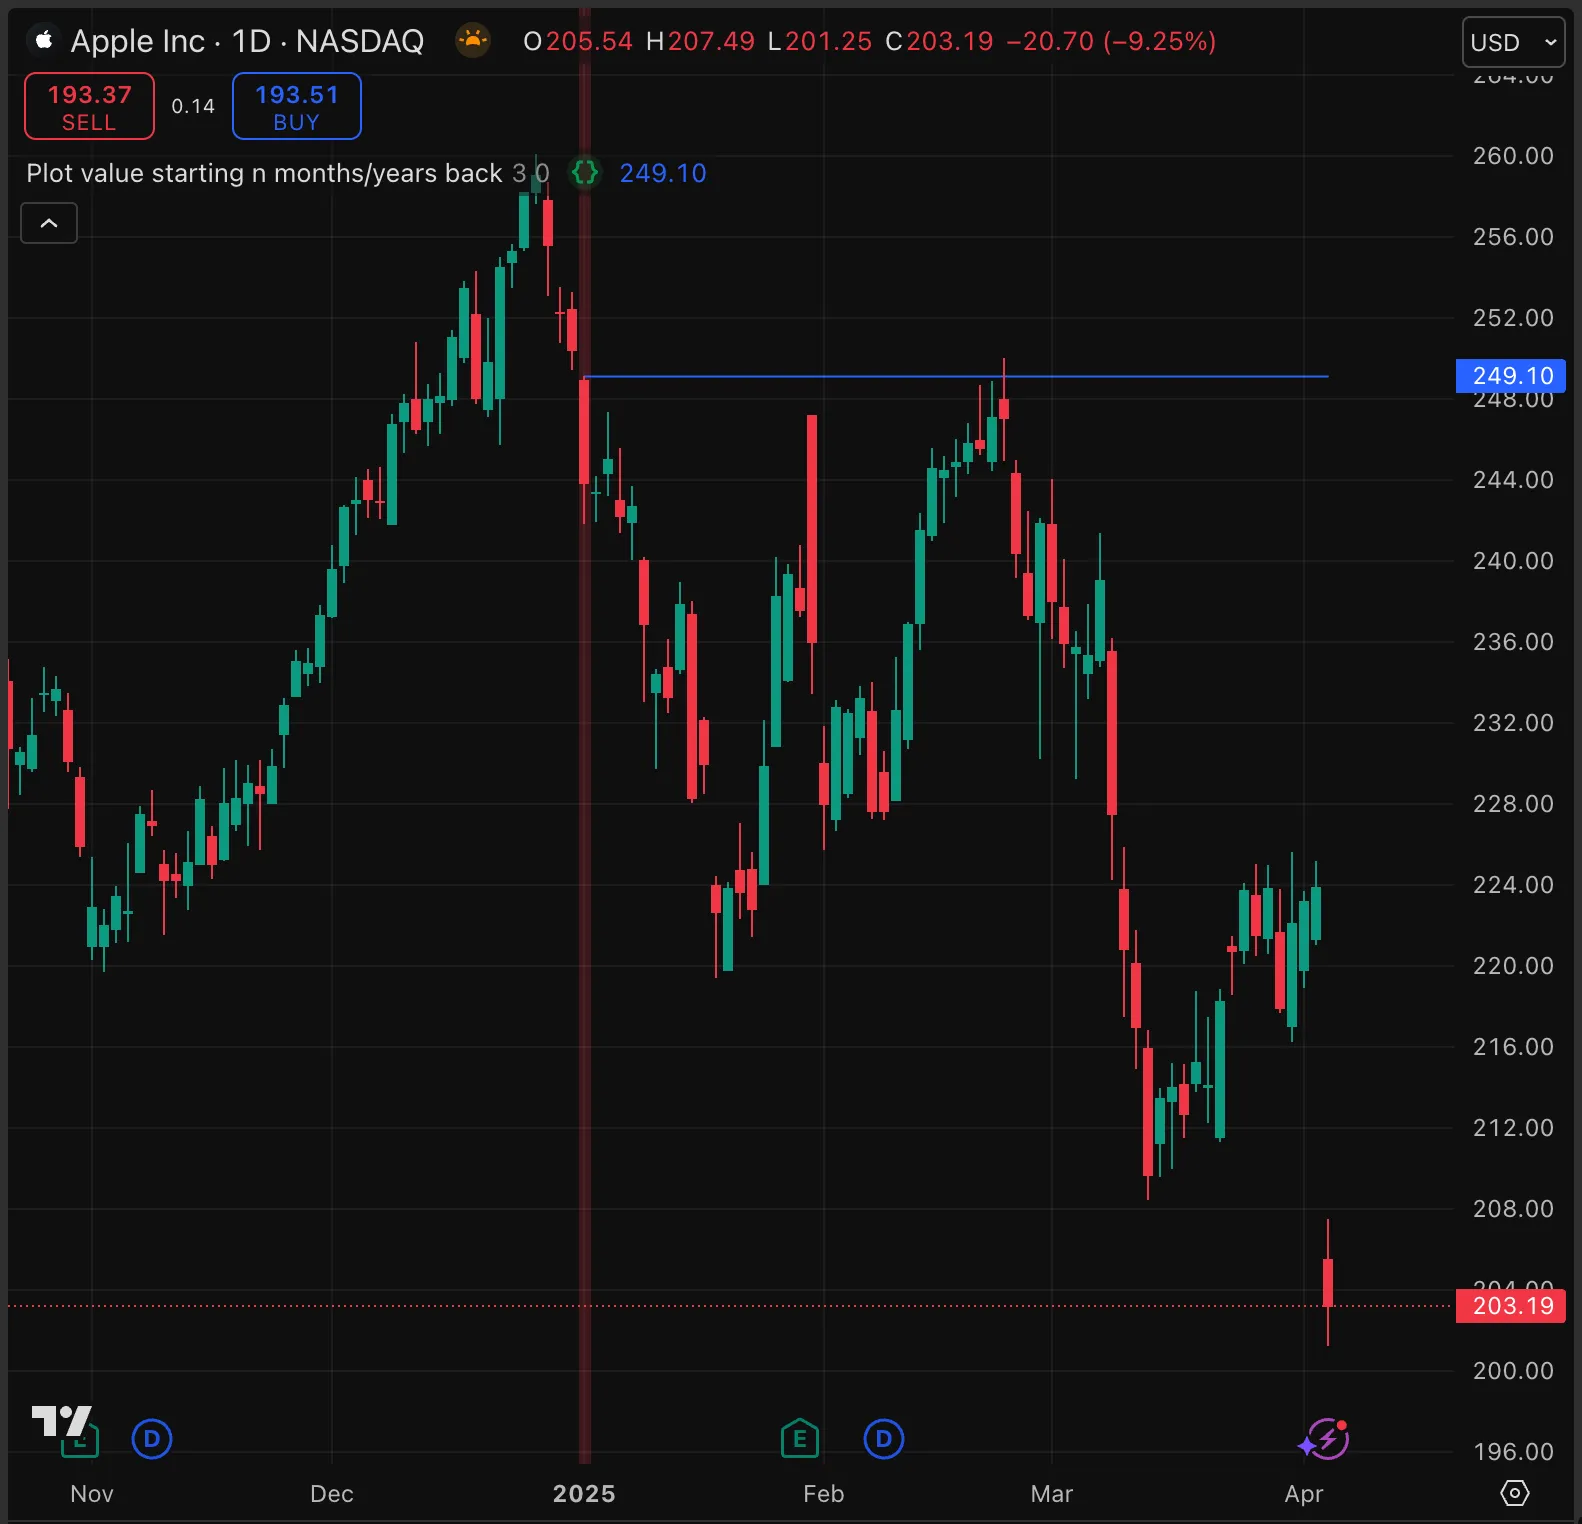
//@version=6
indicator("Plot value starting n months/years back", overlay = true)
int monthsBackInput = input.int(3, minval = 0)
int yearsBackInput = input.int(0, minval = 0)
bool calcFromNowInput = input(false, "Calculate from current date/time instead of first of the month")
bool isTargetDate = time >= timestamp(
year(timenow) - yearsBackInput,
month(timenow) - monthsBackInput,
calcFromNowInput ? dayofmonth(timenow) : 1,
calcFromNowInput ? hour(timenow) : 0,
calcFromNowInput ? minute(timenow) : 0,
calcFromNowInput ? second(timenow) : 0)
bool isBeginMonth = not isTargetDate[1] and isTargetDate
var float valueToPlot = na
if isBeginMonth
valueToPlot := high
plot(valueToPlot)
bgcolor(isBeginMonth ? color.new(color.red, 80) : na)
The following example script tracks the high and low values of a timeframe that the user selects. Our script avoids using request.security() calls, which are resource-intensive.
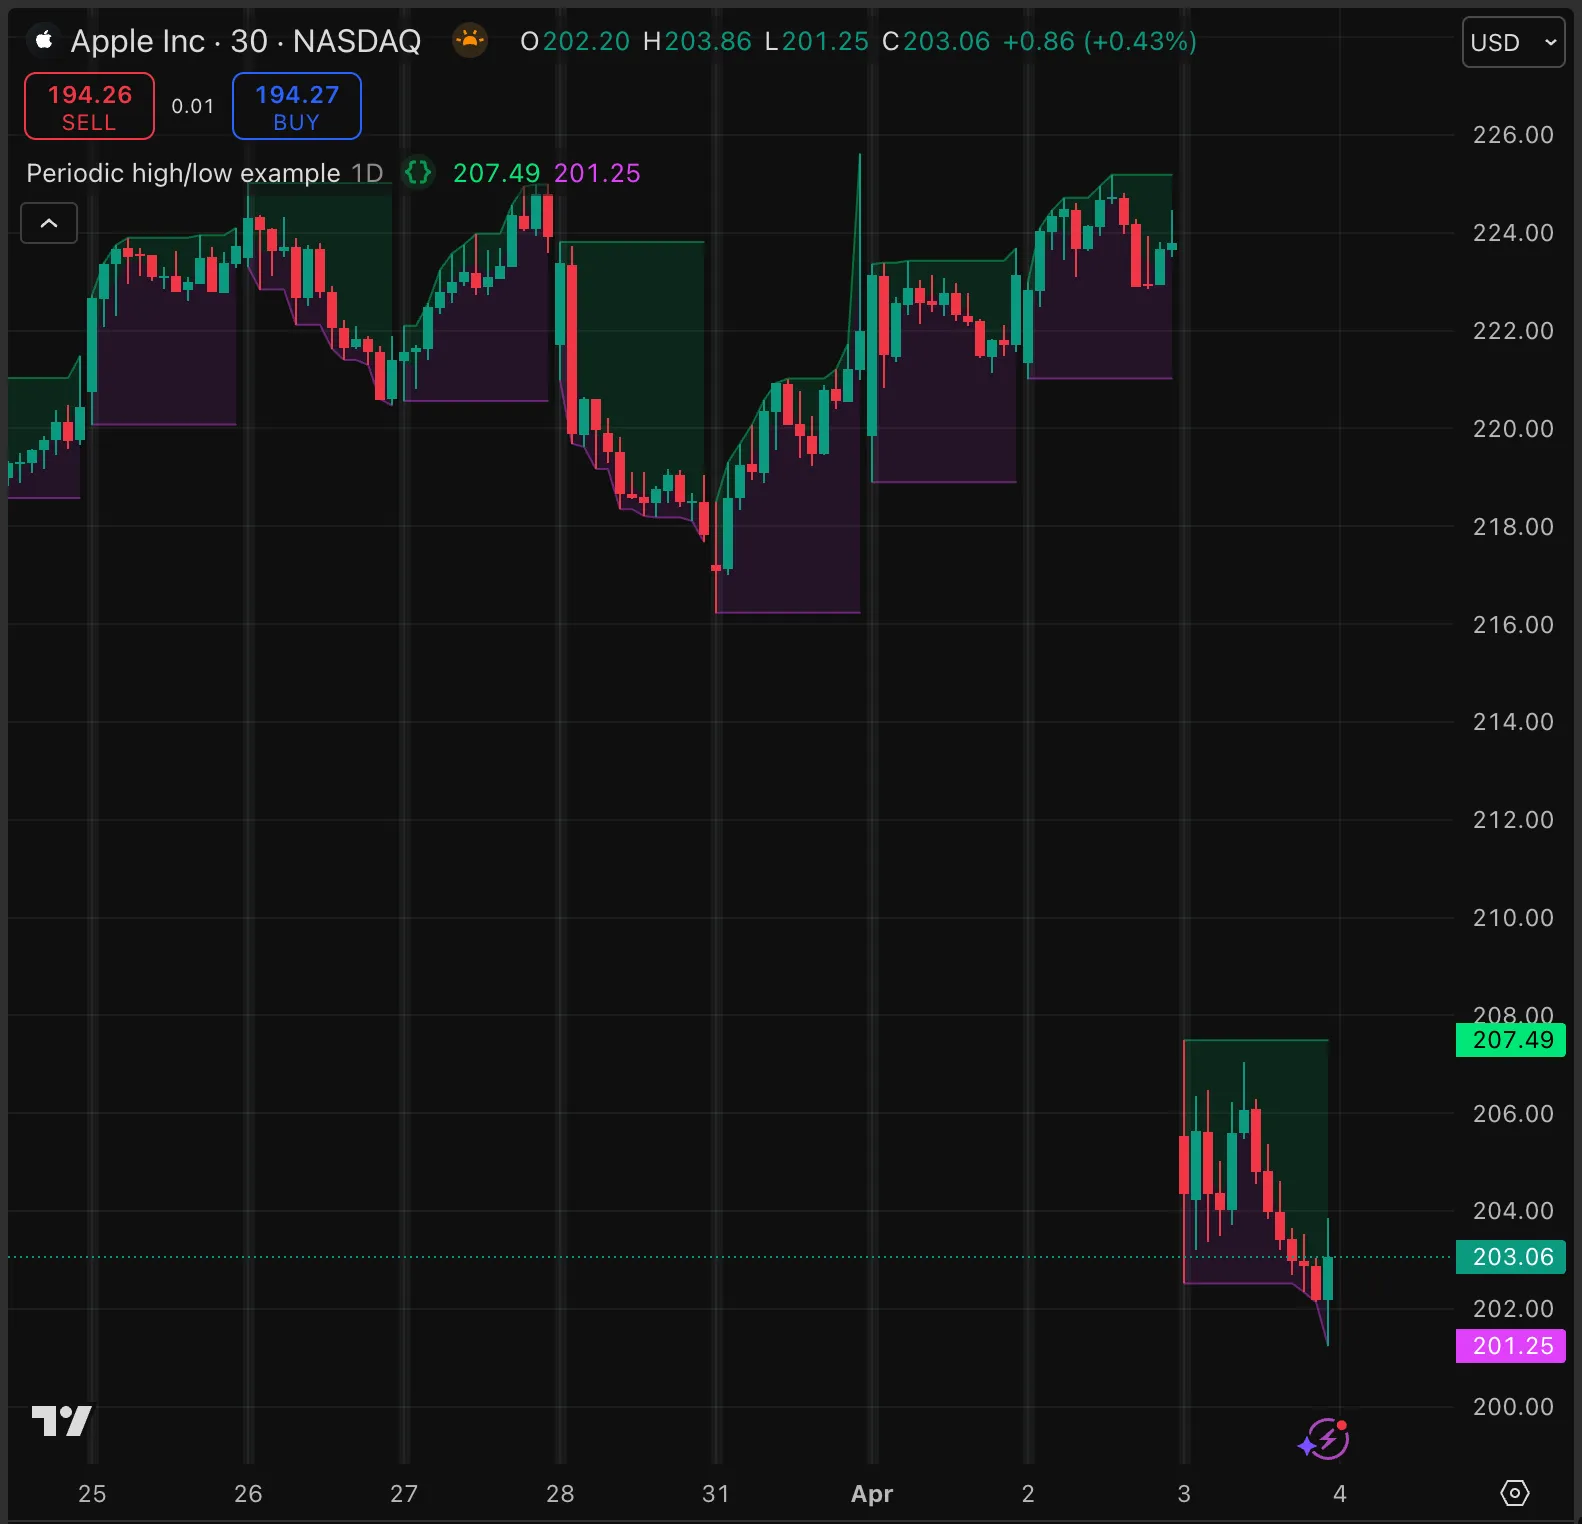
//@version=6
indicator("Periodic high/low example", overlay = true)
// Inputs
bool showHiInput = input.bool(true, "Show highs")
bool showLoInput = input.bool(true, "Show lows")
string periodInput = input.timeframe("1D", "Period after which high/low is reset")
// Declare with `var` to retain values bar to bar.
var float hi = na
var float lo = na
// When a new period begins, reset hi/lo; otherwise, trail them.
bool isNewPeriod = timeframe.change(periodInput)
hi := isNewPeriod ? high : math.max(high, hi)
lo := isNewPeriod ? low : math.min(low, lo)
// Plot the hi, lo, and an invisible mid value for area fill.
p1 = plot(hi, "Highs", isNewPeriod ? na : color.new(color.lime, 60), display = showHiInput ? display.all : display.none)
p2 = plot(lo, "Lows", isNewPeriod ? na : color.new(color.fuchsia, 60), display = showLoInput ? display.all : display.none)
p3 = plot(hl2, editable = false, display = display.none)
// Create fills between the current mid price and the highest and lowest price.
fill(p1, p3, color = isNewPeriod ? na : color.new(color.lime, 90))
fill(p2, p3, color = isNewPeriod ? na : color.new(color.fuchsia, 90))
bgcolor(isNewPeriod ? color.new(color.gray, 90) : na) // Highlight the background when a new period begins.
Note that:
- We detect the beginning of a new timeframe by passing the period input to the timeframe.change() function.
- The script resets the
hi and lo variables at the beginning of a new timeframe and then trails hi up and lo down.
- We change the color of plots to na every time a new timeframe begins, to visually distinguish between periods.
To find if a time is within a specific session, pass a time-based session string to the time() function, which retrieves the UNIX time of the current bar based on a given timeframe and session. If the time point falls outside the session, the function returns na.
In the following example script, on the first bar that the time is in session, we set the hi and lo variables to the source inputs provided by the user (high and low by default). During the session we trail the hi value up and the lo value down. The script also highlights the background red when a bar’s time falls outside the session time.
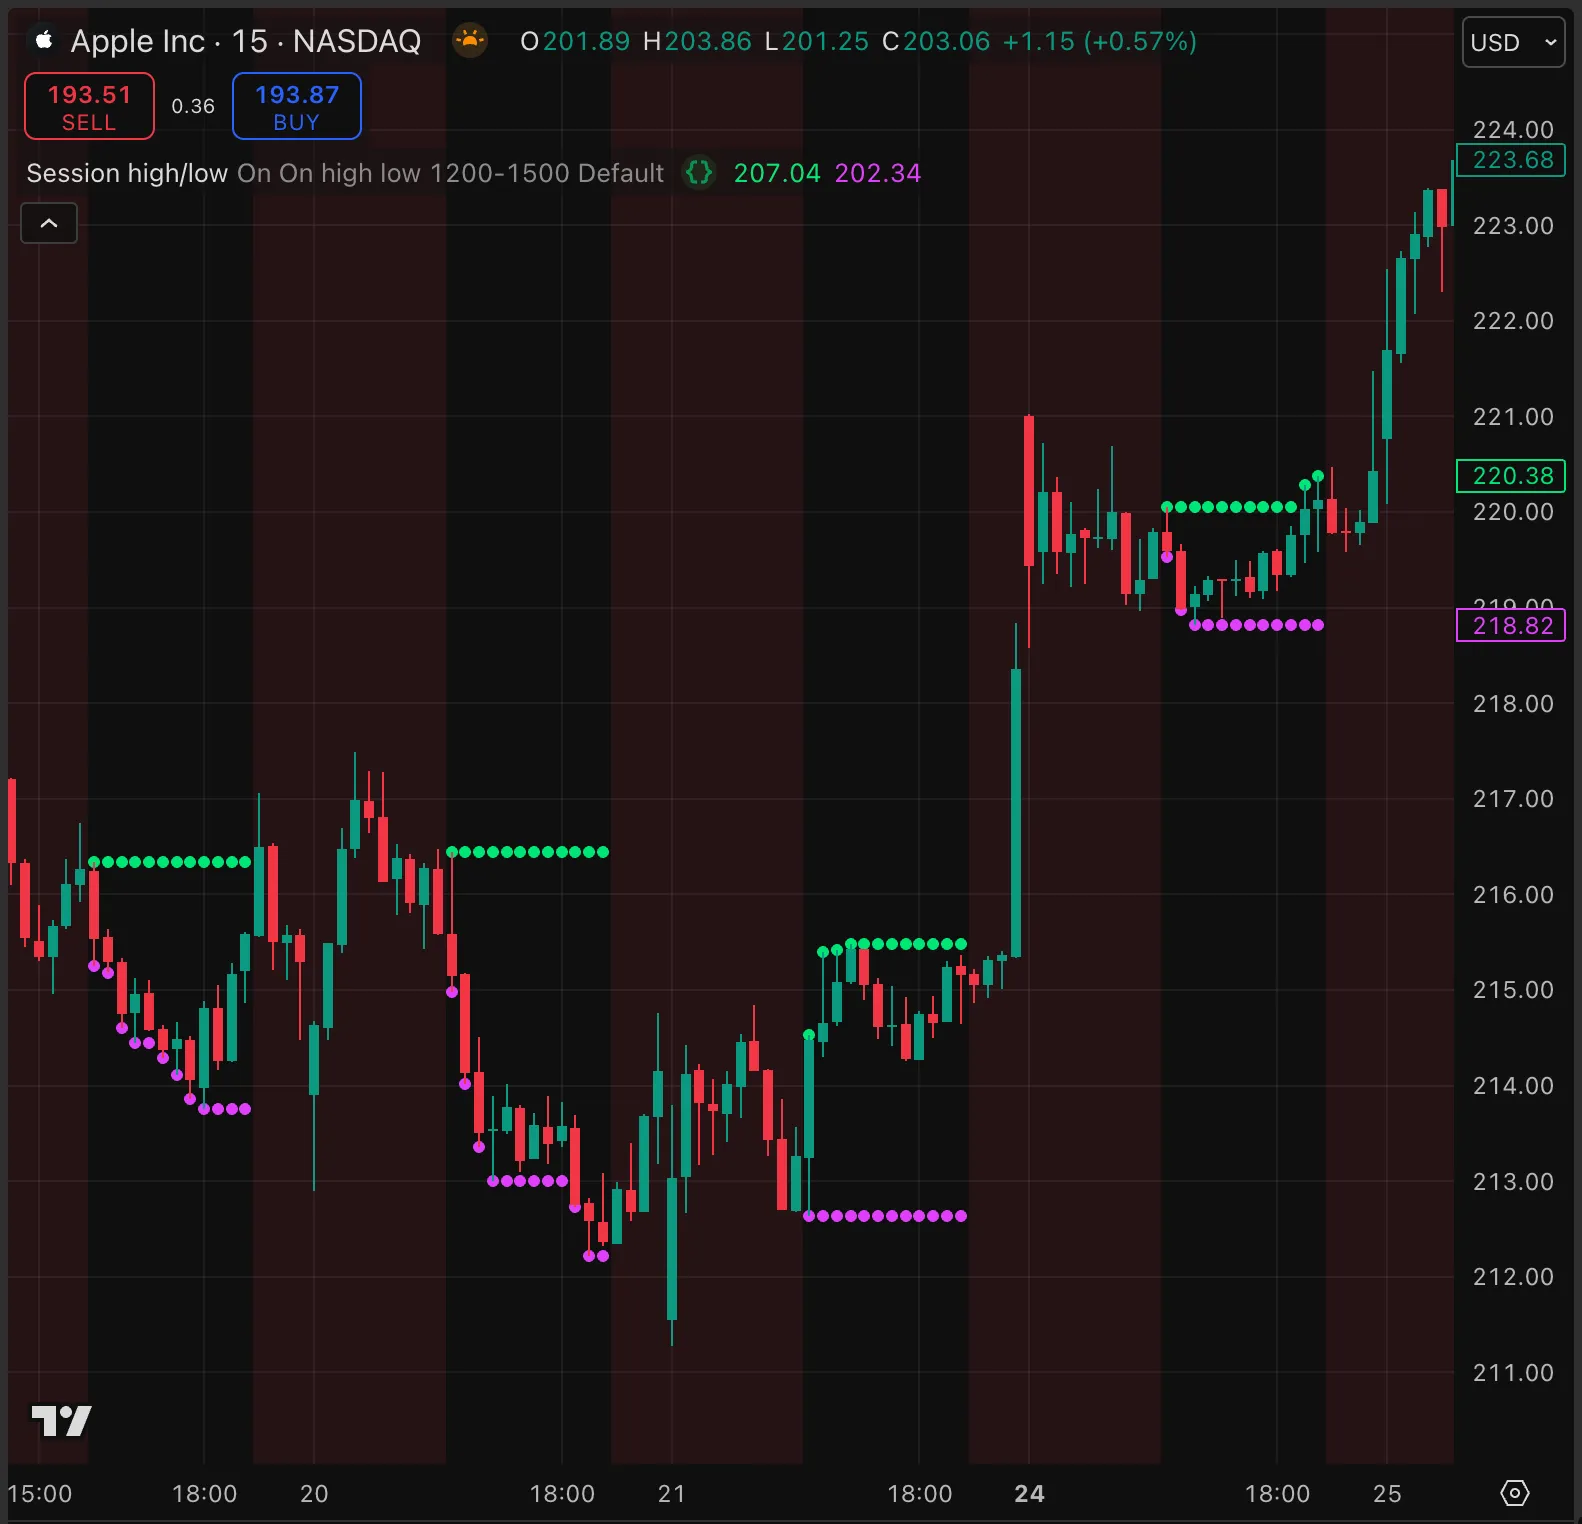
//@version=6
indicator("Session high/low", overlay = true)
const string DEFAULT = "Default"
const string EQ1 = "On"
const string EQ2 = "Off"
// Inputs
bool showHiInput = input.string(EQ1, "Show highs", options = [EQ1, EQ2]) == EQ1
bool showLoInput = input.string(EQ1, "Show lows", options = [EQ1, EQ2]) == EQ1
float srcHiInput = input.source(high, "Source for Highs")
float srcLoInput = input.source(low, "Source for Lows")
string sessionInput = input.session("1200-1500", "Allowed hours")
string timezoneInput = input.string(DEFAULT, "Time zone", options = [DEFAULT, "GMT-12", "GMT-11", "GMT-10",
"GMT-9", "GMT-8", "GMT-7", "GMT-6", "GMT-5", "GMT-4", "GMT-3", "GMT-2", "GMT-1", "GMT-0", "GMT+1", "GMT+2",
"GMT+3", "GMT+4", "GMT+5", "GMT+6", "GMT+7", "GMT+8", "GMT+9", "GMT+10", "GMT+11", "GMT+12", "GMT+13", "GMT+14"])
// Check to see if we are in allowed hours using session info.
int timeInSession = time(timeframe.period, sessionInput, timezoneInput == DEFAULT ? syminfo.timezone : timezoneInput)
bool timeIsAllowed = not na(timeInSession)
var float hi = na
var float lo = na
if timeIsAllowed
// We are entering allowed hours; reset hi/lo.
if not timeIsAllowed[1]
hi := srcHiInput
lo := srcLoInput
else
// We are in allowed hours; track hi/lo.
hi := math.max(srcHiInput, hi)
lo := math.min(srcLoInput, lo)
// Plot hi/lo within allowed hours.
plot(showHiInput and timeIsAllowed ? hi : na, "Highs", color.lime, 3, plot.style_circles)
plot(showLoInput and timeIsAllowed ? lo : na, "Lows", color.fuchsia, 3, plot.style_circles)
bgcolor(not timeIsAllowed ? color.new(color.red, 90) : na)
Note that:
- We use the 3-parameter version of the time() function to ascertain whether we are within user-specified hours and time zone for tracking highs and lows.
- We pass a session input and an optional time zone to the time() function.
Scripts can use custom time-based sessions by defining a session string, as explained in the Time-based sessions section of the Sessions page.
The following example script takes a user-defined session and marks it on the chart using lines and a linefill. The script highlights the session that the current bar is in, or if the current bar is outside a session, it highlights the next future session:
//@version=6
indicator("Highlight trading session", overlay=true)
string sessionInput = input.session("0900-1700:1234567", "Session")
if timeframe.in_seconds(timeframe.period) < 300
runtime.error("This script only supports chart timeframes of 5 minutes or more.")
// Keep track of when the session started.
int sessionStart = na, int sessionEnd = na
int barsSince = ta.barssince(na(time(timeframe.period, sessionInput)))
if barstate.islast
if na(time(timeframe.period, sessionInput)) // If this bar is not in a session..
for i = 1 to 499 // ..search forward for the next session.
int barStartTime = time(timeframe.period, sessionInput, bars_back = -i)
if not na(barStartTime) and na(sessionStart)
sessionStart := barStartTime
if not na(sessionStart) and na(barStartTime)
sessionEnd := time_close(timeframe.period, sessionInput, bars_back = -(i - 1))
break
else // If this bar is in a session..
if na(barsSince)
sessionStart := na
else
int startBack = barsSince - 1 // ..find the start of the session..
sessionStart := time(timeframe.period, sessionInput, bars_back = startBack)
for i = 1 to 499 // ..and search forwards for the end of the session.
int barStartTime = time(timeframe.period, sessionInput, bars_back = -i)
if na(barStartTime) and na(sessionEnd)
sessionEnd := time_close(timeframe.period, sessionInput, bars_back = -(i - 1))
break
if not na(sessionStart) and not na(sessionEnd) // If we found the start and end of the session..
// ..set up the drawings
var line left_line = na, line.delete(left_line)
var line right_line = na, line.delete(right_line)
var linefill session_fill = na, linefill.delete(session_fill)
var label sessionLabel = na, label.delete(sessionLabel)
// ..draw the lines
left_line := line.new(x1 = sessionStart, y1 = low - syminfo.mintick, x2 = sessionStart, y2 = high + syminfo.mintick,
xloc = xloc.bar_time, extend = extend.both, color = color.green, width = 2)
right_line := line.new(x1 = sessionEnd, y1 = low - syminfo.mintick, x2 = sessionEnd, y2 = high + syminfo.mintick,
xloc = xloc.bar_time, extend = extend.both, color = color.green, width = 2)
// ..draw the fill
session_fill := linefill.new(left_line, right_line, color.new(color.green, 90))
// .. and draw a label to show the session times.
sessionLabel := label.new(x = sessionEnd, y = open, xloc = xloc.bar_time, yloc = yloc.price, text = "Start: "
+ str.format_time(sessionStart, "MM-dd HH:mm") + "\n" + "End: "
+ str.format_time(sessionEnd, "MM-dd HH:mm"), color = color.new(color.green, 50),
style = label.style_label_left, textcolor = chart.fg_color, size = size.normal)
Note that:
- The lowest timeframe to use, assuming that the session allows 24-hour trading 7 days a week, to search forward one whole day, is 5 minutes. Therefore, if the chart timeframe is lower than “5m”, the script throws a runtime error.
- The script uses time() and time_close() functions in loops, with positive and negative values for the
bars_back parameter to search forwards and backwards in time.
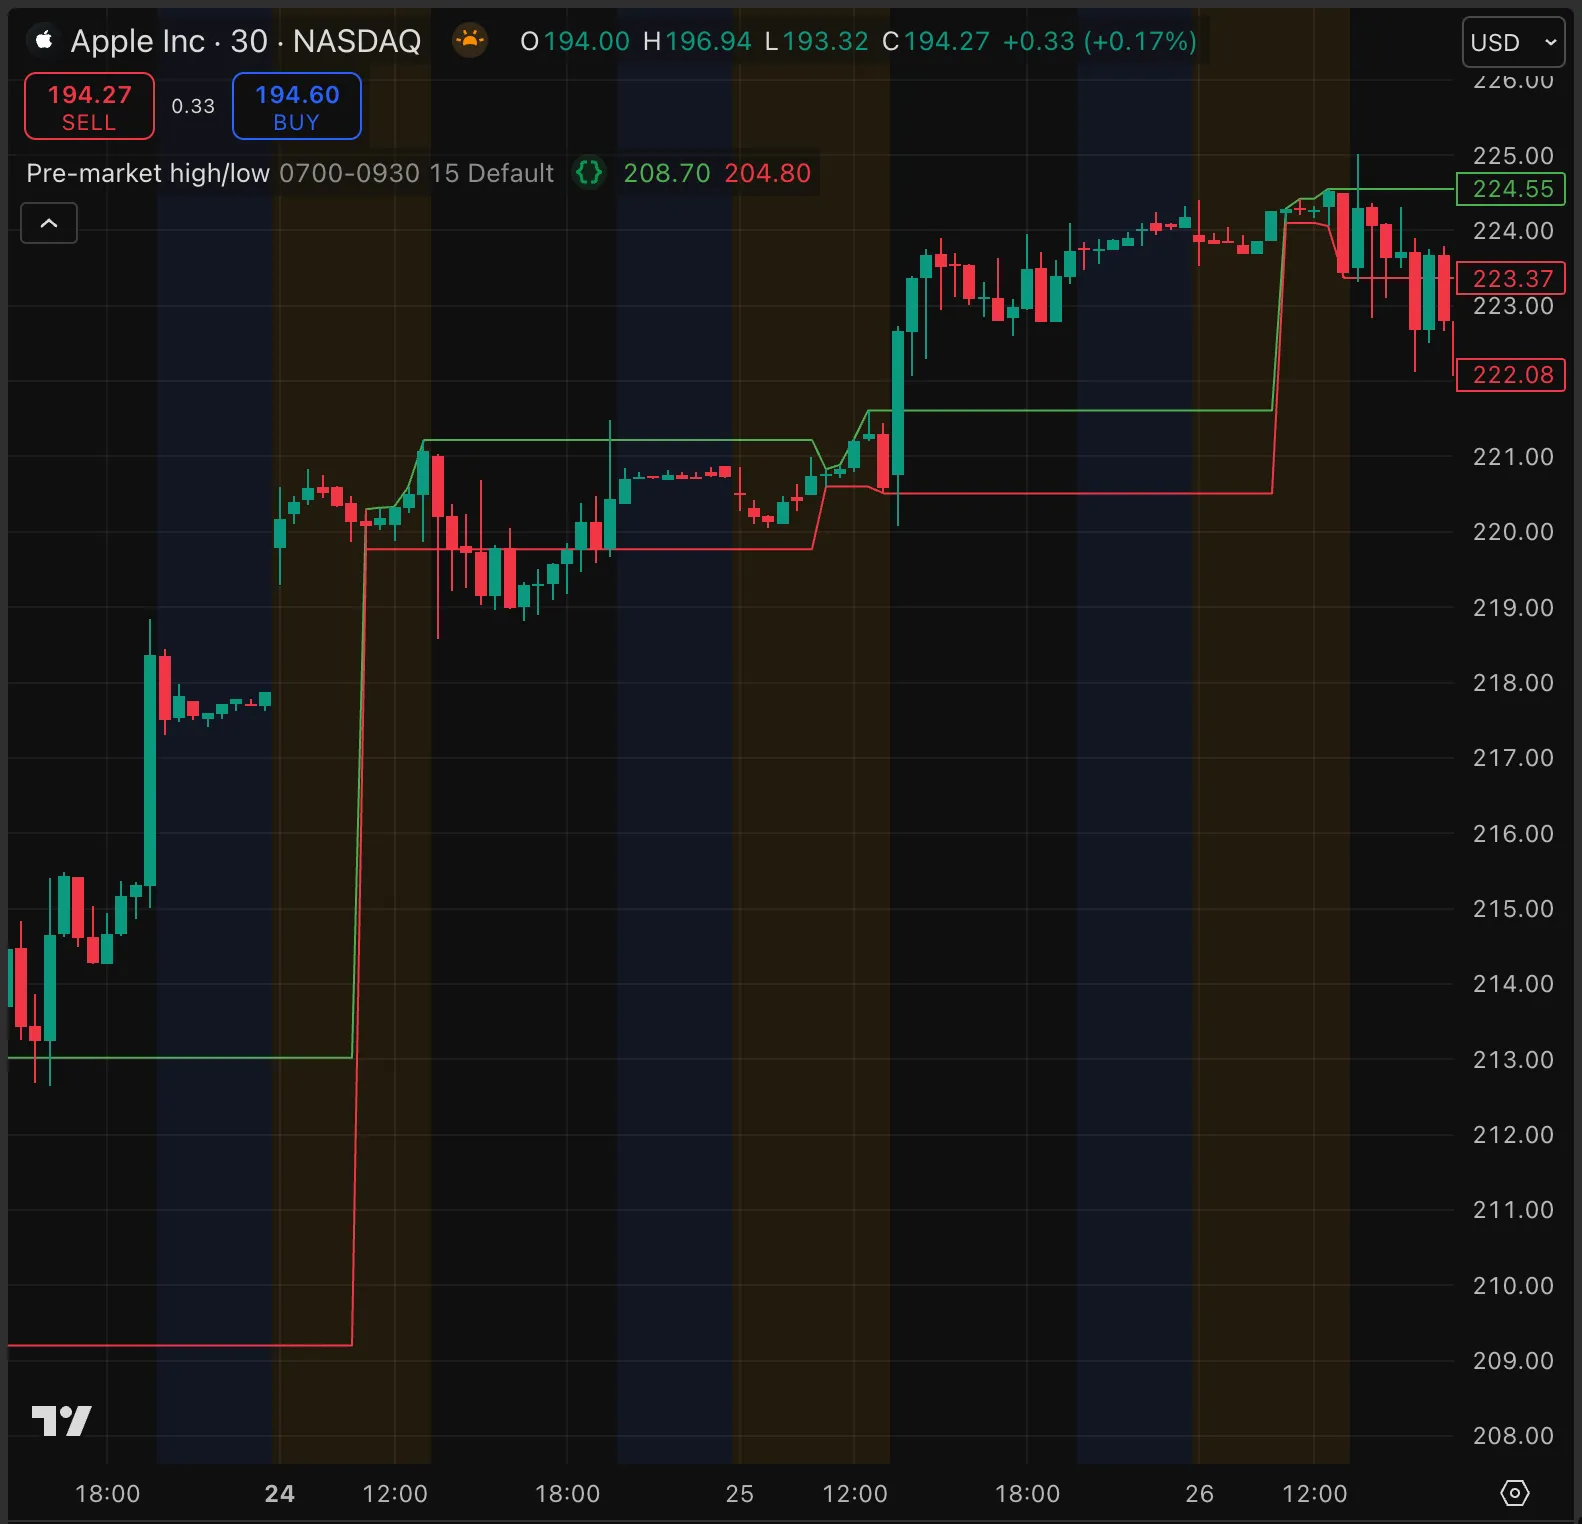
Historical bars contain one set of OHLC data for each bar. To identify values and times that start or end within a chart bar, intrabar inspection is necessary, using data from lower timeframes.
For instance, on an hourly chart, the market open might occur mid-bar, making it hard to determine pre-market highs and lows. Pulling data from a lower timeframe, such
as a 15-minute chart, provides a clearer view of that hour’s events.
The following example script calculates pre-market highs and lows from 15-minute chart data.
- First, we define a function called
hiLoBetweenTime() to track the highs and lows within a session.
- Next, we modify the symbol’s ticker using ticker.modify() to include extended session data, ensuring that the script identifies premarket highs and lows even when the chart uses regular trading hours.
- Finally, we pass the
hiLoBetweenTime() function as the expression of the request.security() function, with the modified ticker as the symbol.
The request.security() function evaluates the hiLoBetweenTime() function within the context of the lower timeframe to calculate the session’s highs and lows.
//@version=6
indicator("Pre-market high/low", overlay = true)
// Inputs
string timeAllowedInput = input.session("0700-0930", "Allowed Hours")
string lowerTfInput = input.timeframe("15", "Intrabar Resolution")
string timezoneInput = input.string("Default", "Time zone", options = ["Default", "GMT-12", "GMT-11", "GMT-10",
"GMT-9", "GMT-8", "GMT-7", "GMT-6", "GMT-5", "GMT-4", "GMT-3", "GMT-2", "GMT-1", "GMT-0", "GMT+1", "GMT+2",
"GMT+3", "GMT+4", "GMT+5", "GMT+6", "GMT+7", "GMT+8", "GMT+9", "GMT+10", "GMT+11", "GMT+12", "GMT+13", "GMT+14"])
// @function Tracks the highest high and lowest low between specified session times.
// @param sess (simple string) Session duration in the format "start time - end time". Example: "0930-1600"
// @param timeZone (simple string) Time zone of the session in "GMT-0" format. Optional. Default is the symbol's time zone.
// @returns ([float, float]) A tuple of the highest high and lowest low between the specified session times.
hiLoBetweenTime(simple string sess, simple string timeZone = "Default") =>
var float hi = na, var float lo = na
// Check to see if we are in allowed hours using session and time zone information.
bool inSession = not na(time("", sess, timeZone == "Default" ? syminfo.timezone : timeZone))
if inSession
if not inSession[1] // We are entering allowed hours; reset hi/lo.
hi := high, lo := low
else // We are in allowed hours; track high and low.
hi := math.max(hi, high), lo := math.min(lo, low)
[hi, lo]
// Request data from lower timeframe using the `hiLoBetweenTime()` function.
[highAtTime, lowAtTime] = request.security(ticker.modify(syminfo.tickerid, session.extended), lowerTfInput,
hiLoBetweenTime(timeAllowedInput, timezoneInput))
// Plot the most recent value.
plot(highAtTime, "High", color.green)
plot(lowAtTime, "Low", color.red)
// Raise error if lower tf is the same or greater than chart's tf.
if timeframe.in_seconds() <= timeframe.in_seconds(lowerTfInput)
runtime.error("The lower timeframe for intrabar inspection must be lower than the chart's timeframe.")
Note that:
- The script raises an error using runtime.error() if the chosen lower timeframe for intrabar inspection is not shorter than the main chart’s timeframe. Including error-checking such as this when working with timeframes makes the script more robust.
The simplest way to detect a specific date and time is to check the time variable, which returns the timestamp of the current bar’s open. If this matches a certain timestamp, then the script has detected that specific date and time.
The following example script colors the background green when the chart time exactly matches a date and time that the user inputs.
//@version=6
indicator("Exact date/time detector", overlay = true)
bgcolor(time == input.time(timestamp("2025-03-24 10:00"), "Target Date/Time") ? color.new(color.green, 90) : na)
However, matching an exact date and time is not very useful. If the target time does not coincide with the opening of a candle on the chart timeframe, then that exact time never matches. For example, if the user specifies “2025-03-24 10:01” as the target time for the script above, then it never matches on any timeframe above one minute.
The following script behaves more intuitively, by coloring the background if a target time input by the user falls anywhere within a particular chart bar. The script colors one and only one bar even if the time does not match the open of a bar. The days, hours, and minutes are all tested separately to see if they match the target time, and these boolean conditions must all be true in order for the background to be colored. If the chart timeframe is too high, we set the corresponding lower time conditions to true so that they do not prevent the overall condition from firing. For example, if the timeframe is one day or above, we bypass the isTargetHour condition by setting it to true without evaluating the number of hours.
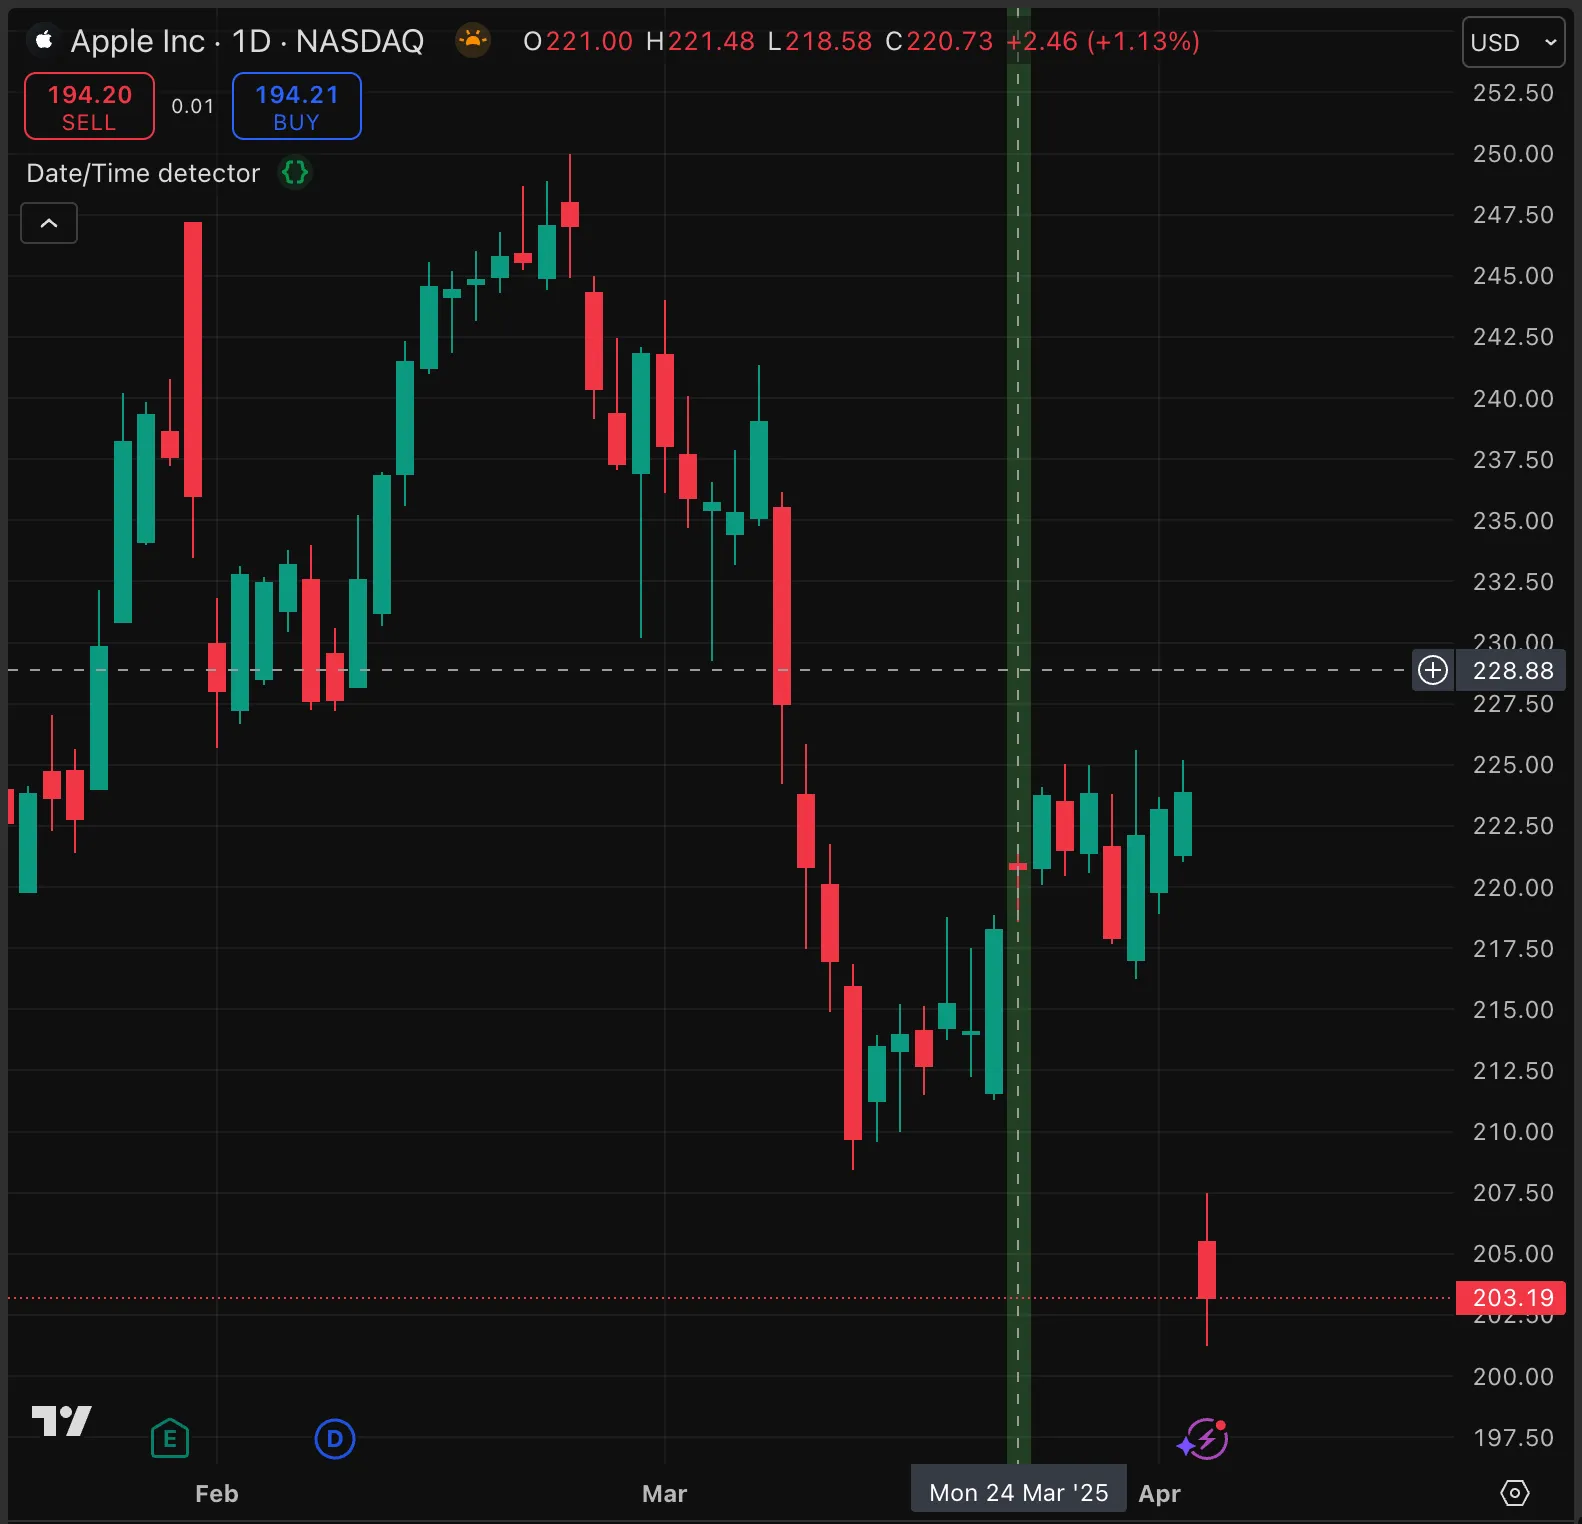
//@version=6
indicator("Date/Time detector", overlay = true)
int targetInput = input.time(defval = timestamp("2025-03-24 10:00"), title = "Target Date/Time", confirm = true)
bool isTargetYear = year == year(targetInput)
bool isTargetMonth = month == month(targetInput)
int targetDay = dayofmonth(targetInput)
int dayOpen = dayofmonth // The built-in `dayofmonth` variable holds the day of the month of the bar open.
int dayClose = dayofmonth(time_close)
bool day_isBetweenOpenAndClose = (targetDay >= dayOpen) and (targetDay < dayClose)
bool isTargetDay = timeframe.ismonthly or targetDay == dayofmonth or day_isBetweenOpenAndClose
bool TF_isOneHourOrLess = timeframe.in_seconds() <= (60 * 60)
bool TF_isAboveOneHour = timeframe.in_seconds() > (60 * 60)
bool TF_isAboveOrEqualToOneHour = timeframe.in_seconds() >= (60 * 60)
bool TF_isDayOrAbove = timeframe.isdwm
int targetHour = hour(targetInput)
int hourOpen = hour // The built-in `hour` variable holds the hour of the bar open.
int hourClose = hour(time_close)
bool hour_isBetweenOpenAndClose = (targetHour >= hourOpen) and (targetHour < hourClose)
bool isTargetHour = TF_isDayOrAbove or
(TF_isOneHourOrLess and (targetHour == hourOpen)) or
(TF_isAboveOneHour and hour_isBetweenOpenAndClose)
int minuteOpen = minute // The built-in `minute` variable holds the minute of the bar open.
int minuteClose = minute(time_close)
int targetMinute = minute(targetInput)
bool minute_isBetweenOpenAndClose = (targetMinute >= minuteOpen) and (targetMinute < minuteClose)
bool isTargetMinute = TF_isAboveOrEqualToOneHour or minute_isBetweenOpenAndClose
bool isTargetTime = isTargetYear and isTargetMonth and isTargetDay and isTargetHour and isTargetMinute
bgcolor(isTargetTime ? color.new(color.green, 70) : na)
Note that:
- The script does not work on timeframes less than one minute, because the time input does not use seconds. The script could be extended to work on timeframes of one month and higher.
- We use
confirm = true for the time input, which prompts the script user to select a date and time when the script first loads on the chart. The time selected in this way is always equal to the time of the selected bar’s open, but the user can change it in the “Settings” window.
- We use the built-in variables year, month, dayofmonth, hour, and minute, which store the time of the current bar’s open.
- We use the built-in functions year(), month(), dayofmonth(), hour(), and minute() to retrieve the time of the current bar’s close, and to evaluate the time that is input by the user.
To determine the date on which the highest value occurred, the following example script uses the ta.highest() function to find the highest value within a certain lookback period, and the ta.highestbars() function to find how many bars back this value occurred.
If the highest point occurs on the current bar, the number of bars back, or offset, is zero. In our example script, when this condition is met, we update labels showing the time at the respective highest or lowest price.

//@version=6
indicator("Date of High/Low", overlay = true)
int lengthInput = input.int(20)
// Create labels. They do not display until the na values for the time and price are updated with new values.
var label hiLabel = label.new(na, na, "", color = na, textcolor = color.lime)
var label loLabel = label.new(na, na, "", color = na, textcolor = color.fuchsia)
// Find the highest and lowest values over the input lookback and the bars on which they occurred.
float hiValue = ta.highest(lengthInput), float loValue = ta.lowest(lengthInput)
float hiOffset = ta.highestbars(lengthInput), float loOffset = ta.lowestbars(lengthInput)
// If the high or low occur on the current bar, update the label and time variables.
if hiOffset == 0
label.set_xy(hiLabel, bar_index, hiValue)
label.set_text(hiLabel, str.format_time(time, "YYYY.MM.dd @ HH:mm:ss"))
if loOffset == 0
label.set_xy(loLabel, bar_index, loValue)
label.set_text(loLabel, str.format_time(time, "YYYY.MM.dd @ HH:mm:ss"))
// Plot the highest and lowest values.
plot(hiValue, "High", color.lime)
plot(loValue, "Low", color.fuchsia)
Note that:
- We declare the high and low labels with var but supply na values for the x and y coordinates, so that the labels do not appear until these parameters are defined.
- When the bar offset functions return zero, we modify the respective label to display the bar time.
- The script plots the highest and lowest level for visual reference.
The following example script demonstrates three methods for detecting bars that open at 18:00 hours:
Check the current bar’s time
We check whether the built-in hour variable is equal to eighteen and the minute variable is equal to zero.
Detect the start of the session
Using the time() function with a time-based session string returns the time of the current bar if it is within the session time. If it’s outside the session time, the function returns na.
We determine the first bar that falls within the session by verifying that the current returned time is not na but was na one bar earlier.
Check current time against a timestamp
We generate a timestamp using the timestamp() function by specifying 18 hours and 0 minutes, as well as the current day, month, and year. We then verify whether the bar’s time matches this timestamp.
//@version=6
indicator("18:00 hours", overlay = true)
int timeInSession = time(timeframe = timeframe.period, session = "1800-1900")
int timestamp1800 = timestamp(year, month, dayofmonth, 18, 00, 00)
bool method1 = hour == 18 and minute == 00
bool method2 = not na(timeInSession) and na(timeInSession[1])
bool method3 = timestamp1800 == time
plotchar(method1 ? 1 : na, "method1", "", location.abovebar, color.red, text="1", size=size.tiny)
plotchar(method2 ? 2 : na, "method2", "", location.abovebar, color.orange, text="2\n", size=size.tiny)
plotchar(method3 ? 3 : na, "method3", "", location.abovebar, color.yellow, text="3\n\n", size=size.tiny)
Note that:
Normally, variables reset every time the script performs a new iteration. This process is called rollback and is described in the Execution model page of the User Manual.
By contrast, variables declared with varip preserve their values between realtime updates. This behavior allows scripts to track conditions during bars.
The following example script uses the secondsSince() function from the PineCoders’ time library. This function uses variables declared with varip to track the number of seconds that elapse within a realtime bar while a condition remains true.
Our script waits for price to move a user-defined number of ticks from the open, and then starts a timer. When the appropriate number of seconds elapses, it triggers an alert. A table displays these conditions in real time.
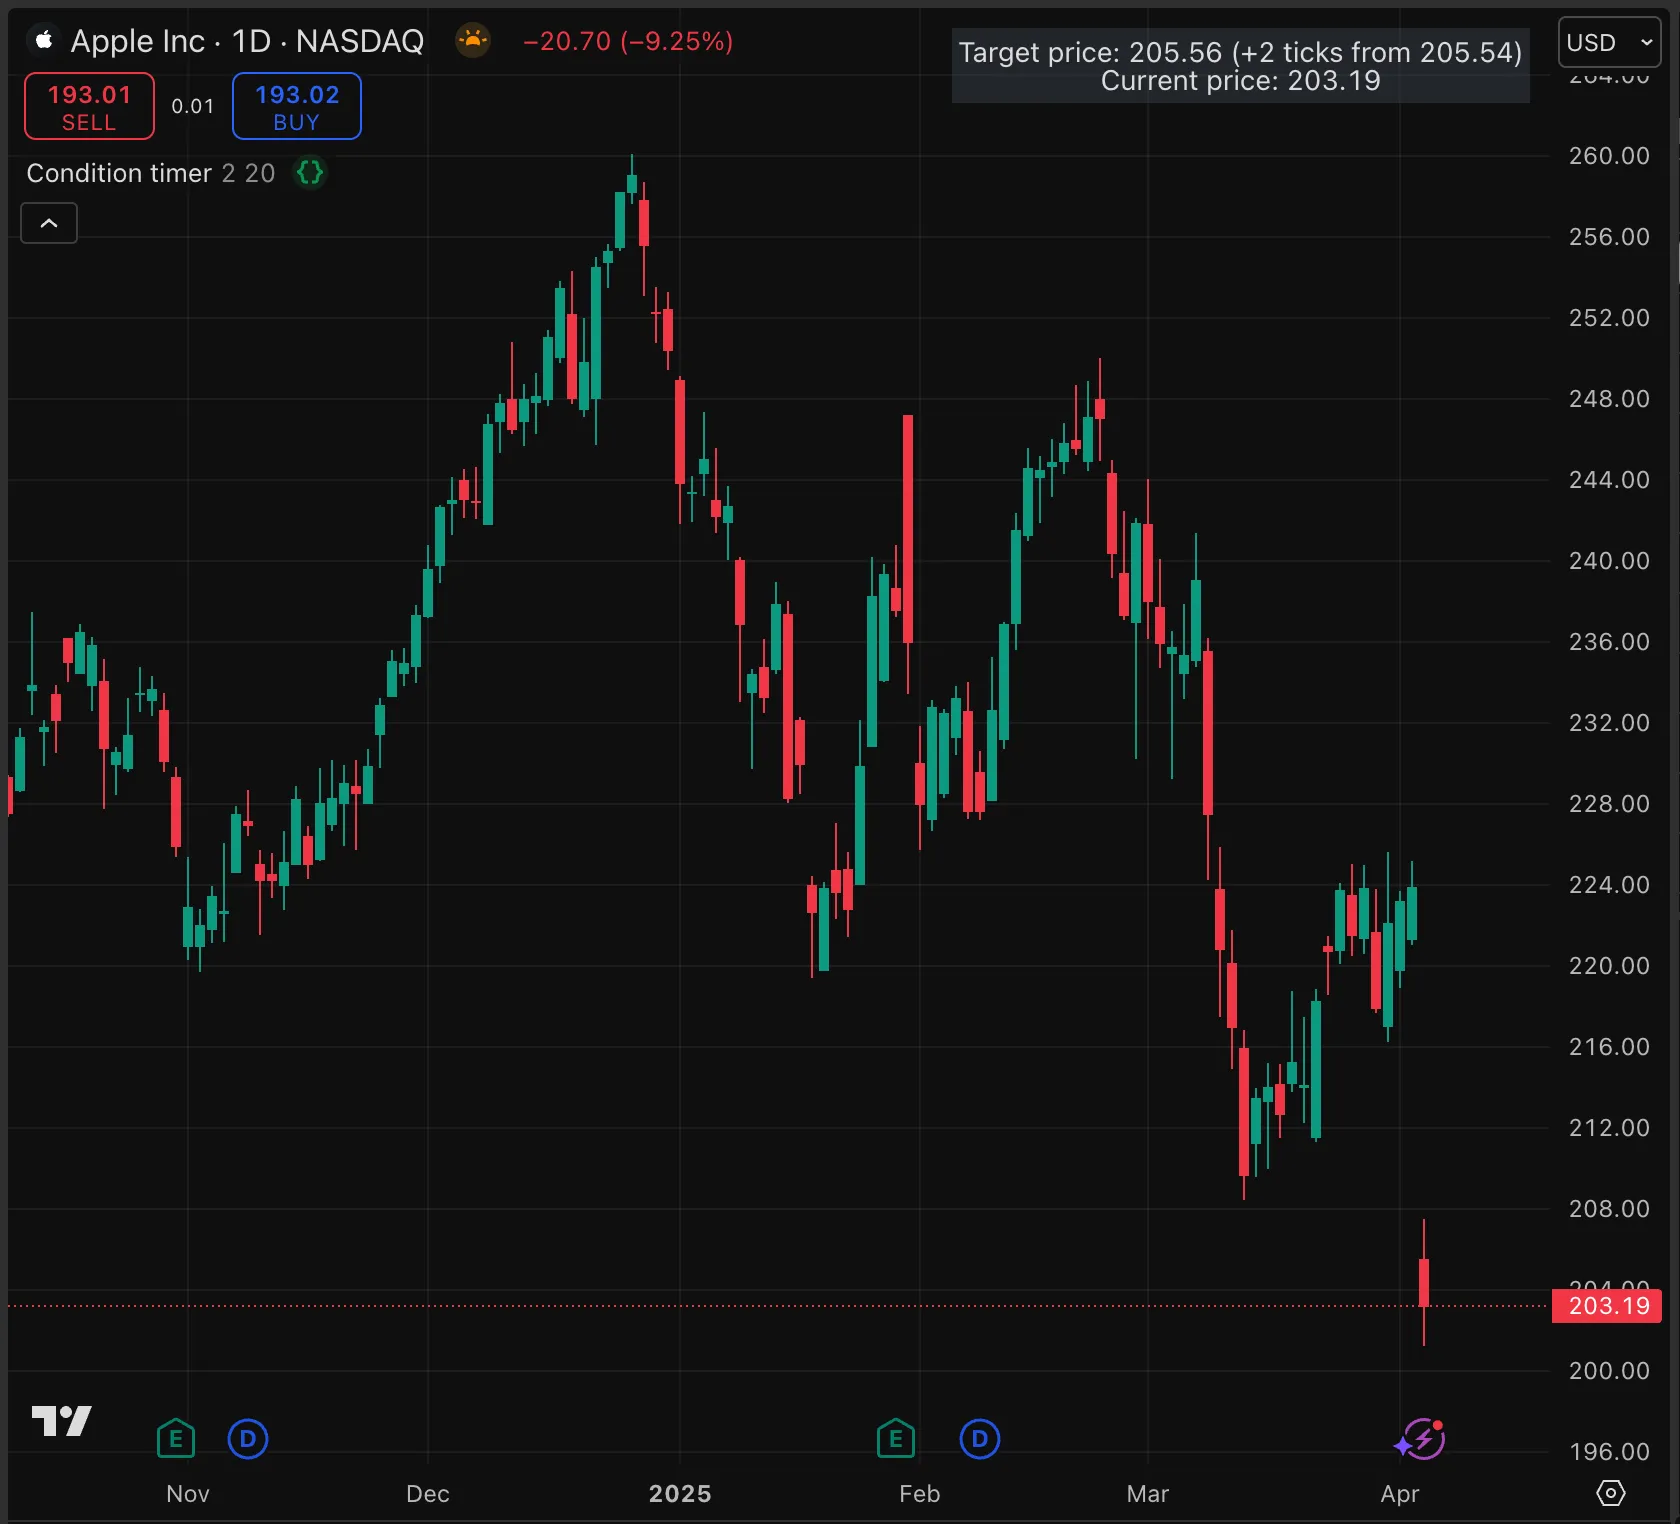
//@version=6
indicator("Condition timer", overlay = true)
import PineCoders/Time/4 as PCtime
string TICKS_TT = "The number of ticks price must move above the open to trigger the alert."
string SEC_TT = "Seconds for which the condition must be continuously true before the alert triggers."
string RESET_TT = "When checked, the duration resets every time a new realtime bar begins."
int ticksInput = input.int(2, minval = 1, title = "Number Of Ticks From Open", tooltip = TICKS_TT)
float secondsInput = input.int(20, minval = 10, title = "Seconds condition must last", tooltip = SEC_TT)
bool resetInput = input.bool(true, title = "Reset timing on new bar", tooltip = RESET_TT)
float targetTicks = open + (syminfo.mintick * ticksInput)
bool targetTicksReached = close >= targetTicks
// Calculate seconds elapsed since price reached the target.
int secondsSinceTarget = PCtime.secondsSince(targetTicksReached, resetInput and barstate.isnew)
bool timeAlert = secondsSinceTarget > secondsInput // Has the timer expired?
string alertTime = str.format_time(secondsSinceTarget * 1000, "mm:ss") // Format a time string for the timer label.
// Set the contents for the label depending on the stage of the alert timer.
string alertString = "Waiting for price to reach " + str.tostring(targetTicks) + "(" + str.tostring(ticksInput) +
" ticks from " + str.tostring(open, format.mintick) + ")\nCurrent price: " + str.tostring(close, format.mintick)
alertString := timeAlert ? "Timed Alert Triggered\n\n" + alertTime : targetTicksReached ?
"Condition Detected...\n\nTimer count\n" + alertTime : alertString
if barstate.islast
var table statusTable = table.new(position.top_right, 1, 2, bgcolor = color.new(color.black, 70))
// Row 1: Combined tick conditions and current status
string row1Text = "Target price: " + str.tostring(targetTicks, format.mintick) + " (+" + str.tostring(ticksInput)
+ " ticks from " + str.tostring(open, format.mintick) + ")\n" +
(targetTicksReached ? "Price condition reached" : "Current price: " + str.tostring(close, format.mintick))
table.cell(statusTable, 0, 0, row1Text,
text_color = chart.fg_color,
bgcolor = targetTicksReached ? color.new(color.blue, 50) : color.new(color.black, 70))
if targetTicksReached // Only show the timer on row 2 when the price condition is reached.
string row2Text = "Time required: " + str.tostring(secondsInput) + " seconds\n" +
(timeAlert ? "TIMED ALERT TRIGGERED" : "Timer: " + alertTime)
table.cell(statusTable, 0, 1, row2Text,
text_color = chart.fg_color,
bgcolor = timeAlert ? color.new(color.green, 50) : color.new(color.blue, 50))
if timeAlert // Fire alert if timer is triggered.
alert("Timed Alert Triggered")
Note that:
- The
secondsSince() function from the PineCoders’ time library resets the timer if the supplied condition (in this case, the price condition) becomes false at any time.
- The
secondsSince() function only works in real time, because it relies on intrabar updates, which are not present on historical bars. Therefore, it is possible for the timer to exceed a given specified time, especially on symbols with low liquidity, if a bar update does not occur around the time that the timer should finish.
- We include the option to reset the timer on every bar or not, for demonstration purposes. The price condition in this example script resets on each bar, but other implementations might use different conditions.
For more information on the secondsSince() function and the use of varip variables, consult the PineCoders’ Using varip variables publication.
The following example script colors the background of the nth occurence of a user-configurable weekday. This identification can be useful for scheduled events that occur on specific weekdays, such as certain options expiry days.
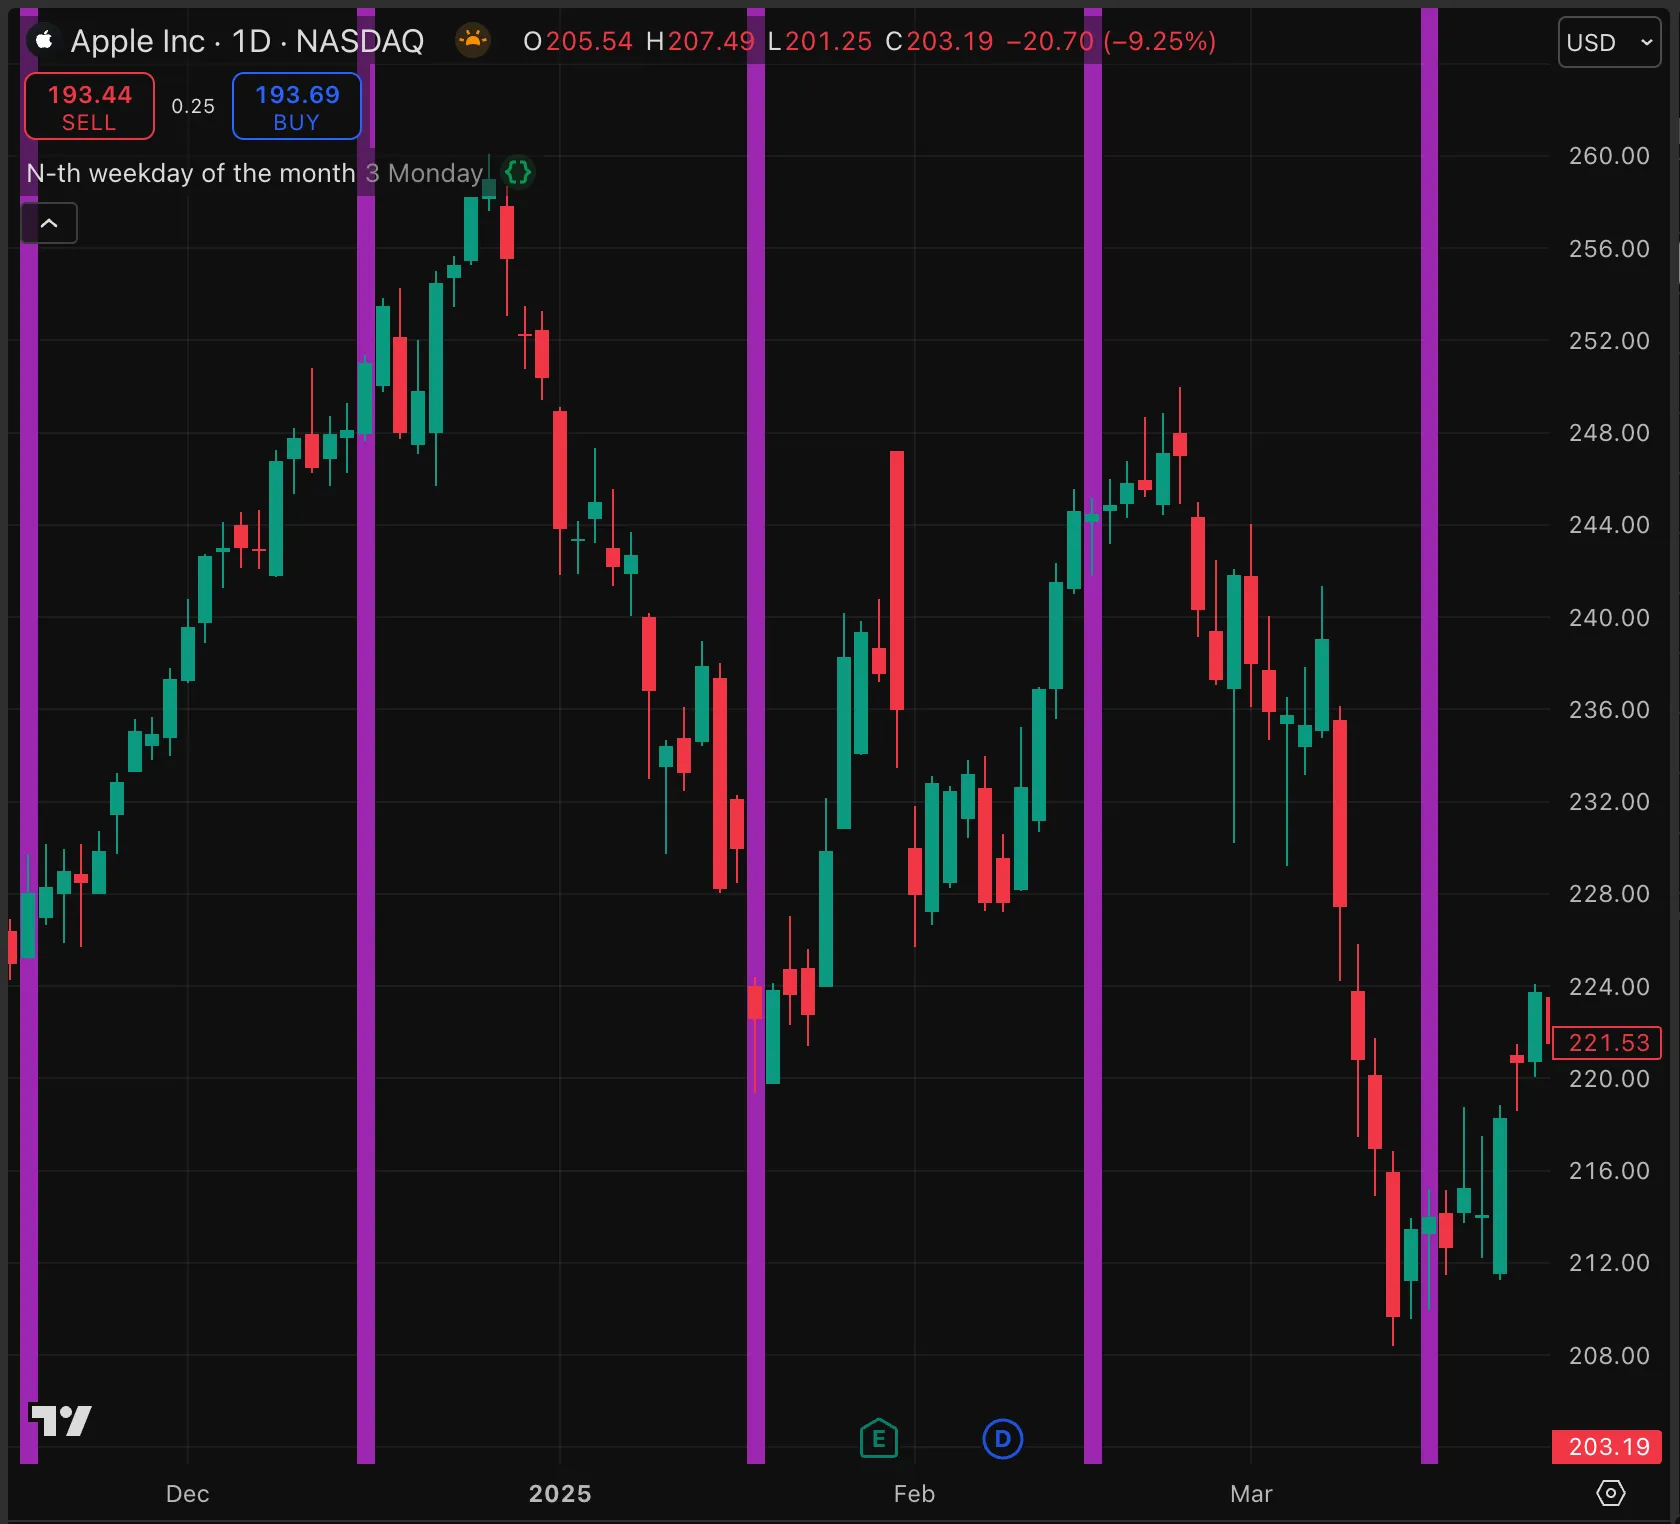
// @version=6
indicator("N-th weekday of the month", overlay = true)
int occurrenceInput = input.int(3, "Occurrence", 1, 5) // The occurrence of the weekday to check for in the current month.
enum Wday
Mon = "Monday"
Tue = "Tuesday"
Wed = "Wednesday"
Thu = "Thursday"
Fri = "Friday"
wdInput = input.enum(Wday.Mon, "Weekday")
int weekdayInt = wdInput == Wday.Mon ? 1 : wdInput == Wday.Tue ? 2 : wdInput == Wday.Wed ? 3 : wdInput == Wday.Thu ? 4 : wdInput == Wday.Fri ? 5 : na
// @function Calculates the number of days in a specified month, accounting for leap years.
// @param yearNumber (int) The year of the `monthNumber` month. Optional. Default is the current year.
// @param monthNumber (int, optional) The month for which to find the number of days. Optional. Default is the current month.
// @returns (int) The number of days in the `monthNumber` month of the `yearNumber` year.
daysPerMonth(int yearNumber = year, int monthNumber = month) =>
bool isLeapYear = (yearNumber % 4 == 0 and yearNumber % 100 != 0) or (yearNumber % 400 == 0)
int result = switch
monthNumber == 2 => isLeapYear ? 29 : 28
=> 31 - (monthNumber - 1) % 7 % 2
//@function Creates a timestamp representing the N-th occurrence of a specified weekday within a given month.
//@param yearNumber (int) The year of the timestamp.
//@param monthNumber (int) The month of the timestamp.
//@param weekdayNumber (int) The weekday of the timestamp. Can be a value between 1 and 7, where 1 is a Monday.
//@param occurrence (int) The occurrence of the `weekdayNumber` to check for.
//@returns (int) The timestamp at the N-th `occurrence` of the `weekdayNumber` in the month.
weekdayOfMonth(int yearNumber, int monthNumber, int weekdayNumber, int occurrence) =>
int startTime = timestamp(yearNumber, monthNumber, 1)
int daysInTheMonth = daysPerMonth(yearNumber, monthNumber)
int endTime = timestamp(yearNumber, monthNumber, daysInTheMonth)
int weekday = dayofweek(startTime) - 1
if syminfo.timezone == "Etc/UTC" and not timeframe.isintraday
weekday -= 1
if weekday == 0
weekday := 7
int offset = weekdayNumber - weekday
if offset < 0
offset := 7 + offset
int result = startTime + (offset + 7 * (occurrence - 1)) * 86400000
if result > endTime
result := na
result
int occurrenceTime = weekdayOfMonth(year(time_close), month(time_close), weekdayInt, occurrenceInput)
bool isAtOccurrence = time_close[1] < occurrenceTime and time_close >= occurrenceTime
plot(occurrenceTime, "Time of the N-th weekday occurrence", color.orange, display = display.data_window)
plot(time_close, "Bar close time", display = display.data_window)
bgcolor(isAtOccurrence ? color.purple : na, title = "Time condition highlight")
Note that:
- We use an enum input to specify the target weekday, and convert it to an integer using a switch structure.
- The custom function
daysPerMonth() calculates the number of days in any given month, considering leap years.
- The
weekdayOfMonth() function determines the timestamp for the nth occurrence of a selected weekday within a specific month. This function first calculates the start time of the month and assesses the total number of days it contains. The function accounts for the unique characteristic of futures symbols, which begin trading on Sunday night, potentially causing a one-day discrepancy in the calculation.
- We plot the time of the bar close and of the occurence to the Data Window.
Users can display a countdown on the price scale of the chart that shows the time remaining in each bar, by enabling the “Countdown to bar close” option in the “Scales and lines” section of the chart “Settings” menu. Our example script below displays a similar countdown timer.
This script functions on intraday and “1D” timeframes only. For timeframes longer than “1D”, more complex logic is necessary. The script throws a runtime error if the chart timefrmae is greater than one day.
We subtract timenow from time_close to calculate the time remaining in the current bar, and then display the result in a table.
Because Pine scripts run only when there is a chart update, countdown timers do not usually update every second. The script refreshes more often on symbols with higher liquidity.
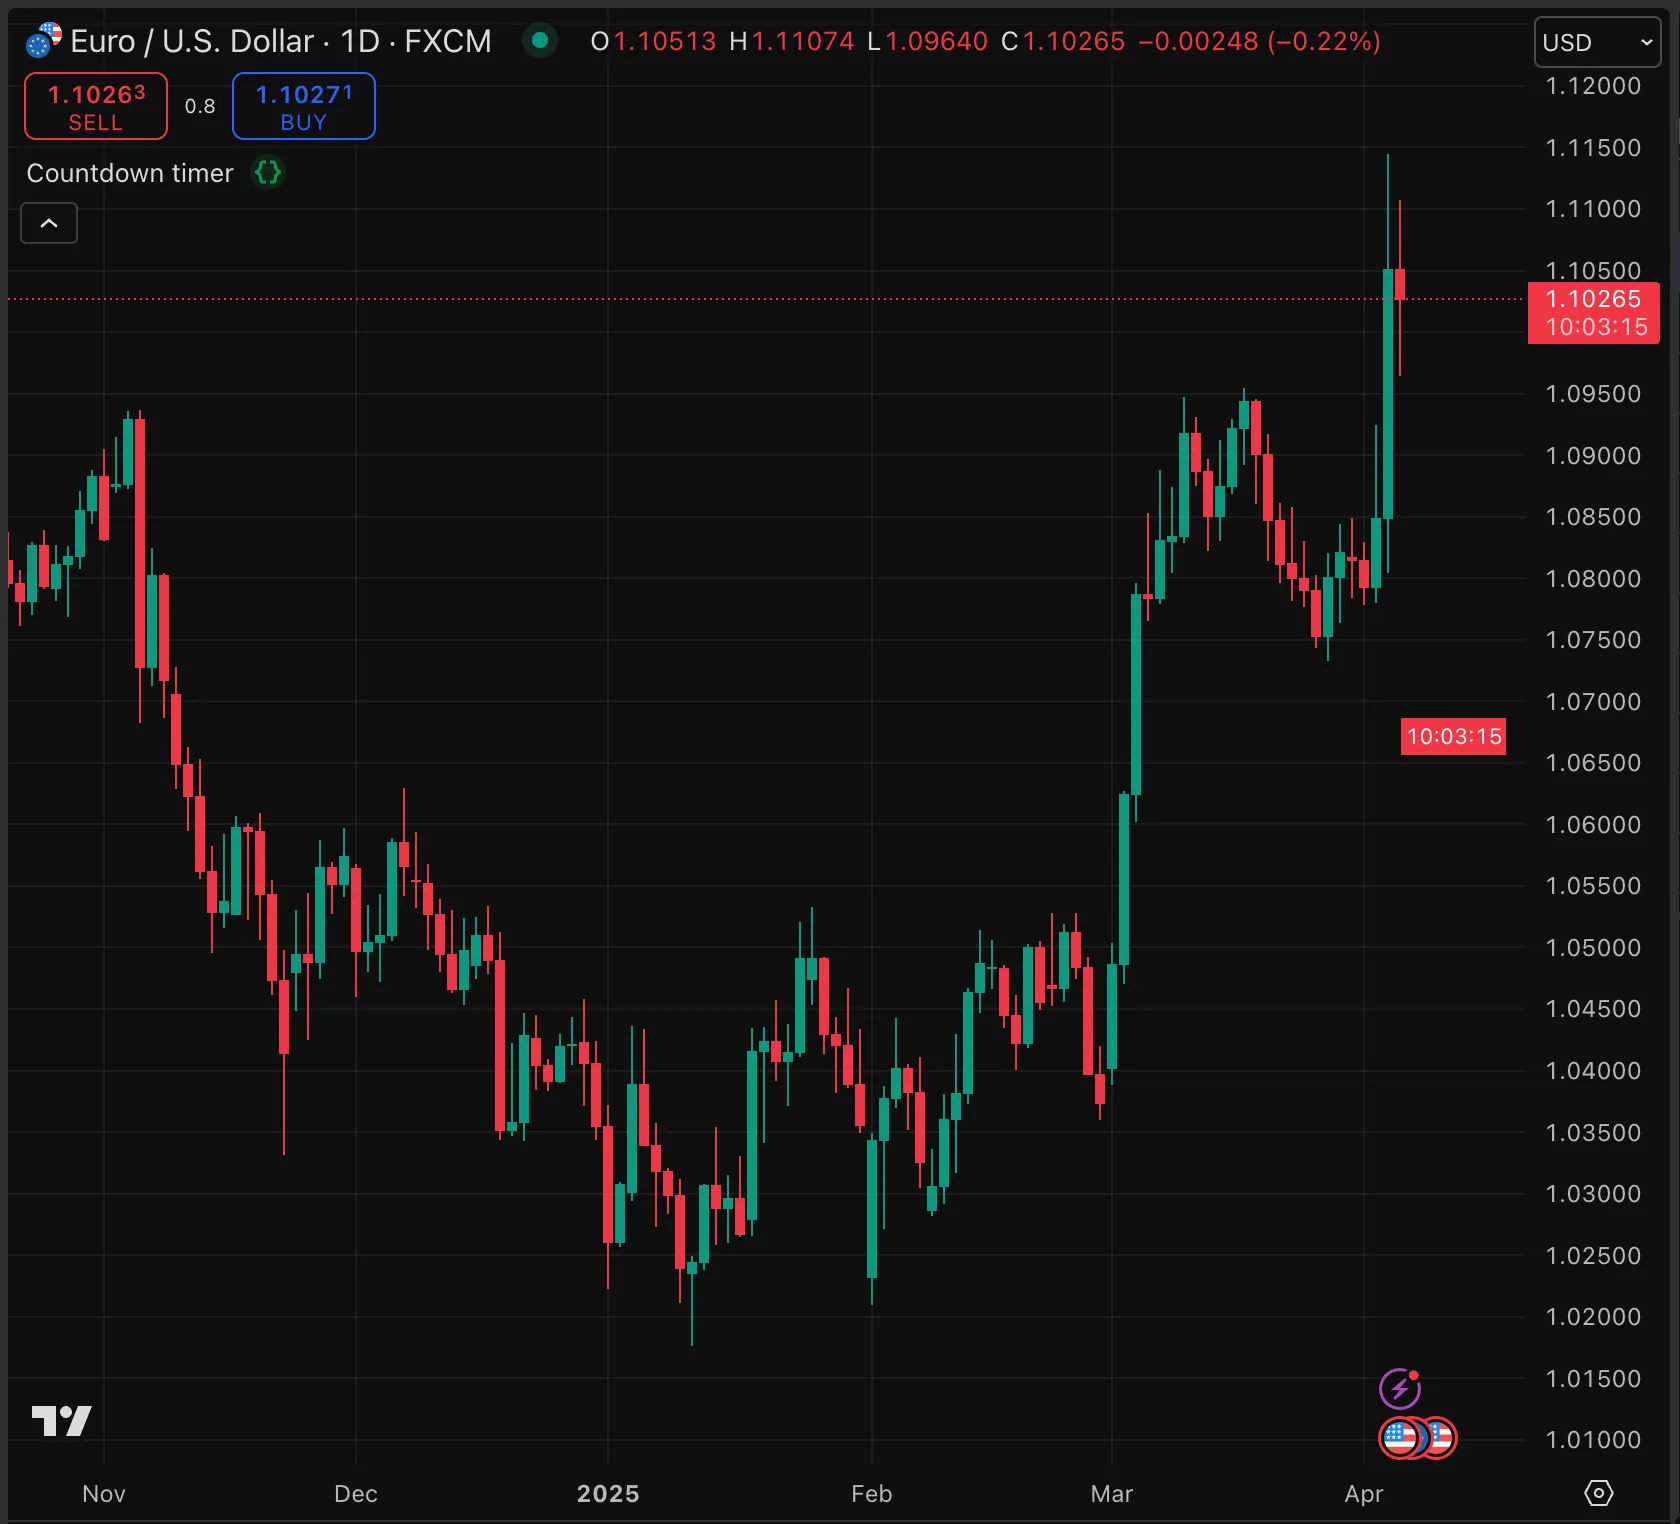
//@version=6
indicator("Countdown timer", overlay = true)
if not ((timeframe.isdaily and timeframe.multiplier == 1) or timeframe.isintraday)
runtime.error("This script functions only on daily or intraday timeframes.")
// Inputs for bullish and bearish candle colors
color bullishCandleColor = input.color(color.green, "Bullish Candle Color")
color bearishCandleColor = input.color(color.red, "Bearish Candle Color")
// Analyse the candle colors to see if black or white text has better contrast
f_contrastColor(bgColor) =>
// Calculate luminance (relative brightness) using standard formula
luminance = 0.2126 * color.r(bgColor) + 0.7152 * color.g(bgColor) + 0.0722 * color.b(bgColor)
contrastColor = luminance > 127.5 ? color.black : color.white
color bullishContrastColor = f_contrastColor(bullishCandleColor)
color bearishContrastColor = f_contrastColor(bearishCandleColor)
int timeLeftInBar = time_close - math.min(timenow, time_close)
var table timer = table.new(position = position.middle_right, columns = 1, rows = 1)
if barstate.isfirst
table.cell(timer, 0, 0, text_color = chart.fg_color, text_size = 11)
else if barstate.islast
string timeFormat = timeLeftInBar >= 60 * 60 * 1000 ? "HH:mm:ss" : "mm:ss"
string countDown = str.format_time(timeLeftInBar, timeFormat, "UTC-0")
table.cell_set_text(timer, 0, 0, countDown)
bool isUpCandle = close >= open
table.cell_set_text_color(timer, 0, 0, isUpCandle ? bullishContrastColor : bearishContrastColor)
color bgcolor = isUpCandle ? bullishCandleColor : bearishCandleColor
table.cell_set_bgcolor(timer, 0, 0, bgcolor)
Note that:
- We use the str.format_time() function to present the timestamp in a format similar to the price scale countdown timer. The function uses a conditional format so that we display hours only if the time remaining is one hour or greater.
- The built-in bar countdown uses a background the same color as the current candle. Pine scripts do not have access to the chart candle color settings, but if the user sets the correct colors in the script settings, our countdown displays in the same way.
- We use a custom function to analyze the luminance of the background colors and decide whether black or white text has the better contrast.
Counting the week of the month in which the current bar occurs is not always straightforward. Some symbols trade overnight, so the time of the bar open is technically the previous day to the bar close, and sometimes the previous week. Because weekofyear, month, and similar variables use time (the time of the bar open) in their calculations, they can give unexpected results.
The following example script, which uses these variables, gives unexpected results on some symbols such as US futures charts. For example, it increments the number of weeks on a Tuesday if the first trading day of the month is a Monday.
// @version=6
indicator("Week of month demo 1")
bool isNewWeek = ta.change(weekofyear) != 0
bool isNewMonth = ta.change(month) != 0
var int weekCount = na
weekCount := timeframe.ismonthly ? na : isNewMonth ? 1 : isNewWeek ? weekCount + 1 : weekCount
plot(weekCount, "Week of month", chart.fg_color)
bgcolor(isNewWeek ? color.new(chart.fg_color, 90) : na)
bgcolor(isNewMonth ? color.new(color.lime, 80) : na)
The following amended script version uses the functions weekofyear() and month() instead of the equivalent variables, and evaluates the time_tradingday variable, which, unlike time, returns the beginning time of the trading day that the bar belongs to. Using this variable, and fixing the time zone to “UTC”, avoids problems with sessions that span days.
// @version=6
indicator("Week of month demo 2")
bool isNewWeek = ta.change(weekofyear(time_tradingday, "UTC")) != 0
bool isNewMonth = ta.change(month(time_tradingday, "UTC")) != 0
var int weekCount = na
weekCount := timeframe.ismonthly ? na : isNewMonth ? 1 : isNewWeek ? weekCount + 1 : weekCount
plot(weekCount, "Week of month", chart.fg_color)
bgcolor(isNewWeek ? color.new(chart.fg_color, 90) : na)
bgcolor(isNewMonth ? color.new(color.lime, 80) : na)
While the preceding examples are useful for understanding the difference between time and time_tradingday, the simplest solution is to use the timeframe.change() function, which detects changes in a given timeframe. We can rewrite the boolean conditions in our example script as follows:
bool isNewWeek = timeframe.change("1W")
bool isNewMonth = timeframe.change("1M")
Note that:
- All versions of the script reset the number of weeks at the beginning of the month, then increment the count each new week.
- These scripts do not plot anything on timeframes of one month or greater.
- In Pine V5 and below, scripts can assign values of type “float” and “int” to a boolean variable. A value of zero is equivalent to false, and any other value to true. In later versions of Pine, scripts can assign only boolean values to boolean variables. So in V5, this code works:
bool isNewMonth = ta.change(month) but in later versions this equivalent code is needed: bool isNewMonth = ta.change(month) != 0.