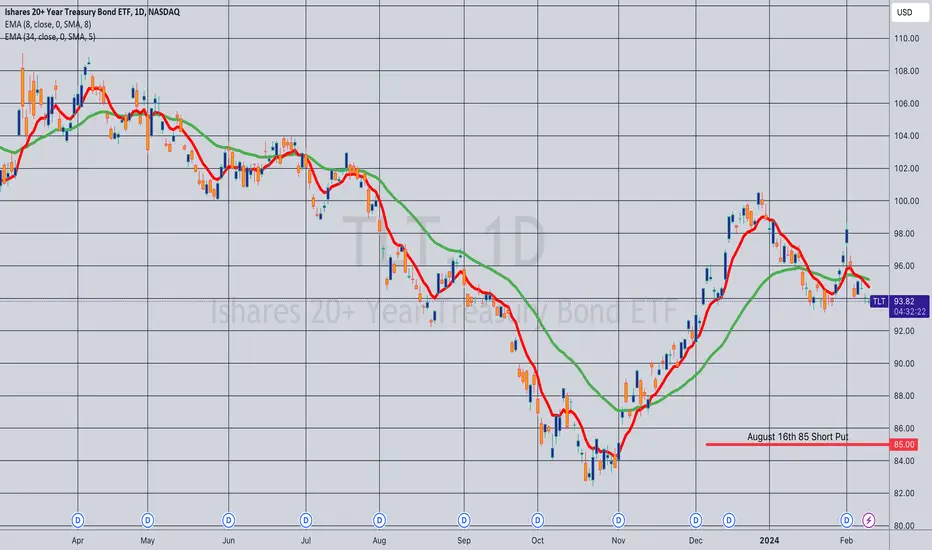
Opening (IRA): TLT August 16th 85 Short Put... for a .98 credit.
Comments: Targeting the strike paying around 1% of the strike price in credit, adding to my position at intervals, assuming I can get in at strikes better than what I currently have on.
ETF market
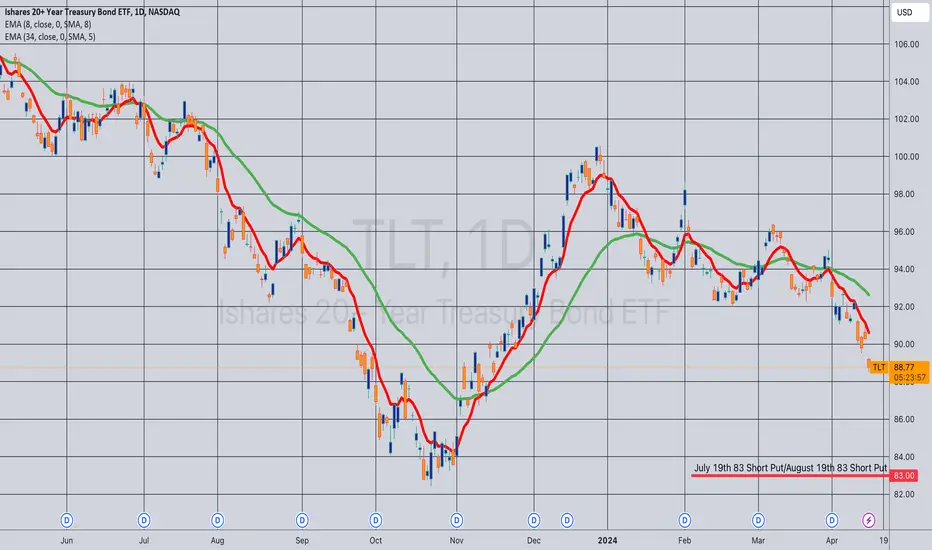
Opening (IRA): TLT July 19th 83/August 16th 83 Short PutsComments: Getting in at strikes better than what I currently have on in July and August.
July 19th 83: Filled for an .85 credit
August 16th 83: Filled for a 1.11 credit
I'm fine with potentially getting assigned with shares at 83, since they're way below the cost basis of the covered calls I currently have on. I knew this might end up being a very, very long duration trade that would potentially take time to work out, but ... yeesh, the weakness.
Will look to roll out the most at risk strikes I've got in July (at the 86) and August (at the 85) at some point ... .
SPY and the othersRSI divergence, fading volume on rising price, leave us….untrusting….neutral is our position.

SPY Bullish Breakout And A New All Time High! Buy!
Hello,Traders!
SPY is trading in a strong
Uptrend and the index
Just broke the key
Horizontal level of 525$
And the breakout is
Confirmed which reinforces
Our bullish bias and we will
Be expecting a further
Bullish move up
Buy!
Like, comment and subscribe to help us grow!
Check out other forecasts below too!

SPY: OverheatedWe've seen a wild +25% rally since Oct 2023 in SPY. Honestly, I did not expect this move back in Oct, especially since we broke down below the MAs and they acted as resistance for 3 weeks. However, the market doesn't care about what we think it will do.
I don't like calling tops, but nothing goes straight up. With the crypto market building up hype as well, I think we are reaching a stage of local euphoria. Greed is pretty high right now.
IF this is a local top, THEN I think testing the previous ATH is the most likely scenario before continuing up.
We could see it drop to anywhere between 480-470 in the next month or so. This coincides with where the 21W EMA and 20W MA are. We also saw good volume around those prices in the last couple of years. The 0.236 fib retracement level sits at 472. Lastly, the RSI has reached the red Bollinger Band and is overbought at 77.
This is not financial advice. Trade at your own risk.

XLF To RallyXLF normally moves quite slowly, but we may may be at a moment in which that accelerates substantially, even improving on what has been a phenomenal year.
Weekly -
Daily -
The EW path drawn is what may be expected most commonly - we're looking for that or better.

US Small Caps ContinuationSurprised to see IWM fairly restrained in this upward trend as long term interest rates dropped significantly on todays CPI report. Really expect to see a quick catchup over the next few days as SPY and QQQ make new highs.

QQQ Potential Paths Moving ForwardQQQ made a new ATH today and may close even higher. I think it will run up until it retests its ascending channel from earlier in the year.

Long SQQQ 9.95Target 12
As you can see, SQQQ RSI (9) never has been so low in this time frame ....8
Market is ultraoverbought and I expect a huge reversal.
Regards,

Expired SPY Weekly outlook. 3rd WK MAY 2024Expired SPY Weekly outlook. 3rd WK MAY 2024
> BULLISH 📈 CORRECT
Closed Price: 520.84
Target Price: 524 | Strike Price: 528 MAY15 24'
Upper Range: 532
Lower Range: 516

SPY simple chart analysis: following previous post ideaElliot Wave finished forming the A of ABC correction just on the fourth wave of giant minor E.W. D1 t.f.. Two sets of abcde waves finished and builded a complete smaller abc correction, giving open doors for a bullish momentum.
Trend still can continue until 300% of E.W. fibonacci.
fibonacci is between the 0 and 2 of E.W., starting from 50% instead of 0.
It already passed atractive channel giving opportunity for sideways.
Note: I sugest to not take this trade if you are starting it😋.

$BITX callI'm bullish on $BTC.
I just bought AMEX:BITX March 2025 $20 call for $24.
Will hold them into 2025.


#ARKK to have a strong recovery Target 1 I expect to come quite quickly ... closely correlating to a strong bounce in #BITCOIN
My overall thesis for an Equity top in April 20024 is now firmly in place.

Rising supply could act as a headwind for uranium pricesThe price of uranium, known as yellow cake, has more than doubled in the past year amid a significant imbalance between supply and demand in the global market, sending uranium-related assets soaring to the sky. In addition, the return of Japanese appetite for carbon-free energy and the restart of two nuclear reactors last year, along with plans to restore more units in 2024, also contributed to rising prices. Then, more recently, the announcement of the U.S. ban on Russian imports of uranium and the approval of the GX Decarbonization Power Supply Bill in Japan, aimed at creating a carbon-free energy supply, have had the same effect, helping uranium to regain strength after a brief selloff in February and March 2024.
Illustration 1.01
Uranium-related assets, including Global X Uranium (URA), Sprott Physical Uranium Trust (SRUUF), Sprott Uranium Miners ETF (URNM), and Uranium Energy Corporation (UEC), all recorded huge gains in the past year or so.
Since the start of 2024, uranium has gained approximately 4.7%. Yet, for the year, its performance has been flat, which begs the question of whether the rally is not overdone at this point when the supply is coming online around the world, raising chances of the market moving toward balance and potentially leading to stabilization or reversal in prices. According to the quarterly Domestic Uranium Production Report published by the U.S. Energy Information Administration (EIA), uranium production in the United States for the first quarter of 2024 already surpassed the total output last year. Moreover, data from 2021 and 2022 suggest countries like Australia and Canada are also trying to ramp up their production in response to rising prices.
Illustration 1.02
The image above illustrates the weekly graph of Global X Uranium ETF (URA) and a major resistance at $31.60.
Regarding Global X Uranium ETF (URA), it recorded remarkable 353% gains since its lows in 2020, coupled with a nearly 15% increase in the current year alone. However, despite these impressive gains, the ETF has encountered a significant hurdle at the $31.60 mark, signaling a potential barrier to further upside momentum. Besides that, there is a growing perception that events traditionally viewed as catalysts for price appreciation are losing their potency over time, indicating a potential shift in market dynamics.
Technical conditions
Daily time frame = Bullish (losing momentum)
Weekly time frame = Bullish
Monthly time frame = Bullish
Please feel free to express your ideas and thoughts in the comment section.
DISCLAIMER: This analysis is not intended to encourage any buying or selling of any particular securities. Furthermore, it should not serve as a basis for taking any trade action by an individual investor or any other entity. Your own due diligence is highly advised before entering a trade.

MAHKTECHstock is in high momentum, wait for retracement till14.20. buy at 14.20, take sl 14, target is mentioned in the chart.holding period 6 month

Bullish pattern could be formedHi guys ! a bullish continuous head & shoulders pattern could be happen if neck line will be broken and price tolerate one day trading above 91, in such a scenario XBI could reach around 97, I will update the post later …..

Bullish pattern could be formedHi guys ! a bullish continuous head & shoulders pattern could be happen if neck line will be broken and price tolerate one day trading above 91, in such a scenario XBI could reach around 97, I will update the post later …..

$SPY May 15, 2024AMEX:SPY May 15, 2024
15 Minutes
The SPY is not retracing. It is resolving divergences and aligning moving averages through sideways movement.
Now as expected once 522.75 was crossed we are back in business.
I will consider two numbers.
The rise from 515.15 to 532.582 and 520.56 to 523.82.
Maintaining a hold at 518.5 is crucial for the former, while for the latter, 522 holds significance. Currently, 522 represents the 100 averages over a 15-minute span. Therefore, with this hold, my target ranges between 524.5 and 525.5.
Hence for the day I will buy on a retrace to 522 - 522.5 levels for a target 524.5 to 525.5.
I anticipate a retracement since the last bar reached the high of the day and closed near the low of the bar. Technically, I should only buy above the high. However, I am considering a retracement buy if it occurs.
On downside if AMEX:SPY breaks 521 I will short for 518.5 being 200 averages in 15 minutes.
Even though today I have only $2 on either side, I am willing to take a trade because the box has been broken and the sideways trend has ended.

Bearish cypher by AD/MONEY FlowAD running a bearish cypher pattern on the 4hr. Also money flow/AD peaking with price action. Price action also hit my 1.618 fib level which is bearish. Money Flow and AD needs to breakout above b leg, however the down trend looks In tact. Short term bearish outlook.

Long volatility - UVXYsee chart of UVXY, which tracks VIX. we're at an important FIB level and long-term trendline. I'm long as of now.

TGR pt.2 - SPY vs. gravityThis chart uses symmetric trajectories from the early distribution phases to estimate the path price will take to initiate markdown.
Initial target = 506-508. If SPY finds resistance at 516 then the initial target could hit by the end of this week (5/10). If SPY breaks above 516 it should find resistance at 518-520, and then the initial target will be delayed - 506-508 would likely still hit by 5/17 if the latter case is realized.
Goal Target = 492 by 5/13 earliest, 5/23 latest. Could extend lower into the 480s but still need a confirmation signal to establish time to target.
----------------------------------------------------------------------------------------------------------------
My Trade(s):
- Entered July 19 SPY 506 puts for 6.85 (underlying price = 515.47)
- Will Add if SPY continues higher (looking to add in the 518-520 range)
- Will Add if SPY closes back below 514.
================================================================================
This looks doomed, but is there enough residual demand to keep this afloat until June? Or will conjunctions of larger forces pull this further down in May...
It depends on if we break back below 514 - that's all it will take to spur a rapid selloff.
