Where will QQQ go from here?Slight correction is expected but long term trend line remains with target price of USD520 by 2025
ETF market

$SPY April 26, 2024AMEX:SPY April 26, 2024
15 Minutes.
The expected long was nullified by gap down.
But AMEX:SPY managed to close near 502 levels.
Now we have all moving averages consolidated together.
I have Elliott oscillator green, CCI green and stochastics above 75 with no black bar on top.
Now for the rise from 493.86 to 507.37 AMEX:SPY retraced more than 61.8%.
Also, we have multiple resistance around 506 levels in chart as it can be seen.
For the fall from 515.30 to 493.86 we have 61.8% retracement around 507 levels.
I expect AMEX:SPY to be in the range 507 to 510 on upside today, provided it holds 502 levels.
If that happens then we can assume AMEX:SPY managed to hold 100 days in daily and 21 in weekly, there by setting up a buy above 515 levels for next week.
I will go long only above 514 - 515 levels.
For the day as moving averages have converged, if AMEX:SPY opened gap up I will wait for first 15 minutes, and if close of bar is near low I will short for 503-504 as targets provided the gap open is around 507 to 510 levels with SL high of bar or 511.
The reason is for the fall 524 to 493, 512 is approximately 61.8% of retracement for the fall.
Hence I have a buy only above 514 levels.

QQQ rangbound bearish bias SHORTQQQ on the daily chart hit a hpivot high on 3/21 followed by a slight downtrend of 1-1.5 %
overall this past week. Buying volumes are low. The Price Momentum Oscillator has
reversed to bearish and the Raltive Trend Index has entered the chop zone and is heading
bearish. Price is presently one standard deviation above the intermediate-term anchored
VWAP. Reversion to the mean suggests another 1% move downside before VWAP support
exerts itself. Price is compressing in a symmetrical triangle. Accordingly, I am expecting
a move down before a potential reversal in a VWAP bounce from that support.

Utilities setting up?The daily chart on XLU provides rationale to keep a place on our watchlist. Recently it made a golden cross and seems to have broken free of a downdraft in price. Now it looks like the RSI could be searching for overbought.
One option is a momentum trade targeting the $71+ price. Personally I'd like to see it hit overbought, then that a position of it pulls back down around the 50 & 200 day MSAs. Looks like with some patience there could be 15% out there depending on how things develop.

Dead cat bounce....?I see the bulls in the market attempting to cause us bears to panic. I believe this will be a short term "rally" that will only be the continuation of the downside trend.

QQQ Dancing on a High Wire $422.93: Golden Genesis fib and top?=QQQ is dancing on a high wire, a Golden Genesis fib at $422.93
Failure here could indicate top is in, so this is a key level here.
Just below is a fib confluence at $418, last stop before SERIOUS dip.
It is PROBABLE that we orbit this fib for a while.
It is POSSIBLE to bounce here and keep going up.
It is PLAUSIBLE a bull trap / distribution is done.
Here is a snapshot of the Genesis Sequence for the Q's:
=================================================================================================

$SPY 4hr double bottom could push it to trend/monthly resistancePossible double bottom here. Watching for a continued push to the trend line and major monthly resistance.

Possible H&S on 15minI am out for now. if we reach 502.50 SPY may be making right shoulder.
However, There is that massive gap that needs to be filled so it may be just a quick scalp.

BITO @ $39 Jun '24I feel increasingly isolated among the growing crowd of bears but I believe BITO has formed a textbook flag pattern. My argument:
Following a sharp move upward, beginning 3/14 (6 weeks from the time this was published), price has declined in 3 drives forming a clear channel but didn't break the 50% retracement level while volume has steadily declined during the formation of the flag. If I'm correct, a movement similar to the one that makes the flagpole would put the price right at the .382 level which I believe further supports my argument.
Full disclosure: this is all based strictly on technical analysis and I have limited experience in dealing with crypto or it's derivatives so there could be something I'm missing. It's entirely plausible that I'm completely wrong but I'd appreciate any feedback from the community

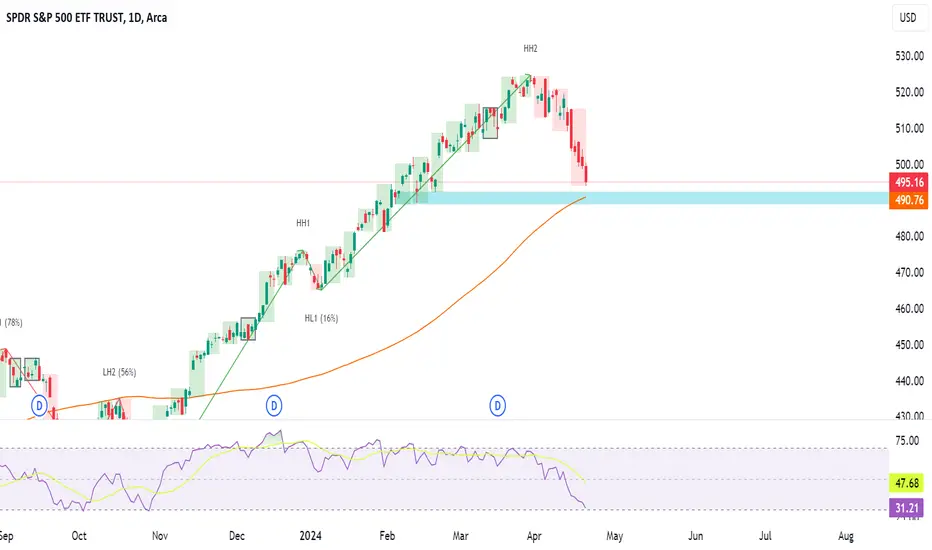
S&P Bears are strong but Bulls still have a chanceLast week, sellers firmly controlled the market. Buyers attempted to defend March's low, but the bears left them no chance. Prices consistently declined for six consecutive days, with the futures chart ( CME_MINI:ES1! ) appearing even more bearish.
We are now approaching a critical juncture, which presents a significant opportunity for buyers to take a stand. The daily RSI is nearing an oversold condition, and simultaneously, the price is approaching the SMA100 alongside a horizontal support level ( 490 ) from the February consolidation.
There is no absolute certainty that buyers will seize this opportunity, but we should closely monitor the price action next week. Although sellers have demonstrated their strength, we are still in a weekly uptrend, and trends do not end easily unless there is a radical shift in sentiment. Despite negative news in recent weeks, nothing has emerged as critically detrimental yet. However, this could change, so we must regularly reassess the situation as new information becomes available.
The short-term outlook remains bearish, but this could change depending on how the price reacts to these support levels.
Disclaimer
I don't give trading or investing advice, just sharing my thoughts.
Spy Short - 50sma Stop loss50sma - strong support / resi
Below - market is bearish
Above - market is bullish

QQQ - Bull, < 1WInstrument: QQQ
Direction: Long
Time Frame: 1W
Upper Target: 100DSMA
Lower Stop: ~413 (New Rel Low)
Reference Weekly Monday Journal for basis.

Looking for 515 if money flow breaks outPrice action needs to breakout of the descending wedge/triangle. If AD and money flow continues to rise and breakout of resistances spy can head to 515 level

Ibit bullish supply zoneI think here ibit its very bullish from here but also its too much risky anyway this with Hong Kong etf maybe can force the market price to go up

SPY just has a small gap to fill, then it's Chocolate Bananas!Before the massive sell off, SPY just had a small gap that needs attention. Then, plop plop plop. Chocolate Banana time

This is why I am taking on long calls the channel The chart posted is in a well defined channel that is parallel we are now retesting it . if we were to Break it . that would be BAD thing . But if we break it and close back above that that would be a GOOD thing .We had the Vix cycle peak come in within 1.5 days of the 4/15/4/17 and we are setting up for Moves in Both directions . Trade it this way
TLT to $86 and 20 year yield to 5.2% by 5/3/24?TLT to $86 and 20 year yield to 5.2% by 5/3/24? I think the current break out by long bonds into the 5%'s has enough momentum to take the 20 year to 5.2% and TLT to $86. Bought into TMV on 4/24/24 and will hold until we reverse. The PCE report on 4/26/24 will confirm this move or invalidate it.

SPY THIS WEEK OUTLOOKI will go short if we reject at around 520-521
Spy is out of its channel range and will try to reclaim it today.
If we break above it and retest it, then its a short term long.
If rejected and stays below 520-521 then its bearish to 516, 512, 490
the correction to 490 will come, just don't know when.

nasdaq gains mopped up and retracingi really like sqqq for reliable intraday swings that involve a sell heavy market that is retracing to highs. the environment in this index and risk assets such as in tech make sqqq an attractive play on this timeframe where a large inverse gain from a gap down in the underlying asset has faded into consolidation in the intermediate term.

$SPY Does it Need a Bigger Correction?I have zoomed out to larger timeframes on AMEX:SPY to come up with some larger / longer timeframes. Here is what I started with; the weekly chart (shown) then zoomed out to the Monthly Chart (not shown) to draw the February 2009 trendline. I came back to the weekly to find the March 2020 trend. I then looked that the latest run starting in October 2023. That trend line is almost parabolic and was unsustainable.
I am not making any prediction here, but it would be prudent to have a plan for a larger correction. I have horizontal lines near the top of the chart that were drawn using the daily chart and it is possible that one of them (or none) could be support areas. It is all to be determined. Keep an open mind. Corrections can happen in price or time or a combination of both.
I would like to point out that on any of the charts that I post I am only correct about 50% of the time. My posts are more about self-accountability than anything else. However, I do hope that you find some value in the technical aspect of the posts.
Thanks for looking.

QQQ Scalping Zones 4/25Premarket levels have been working pretty good. Come join the team and bank!!
Upside Targets:
*419.98 - 421.07 - 422.90
Downside Targets:
*418.55 - 417.29 - 415.22
Daily Trend Tracker
*DXY - Bullish - *VIX - Bullish - *US10Y - Bullish

SPY My Opinion! BUY!
My dear friends,
My technical analysis for SPY is below:
The market is trading on 495.10 pivot level.
Bias - Bullish
Technical Indicators: Both Super Trend & Pivot HL indicate a highly probable Bullish continuation.
Target - 505.99
About Used Indicators:
A pivot point is a technical analysis indicator, or calculations, used to determine the overall trend of the market over different time frames.
———————————
WISH YOU ALL LUCK

Does ARK Innovation Have Downside Risk?The ARK Innovation ETF has chopped in a range for the last two years, and some traders may expect a push back to longer-term lows.
The first pattern on today’s chart is the rounded top in February and March. It was slightly below the peak of December 2023. The lower monthly high may suggest bears remain in control over the longer term.
A sharp drop in early April followed the topping pattern. That may add to the possibility of sellers taking control.
Second, Wednesday’s bounce retraced about half the decline. A lower high at this spot could confirm a downward move has begun. Prices also stalled at the February 5 low. Has old support become new resistance?
Next, ARKK is back below its 200-day simple moving average.
Finally, MACD has been falling.
Standardized Performances for ETF mentioned above:
ARK Innovation ETF (ARKK):
1-year: +24.2%
5-years: +1.97%
Since Inception: +11.35%
(As of March 28, 2024)
Performance data shown reflects past performance and is no guarantee of future performance. The information provided is not meant to predict or project the performance of a specific investment or investment strategy and current performance may be lower or higher than the performance data shown. Accordingly, this information should not be relied upon when making an investment decision.
Exchange Traded Funds (“ETFs”) are subject to management fees and other expenses. Before making investment decisions, investors should carefully read information found in the prospectus or summary prospectus, if available, including investment objectives, risks, charges, and expenses. Click here to find the prospectus.
TradeStation has, for decades, advanced the trading industry, providing access to stocks, options and futures. See our Overview for more.
Past performance, whether actual or indicated by historical tests of strategies, is no guarantee of future performance or success. There is a possibility that you may sustain a loss equal to or greater than your entire investment regardless of which asset class you trade (equities, options or futures); therefore, you should not invest or risk money that you cannot afford to lose. Online trading is not suitable for all investors. View the document titled Characteristics and Risks of Standardized Options at www.TradeStation.com . Before trading any asset class, customers must read the relevant risk disclosure statements on www.TradeStation.com . System access and trade placement and execution may be delayed or fail due to market volatility and volume, quote delays, system and software errors, Internet traffic, outages and other factors.
Securities and futures trading is offered to self-directed customers by TradeStation Securities, Inc., a broker-dealer registered with the Securities and Exchange Commission and a futures commission merchant licensed with the Commodity Futures Trading Commission). TradeStation Securities is a member of the Financial Industry Regulatory Authority, the National Futures Association, and a number of exchanges.
TradeStation Securities, Inc. and TradeStation Technologies, Inc. are each wholly owned subsidiaries of TradeStation Group, Inc., both operating, and providing products and services, under the TradeStation brand and trademark. When applying for, or purchasing, accounts, subscriptions, products and services, it is important that you know which company you will be dealing with. Visit www.TradeStation.com for further important information explaining what this means.
