ETF market

$SPY range $479-$529, the path to the top (and bear market)AMEX:SPY looks to be showing signs of weakness here. Thinking that we could see the first large decline of the year into one of the support levels below $479-$495. Breaking the trend line would be the trigger.
If that happens and we do get a low, then I think we'll have one final rally to the upper resistance levels between $525-$530.
Another possibility, is we just continue upwards to the top resistance levels and then decline after. Idea of a range is you want to buy the lows (supports on chart) and sell the highs (resistances chart).
Regardless of the path we take, we're nearing a top in the market and after we hit those top levels, I expect a large decline lower (one that takes us past the prior 2022 lows).
Ultimately looking for SPY to reach the $280-300 level by the end of 2024. But let's save that analysis after we see what happens in this range.

TLT Is Coming Into Key Support Within A Corrective DeclineTreasury bond TLT has been trading lower since the start of 2024, but after an impulsive rally at the end of 2023, we believe it's just making and finishing a deep A-B-C corrective decline. It's actually now coming into key strong support zone at 61,8% - 78,6% Fibo. retracement and channel support line, from where we should be aware of bounce, recovery and continuation higher back to 2024 highs. Just keep in mind that bullish confirmation is only above channel resistance line near 92.00 region, while invalidation level remains at 82.45.

Buy when there is maximum fear or blood on the streetsBefore, investors were afraid to touch Russia market but then again, other than its ETF, many retail investors in Asia are quite unlikely to be acquainted with this ETF. Now , 2 years have passed and the war is still ongoing but few cares about the outcome and impact (if any) on the stock market.
Now, all eyes are on China, a too big country to miss anyway! We see from the weekly chart that it has reached a triple bottom formation and rebounded nicely upwards. It is still very much undervalued imo and the risk/rewards is tremendous if all things are working nicely for China.
It would not be a straight line up though we had seen very strong upward trajectory in the last 4 weeks in the HSI.
2nd half of this year, I expect more stimulus to come from the Chinese government to continue boost consumer confidence. The faster they put a floor on the property market bottom, solve the unemployment issues , the faster the consumers will return to the stock market. Retail investors are hoarding up cash in the trillions instead of spending after the recent Covid Saga plus the implosion of the property market (many many got burnt)
It will take some time so be patient ....There will be resistance along the ways but knowing the resilience of the Chinese government, I believe the bull market has return and moving forward, it will be better for everyone.
I am vested in this index so please DYODD

QQQ - Wave 5 underwayY'all gonna get rekt shorting this. Wave 5 underway. Might get another dip the next few weeks and then off to the moon. Targets based on various EW counts.

SOXL Gap Up Potential.Gap Ups can occur past a range that experienced previous consolidation in attempt to continue to challenge the next price zone.
SOXL made a strong move up to a previous zone of resistance. look for prices to jump into the $48.16 to $50.98 area marked in the purple square.
The Linear Regression + RSI indicator had a potential bottom signal without confirmation of the William Vix indicator that is showing toping potential. This can sometimes indicate a break through of a current "top".

$SPY May 16, 2024AMEX:SPY May 16, 2024
15 Minutes.
AMEX:SPY opened gap up.
Since long was confirmed as the rectangle was broken out the previous day, i waited for a good close of bar. I bought around 527.
I had earlier marked the extension for the range 515 to 522.66 to 519.74.
This gave a 1.618 target as 532.
For the day, since I always believed gaps are strong if not filled, I will take the rise from 525.18 to 530.08.
I expect today AMEX:SPY to be around 531 to 532 as top and if any retrace it will be around 527 to 528 levels.
If these number s hold today i expect 535 next week.

There is hope for China equitiesOne of the most hated market currently and some called it uninvestable, the China market has plunged more than 60% from its peak. We are now at an inflection point again, reaching the upper side of the decreasing channel.
I believe the property market will take some years to recover , with excess supplies to clear and consumers continuing to adopt a wait and see approach in buying as prices continue to fall......
Probably, 2nd to 3rd Quarter of this year , will we be able to see some recovery. Currently , it is still weak although the government has injected billions of dollars to shore up the stock market, clamping down on short sellers, etc.
Prices can continue to tumble even if it breaks out of the channel as the stimulus is not strong to begin with and consumer confidence has not returned to the market. Job market remains soft in China and people are tightening their wallet to spend unnecessarily. With no additional stimulus from the government, people are using their own savings to continue travel and do their shopping but at a more cautious approach.
So long as the US interest rates remain high at 5 over % , the international players would continue to support the US market which makes business sense.
Time is of essence as people who invest in S&P 500 index can easily gain 8-10% profits a year so there is no reason to park funds into China equities even it is undervalued and the downside is very little. Nobody can tell for sure how long this will last as it can go sideways for a long time. Those who knows how to stock pick individual China shares may benefit from certain themes which I have covered some months ago like Travel sectors.

Support and resistance lines are just a GUIDE, not a MUST !!!Just because it has landed on the support line or resistance level does not mean it must rebound or heads south. As investors, we must know that these are based on historical patterns and past history is not a representation of the current market conditions.
Thus, it is wise to take a small nibble , say 10% of your capital if you had done your homework on this ETF/stock. If it goes up as you wanted, congratulations but if it does not , you have the choice to re-enter at a much lower price and your average price is much cheaper overall.
Imagine if all stocks hit support line and rebound , becoming a sure thing , wouldn't every trader become multi-millionaire? Ask yourself, are there more online gurus, coaches, physical classes conducting how to make money from stocks, options, forex, etc than 5-10 years ago?
Capital allocation is not about guts or I dare you but rather a calculated risk management tool to protect yourself. In the market, there is no such thing as GUARANTEE. So, learn to protect yourself, your money and you will have a less rocky journey towards investment.

Don't jump in now, wait for price to drop by to the handle firstbased on weekly chart, we see a clear cup and handle pattern play out in this IHAK ETF. If you are getting hyped up to go LONG , be patient and not get on the high price train.
Wait around for the price to retrace to around 44 price level first or possibly it might drop even lower considering the bullish trend for AI, Tech stocks has been rallying for quite a while......
Be patient

KWEB: Exposure to Chinese tech marketBased on past cycle history, the SHSZ300 (Chinese S&P 500 more or less) tracks the US markets bull runs, though starting with a large delay.
We're fed a lot of bad news about China, but the fact is, they're making some economic power moves, and positioning themselves for the AI Industrial Revolution.
The Chinese markets are bottoming out, and it's a good time to get exposure to the Chinese markets.
I will be buying in around the buy zone ($45 - $41).
#China #MCHI #KWEB

SPY Weekly OutlookMany of you are confused on the recent price action of the market.
When in doubt, zoom out.
Pay attention to the next fib level and pay attention to GOLD & OIL.
Feds only cut rates during market turmoil not during bull runs.
To keep it SHORT and sweet. It doesn't end well for risk assets.
On the other hand, have you seen the prices of cocoa??? Insane!

MCHI: Buy exposure to Chinese marketsBased on past cycle history, the SHSZ300 (Chinese S&P 500 more or less) tracks the US markets bull runs, though starting with a large delay.
We're fed a lot of bad news about China, but the fact is, they're making some economic power moves, and positioning themselves for the AI Industrial Revolution.
The Chinese markets are bottoming out, and it's a good time to get exposure to the Chinese markets.
I will be buying in around the buy zone ($45 - $41).
#China #MCHI #KWEB

SPY Wave Count IdeaI've heard other pundits that the rise off the lows, the 1,2, 1, 2 was all a wave 1 and the most recent significant pullback was a wave 4. While possible, with the bullish momentum of late, seemingly we're in a wave 3 with some bullishness left in the tank.
People indicate market over-valuation but due to the narrowness of market breadth, it seems perhaps only the magnificent 7 are over-valued... there are still so many stocks that look like they're maybe going to start to participate, a look at the IWM and what appears to be a breakout of a longer-term consolidation, hints that the market may be okay for a bit. Bullish, not overly as the big boys chill a bit.
We shall see.
#SPY #waveanalysis

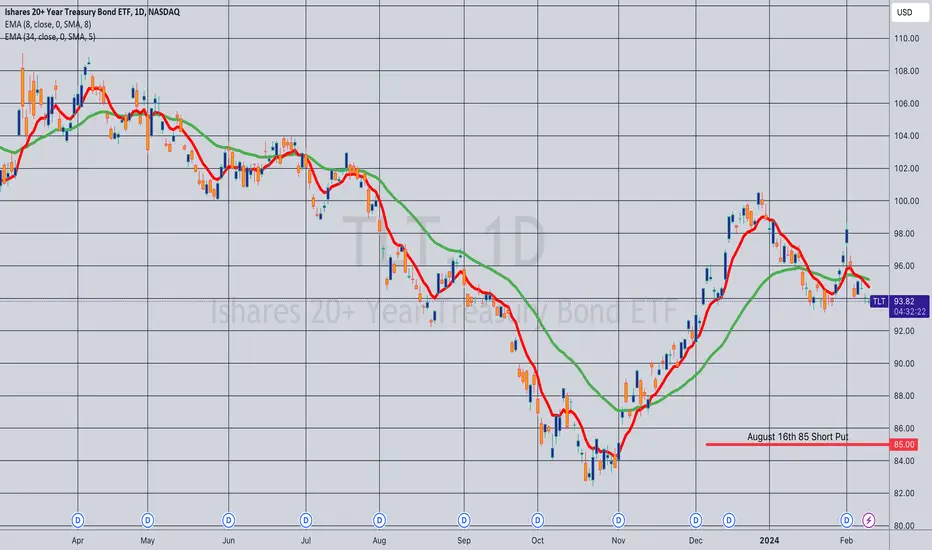
Opening (IRA): TLT August 16th 85 Short Put... for a .98 credit.
Comments: Targeting the strike paying around 1% of the strike price in credit, adding to my position at intervals, assuming I can get in at strikes better than what I currently have on.
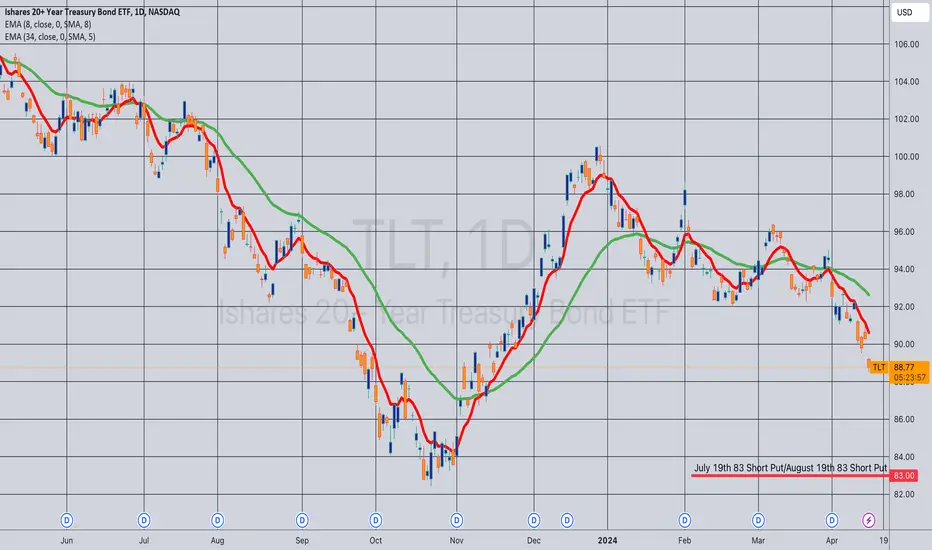
Opening (IRA): TLT July 19th 83/August 16th 83 Short PutsComments: Getting in at strikes better than what I currently have on in July and August.
July 19th 83: Filled for an .85 credit
August 16th 83: Filled for a 1.11 credit
I'm fine with potentially getting assigned with shares at 83, since they're way below the cost basis of the covered calls I currently have on. I knew this might end up being a very, very long duration trade that would potentially take time to work out, but ... yeesh, the weakness.
Will look to roll out the most at risk strikes I've got in July (at the 86) and August (at the 85) at some point ... .
SPY and the othersRSI divergence, fading volume on rising price, leave us….untrusting….neutral is our position.

SPY Bullish Breakout And A New All Time High! Buy!
Hello,Traders!
SPY is trading in a strong
Uptrend and the index
Just broke the key
Horizontal level of 525$
And the breakout is
Confirmed which reinforces
Our bullish bias and we will
Be expecting a further
Bullish move up
Buy!
Like, comment and subscribe to help us grow!
Check out other forecasts below too!

SPY: OverheatedWe've seen a wild +25% rally since Oct 2023 in SPY. Honestly, I did not expect this move back in Oct, especially since we broke down below the MAs and they acted as resistance for 3 weeks. However, the market doesn't care about what we think it will do.
I don't like calling tops, but nothing goes straight up. With the crypto market building up hype as well, I think we are reaching a stage of local euphoria. Greed is pretty high right now.
IF this is a local top, THEN I think testing the previous ATH is the most likely scenario before continuing up.
We could see it drop to anywhere between 480-470 in the next month or so. This coincides with where the 21W EMA and 20W MA are. We also saw good volume around those prices in the last couple of years. The 0.236 fib retracement level sits at 472. Lastly, the RSI has reached the red Bollinger Band and is overbought at 77.
This is not financial advice. Trade at your own risk.

XLF To RallyXLF normally moves quite slowly, but we may may be at a moment in which that accelerates substantially, even improving on what has been a phenomenal year.
Weekly -
Daily -
The EW path drawn is what may be expected most commonly - we're looking for that or better.

US Small Caps ContinuationSurprised to see IWM fairly restrained in this upward trend as long term interest rates dropped significantly on todays CPI report. Really expect to see a quick catchup over the next few days as SPY and QQQ make new highs.

QQQ Potential Paths Moving ForwardQQQ made a new ATH today and may close even higher. I think it will run up until it retests its ascending channel from earlier in the year.

Long SQQQ 9.95Target 12
As you can see, SQQQ RSI (9) never has been so low in this time frame ....8
Market is ultraoverbought and I expect a huge reversal.
Regards,
