NaturalGas ABC correctionReject from first line of suport or from second line of support. If price go above and take this zone like support than we can see target like 3.3 or 3.6 in a few candels
Futures market

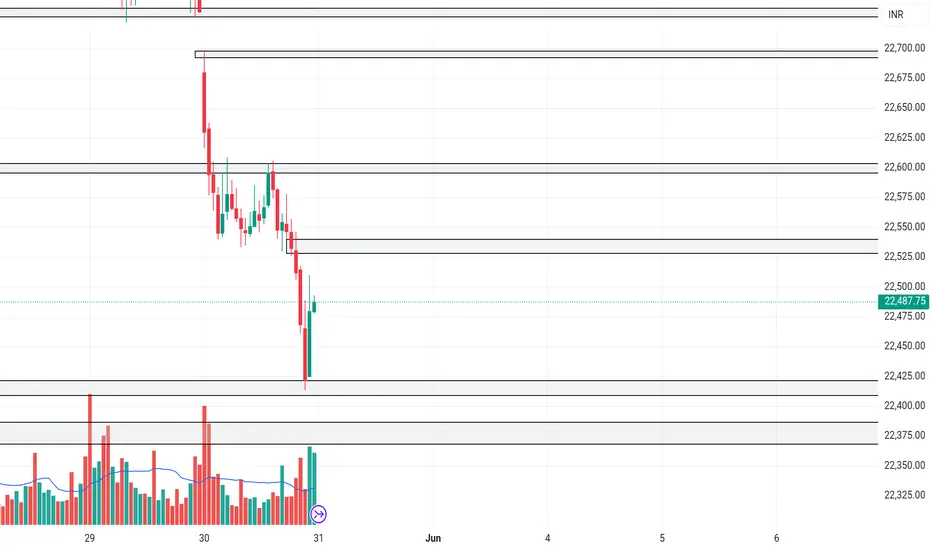
NIFTYNIFTY closed below va
1. gapup 22550 long till 22600-22700
2. 22550-22350 trade reversal
3.gapdown 22350 short
Summer SebaticalI'm excited to share that I'll be taking a summer sabbatical to recharge. As a result, the newsletter will be on a brief hiatus. But don't worry, I'll be back in September, refreshed and ready to dive back into the markets with you.
Wishing you a profitable summer!

Idea for Gold @ 30th May 2024As previous analysis, we sell from the top
and add multiple positions, let's wait for wave A of sub-wave 5 completed,
then catch the next bullish wave B of abc correction
This wave A we've catched around 10000 pips from the top to current price with multiple positions, you can check my previous free analysis
This analysis is my current insight!

Gold Price Analysis: Factors and Forecast 🟡Gold Shows Signs of Recovery Despite Stronger USD
Gold prices have shown some recovery on Friday, despite the strength of the US Dollar (USD). However, the upside potential for the yellow metal might be constrained by diminishing expectations of a rate cut by the US Federal Reserve (Fed) in September. Nonetheless, safe-haven flows due to rising geopolitical tensions in the Middle East could provide support to gold prices.
Key Factors Influencing Gold Prices
Federal Reserve's Influence: Gold investors will closely monitor comments from Federal Reserve officials, with Fed's Waller set to speak on Friday. Hawkish remarks from Fed policymakers could further weigh on gold prices. It is important to note that higher interest rates generally exert downward pressure on gold prices by increasing the opportunity cost of holding the non-yielding metal.
US Economic Data: Investors will also look to upcoming US economic indicators, including the Durable Goods Orders and the Michigan Consumer Sentiment Index. These data points can provide further insights into the economic outlook and influence gold price movements.
Technical Analysis: Footprint and RSI Insights
A footprint analysis indicates a potential recovery in gold value as the price resides in a discount area, accompanied by divergence on the H4 RSI. This divergence suggests that selling pressure might be waning, increasing the likelihood of a price rebound. Additionally, the imbalance observed in the footprint analysis supports the expectation of a recovery in gold prices.
Outlook
While the strong USD and hawkish Fed stance may limit gold's upside, geopolitical tensions and technical indicators suggest potential support for a price rebound. Investors should watch Fed commentary and economic data releases closely, as these will provide further direction for gold prices.
Daily Footprint Analysis:

Gold Shorts - Time to think outside the boxGold has experienced significant volatility over the past month due to escalating tensions in the Middle East and fluctuating US economic data. Here's my analysis of the current situation and potential future movements for Gold.
News and Economic Data:
May 30, 2024:
Preliminary GDP q/q: A measure of the annualised change in the inflation-adjusted value of all goods and services produced by the economy. Higher-than-expected GDP growth can strengthen the USD.
Unemployment Claims: The number of individuals who filed for unemployment insurance for the first time. A lower number suggests a stronger labor market, potentially boosting the USD.
Pending Home Sales m/m: Measures the change in the number of homes under contract to be sold but still awaiting the closing transaction. Strong data can support the USD.
FOMC Meeting: Statements and interest rate decisions from the Federal Open Market Committee can significantly impact the USD.
May 31, 2024:
Core PCE Price Index m/m: A major inflation indicator for the USD. Higher-than-expected inflation can lead to increased expectations of interest rate hikes, strengthening the USD.
Tensions in the Middle East:
"Israel expects the Gaza war to last seven more months" - Source: Financial Times (29/05/24)
There is an uncertain risk that the current situation may escalate to a wider Middle East conflict. Therefore, many market participants will seek "safe haven" investments such as Gold as a strategy to hedge against the dollar in preparation for a dooms day event. Based on this, bullish pressure remains on Gold for the foreseeable future. However, we can expect short term retracements based on News and Economic data.
Technical Analysis:
Price is currently in between the range 2325.00 and 2364.00. If we can see price break and stabilise below 2325, this will give us opportunities for short entries down to 2280. Additionally, the DXY is resuming its uptrend by making higher highs and higher lows.
My current trade:
I currently have a short trade running from 2357. I will be adding to my positions after news and economic data is released tomorrow and on Friday. (Assuming that news data is in favour of the US Dollar)
Good luck guys!

In Platinum, Triangle formed. 1st Target 1882, 2nd Target 2763.Triangle Pattern formed in Platinum Future, wait for the Breakout. Because Breakout is the Confirmation market move to the Bullish Trend. And 1st Target price is 1882, 2nd Target price 2763.
This is for Long Term Analysis.
I want to help people to Make Profit all over the World.

GOLD Intraday Long IdeaWe are going to hit the golden fibonacci area and after that hit the 1 fibonacci zone.
Good Luck

Gold-short sell ideaGold is making a bearish head and shoulder pattern,indicating potential sell off position.More over,todays Un employement claims are expecting to be positive for USD as inflation cools down and consumer confidence increasing,therefore having potential positive impact on DXY.
What's ur take guyz..?

Xauusd-1HXAUUSD long position
stop:2330
Target:2355
After breaking the channel and making pull back, the trend is upward

nifty ict analysis ICT Concept Analysis for Nifty 50
We had seen the accumulation (consolidation) phase early in the nifty, then we saw a manipulation phase in the nifty, looking forward we might see a distribution phase in nifty based on ICT Concept.

Gold Analysis 29/05/24If the unemployment claims data on Thursday comes in higher than expected, indicating more people are filing for unemployment, it might suggest a weakening job market. This could lead the Federal Reserve to consider pausing rate hikes or even lowering rates to support the economy.
On the other hand, if the claims are lower than expected, showing a strong job market, the Fed might feel more confident in raising rates to combat inflation. They tend to balance between controlling inflation and supporting employment.
The latest from the Federal Open Market Committee (FOMC) indicates that they're closely monitoring inflation and economic growth. As of their most recent meeting, they have signaled a cautious approach, suggesting they might pause further rate hikes to assess the impact of previous increases.
However, they haven't ruled out future hikes if inflation remains high. The timing of any rate changes would depend on upcoming economic data, particularly inflation and employment reports. So, the possibility of a rate adjustment could come as early as their next meeting if conditions warrant it.
Elliot waves : We're not at the wave 4 ( correction ) , i believe we still have another push down for gold , but i think we still have time to push more up b4 the drop for new LL , the confirmation for this is thursday when they release the unemployment claims data

current price range of 2353/2356Consider selling XAUUSD at the current price range of 2353/2355. Potential entry points could be established within this range. Aim for three take-profit levels: 2350, 2345, and 2342, respectively. In case the trade moves against expectations, it's advisable to close it at 2360 to mitigate potential losses. This strategy ensures a structured approach to trading XAUUSD, maximizing potential gains while minimizing risks.

XAU / USD 30 Minute ChartHello traders. We have news in an hour here in the US so I will probably wait to take a trade. I have marked my area of interest for the current 30 min chart. Looking to see if the current 30 min. candle stays above and does not break below the previous one. If we do form support and it holds at the 2333.43 area, then we may see some more upside. I am patiently waiting for a good entry. NY open is in 2 hours. Be well and trade the trend. Big G gets all my thanks. Let's see how things play out.

Gold Scalping IdeasThe current market offers good set ups for short trades in the support zone around 2330 and the resistance near 2348-2350. Although the overall trend on the 5-minute chart appears bearish, the recent price action suggests a potential short-term reversal. Scalpers can benefit from these quick trend changes, making short trades during downtrends and quick long trades during upswings.

GOLD NEXT MOVE TO 2390GOLD NEXT STOP TO 22390
ITS STRUSTURE SHIFTED AND RESPECTED OB and now its journey is upto where its bear breaking was started
also on 1D it respected OB

Trust me, this analysis will help you!XAUUSD CHART UPDATE (GOLD): I expected gold to form an "M" PATTERN which it has continue to form. i currently expect price to drop to the completion of the leg or the final leg of the "M" pattern, after which i will also be expecting price to move up to the neckline @ 2,288 before the bullish continuation to 2,443.97 which is our all time high.🔥

Gold next week analysis and trading advice!On Friday (May 31) in the United States trading hours, after the United States April core PCE indicator showed a slowdown in inflation, gold prices once touched the $2,360 mark and then rose and fell. It's currently trading at $2,330, and swap traders are still betting the Fed will cut rates at least once this year. Data from the Chicago Mercantile Exchange's FedWatch tool suggest there is little chance the Fed will cut rates before September, with a 50/50 chance of a rate cut in September. Friday's US personal consumption expenditure (PCE) data for April could further influence interest rate expectations and thus gold prices. The PCE is the Fed's preferred inflation measure, so it tends to carry more weight. Although as several analysts pointed out, the release of the data was fairly predictable, as it came on the heels of the CPI and PPI releases in the same month. Still, small deviations from expectations can produce volatility.
Gold is about to break the box shock, is about to open a big unilateral downward trend. The shock is the worst, but it will be over soon, and we will have spring. At this time, rebound high altitude such as the break is the best choice, my point of view is to rely on the 4 hours of the medium track on the gold price of the trend short, is expected to rebound 2340 short. This wave of rebound can not touch the daily line of the middle track, touch a straight fall, the pressure is really great, even breaking the support below, even the 2340 support level that does not move during the day has fallen below, and now it has become a good position to block bears. In summary, next week's gold short-term operation ideas suggest that the callback is mainly based on the above short-term focus on 2340-2343 resistance, below the short-term focus on 2318-2320 support,
Next week Gold recommendation: Step back near 2318-2320 long stop loss 2313 target 2345

USOIL Will Go Up From Support! Long!
Take a look at our analysis for USOIL.
Time Frame: 12h
Current Trend: Bullish
Sentiment: Oversold (based on 7-period RSI)
Forecast: Bullish
The market is approaching a key horizontal level 77.11.
Considering the today's price action, probabilities will be high to see a movement to 79.91.
P.S
We determine oversold/overbought condition with RSI indicator.
When it drops below 30 - the market is considered to be oversold.
When it bounces above 70 - the market is considered to be overbought.
Like and subscribe and comment my ideas if you enjoy them!


Plans GOLD for the first week of JuneThis week gold will revolve around 2 price zones 2360 - 2300
SELL zone 2360 - 2362 SL 50pips TP 100-200-300pips
BUY zone 2305 - 2032 SL 50pips TP 100-200-300pips


USOIL: Bullish Forecast & Outlook
Remember that we can not, and should not impose our will on the market but rather listen to its whims and make profit by following it. And thus shall be done today on the USOIL pair which is likely to be pushed up by the bulls so we will buy!
❤️ Please, support our work with like & comment! ❤️
