Read the chartnot much to say ive been posting prior... we in a ut simple we in the top aka everasla...
Futures market

Todays position on goldWhat a beautiful move from our golden area to our target
We buy gold from lowest level and golden area
With almost 150 pips profit

Yesterdays position on goldWe trade yesterday and forgot to share with you my friends
Gold had huge down trend and we sell it to made almost 150 pips ...

Yesterdays position on goldWe trade yesterday and forgot to share with you my friends
Gold had huge down trend and we sell it to made almost 150 pips ...

My opinion on the gold trend. I am happy to share your opinion wAlanaysis
In this section, we have the trend of the future few weeks of gold, which we can use for floating trades and ride the waves. Hoping for good days for all the people of the earth

XAUUSD Analysis (31st May 2024)
XAUUSD Analysis(15M TF)
Price Rejected 4 hour Bullish FVG at the 2340.98 level.
BUY/SELL SCENARIOS:
🟢BUYS: Price Rejects the 2341.43 level and creates a 5 minute CHOCH to continue higher, targeting 2356 level.
🔴SELLS: Price Dumps below the 2340.02 level with a body candle close. If this happens, Bearish CHOCH forms, indicating selling Pressure > Buying Pressure. Look to target 2327 level.

GolD Expected MoveGold expected next technically move. wait for the levels and confirmations. Gold have expected target of 2380

SELAHI knew this low would be taken because prices true objective was macro equal lows to the left. Simple continuation. Praise God!

$gold- end of the rainbow is nearready for $2600 as we flip our ath
should get a retest but since am bearish on the dixie recon we keep going from here and the fun has not even started for peter schiff
flip side dixie may deviate above range for now so pullbacks are for buying

Crude Steps and Forces- all rectangles are potential support/resistance with the last one blue being a probable exception
- the 3 marked with dots levels can also become support/resistance, especially the first bottom blueish one, but they can also become like milestones levels or steps in the evolution of the price
- the 2 green curves are also potential support/resistance acting as forces pushing the price up or down
This snapshot considers the bullish scenario where the price remains above 66, with potential reversal patterns to occur near the red rectangle zone.

Gold trade analysis
On May 30, the price of gold (2353.87, -10.23, -0.43%) fell nearly 1% on Wednesday to close at $2,337.88 per ounce. The U.S. dollar strengthened to a two-week high, U.S. Treasury bond yields rose to a four-week high and hawkish statements from Federal Reserve officials dampen market sentiment. Market focus turns to the release of U.S. inflation data later this week. The U.S. dollar index rose 0.49% on Wednesday, hitting an intraday high of 105.19, a new high since May 14, making gold more expensive for investors holding other currencies. The market is watching the U.S. core personal expenditures (PCE) price index report due out on Friday for more clues on the timing and scale of interest rate cuts. PCE is the Fed's favored inflation measure.
In the short term, the rebound in gold prices has ended. H4 has once again entered a short-selling and heavy-volume trend, and fell in the early morning. Then the high in the early morning will be the dividing line between strength and weakness during the day, that is, if 2344 is not broken, the gold price will be extremely weak. If it breaks above, just watch the shock. , the Asian market opened directly down in the morning, there is no need to chase, everyone can wait for 2337-39 to go short, add positions to 2344, defend 2349, and look at 2325-20. The focus is still on the strength of the European market. If the European market is strong, the U.S. market will rise first and then fall. If the European market is weak, just continue to be short after the rebound before the U.S. market.

gold will buy shorttermwe have completed our previous plans .also gold did a huge bullish price action that we can able to buy.we have to see the reaction around level 2344 which is having a critical volume range then we buy once we see a reaction on that range .otherwise let is crawl down and lowe level buy it
Do not change the plan
stick with your rules
Apply risk.
do not think about the outcome ..love the process that is what professionals do

XAUUSDconfirmation for a breakout for bullish movement. A minor retracement then a possibility of a bullish movement.


OIL (WTI) - 4H Three PushThe WTI Oil 4H chart displays a classic bullish reversal pattern, often referred to as the "three pushes" or "three drives" pattern. This pattern is characterized by three distinct attempts by the market to push lower, each attempt being met with increasing buying interest. The current setup shows that after three downward pushes, the price has started to rebound, indicating a potential shift in momentum from bearish to bullish.
The price action has recently broken above the upper boundary of the descending wedge, which suggests a weakening bearish trend and the possibility of a new bullish phase. The target for this bullish movement could be around the $84 level, where previous resistance lies. Traders should watch for continued higher highs and higher lows to confirm the upward trajectory, and consider long positions as the price action aligns with this bullish reversal signal.

XAUUSD REGULAR FLATKindly remember, Elliott Wave is highly subjective, i will post if there's a new update on my perspective.
Trade safe, Everyone!
Cheers.

Double Bottom Pattern forming on 4hrBeware sellers, we can notice double bottom pattern forming on 4 hr and gold hasnt broken 200hr MA on 4hr as well, so target will be the gap at 2411.

Gold price-reversal head and shoulder in 15 min TFafter reversal head and shoulder in 15 min TF
the price make HH-HL. so i decided to wait the price pull back

XAU/USD SHORT IM LOOKING TO TACKLEXAU/USD 15M - I am looking to place a short position here with this market as price has traded us recently into a higher timeframe area of Supply and has shown signs of bearishness since.
What makes me believe this is a break in the last protected low you can see on the left side of this screenshot, that is the last protected low as that low created the highest high within that last bull run.
Wha we have seen now is price trade us back up to set a new lower high before what I think will be a new lower low. Its important we find areas that price may trade up and into in order to set a new lower high and this is an area I have in mind.
My reasoning for this is because there is an order block that I have marked out that was left unmitigated, what we have seen since price has traded into that order block is good rejection.
The trade itself is slightly pre-emptive with us not waiting for another fractal break but if we get taken out I will look to get re-introduced is price trades us up and into another OB slightly higher.

BANKNIFTY BANKNIFTY closed inside va
1.gapup 49200 long till 49400
2.49200-48900 trade breakout
3. Gapdown 48900 short

Crude oil - rangebreakingBoth Brent and WTI continue to frustrate investors. Last week saw both contracts break below significant support in a move which suggested further weakness to come. But prices reversed sharply and rallied back above resistance yesterday, signalling the likelihood of a breakout through the top of a range which has been building since the beginning of this month. Yet having smashed through resistance, crude reversed direction again, pulling back from Wednesday's month-long high, and dropping back into its rough trading range. What to make of it all? As noted yesterday, this market has form when it comes to wrongfooting traders, and there’s no reason why that shouldn’t continue to be the case. The market has repeatedly shrugged off geopolitical concerns, but remains unsure of the outlook for future demand growth. In this regard, there is considerable uncertainty about the state of China’s economy, and how that will affect crude imports. At the same time, there are worries about how the US economy will perform now that the Federal Reserve has forced the market to dial back its interest rate cut expectations. Add in this weekend’s OPEC/OPEC+ meetings and volatility is perhaps the only thing traders can take to the bank.

NATGAS - Time for a pullback? There is a high possibility we are going down on the GAS
Technicals
1. We closed on a doji on the weekly
2. We have been pumping strong lately, and the charts are screaming for a pullback
3. We came to a key .618 FIB retracement level
4. I see a zone here which can act as a major resistance.
Trade
Looking for a position for a sell this week!.
Great trading all of you
& remember to always trade with caution and a plan :-)
Greetingz,
Simba Trades

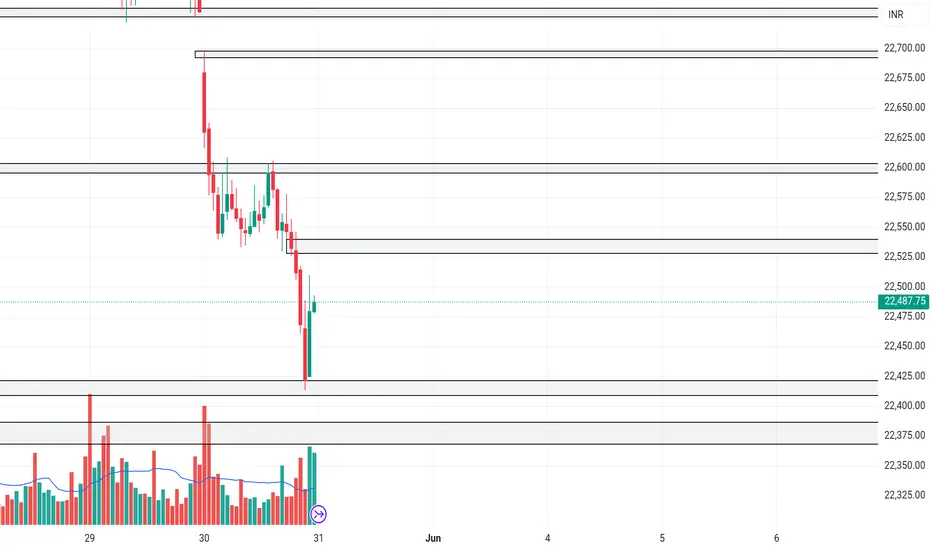
NIFTYNIFTY closed below va
1. gapup 22550 long till 22600-22700
2. 22550-22350 trade reversal
3.gapdown 22350 short