Gold Xau usd broken bullish momentum opens much deeper targets Following my successful today's trade on FOREXCOM:XAUUSD , price action overpassed the bottom of the zigzag structure.
I am expecting a limited pullback to the 2329 price area before going further south
Futures market

*Investors, Heads Up| XAUUSD Breakout Alert*📣 Traders, take note! 🚀 XAUUSD is soaring, hitting new peaks with accuracy! 💫 Check this out:
🔍 XAUUSD Analysis: 📈 Battling within the 2341 to 2348,7 range. 🤔 Will it break through?
🔻 Bearish Alert: 🔻 Watch for potential declines if it falls below this level! 🎯 Targets: 2337, 2335.
🔺 Bullish Alert: 🔺 Look for buying opportunities if it breaks above! 🎯 Targets: 2353, 2355.
💡 Join the Conversation: 💡 Share your insights as we explore this dynamic market! 🎤 Let’s reach new milestones together! 🌟🚀

NQ1! - SELL
Looking very weak
Return to Previous Level Pattern clean Support
RSI Multi Indicator all Down
Ultra Metre All Red
Quick Scalp

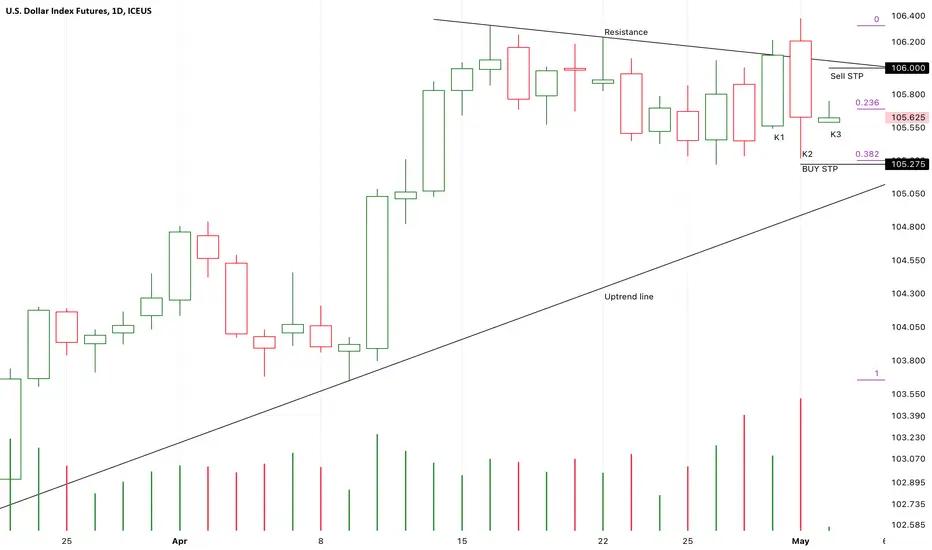
Chart Pattern Analysis Of DX1!
K1 and K2 is a strong bearish dark cloud cover pattern,
If the following candles couldn’t close below K2 to verify the strong momentum.
It will be a good place to buy here.
If the following candles close upon the resistance,
It is a second good place to buy in.
K2 is also a potential right top of a large scale bearish double top pattern.
If K3 rebound under low volume,
It will be a good place to sell it there.
Buy-105.5/Stop-105.3/-Target-110
SILVERI can see silver is up trend. Maybe it will take a week or more than that. Only for technical analysis. Note not yet fundamental analysis

ZM1! INTRADAY IDEAafter big bearish momentum last candle retracement will happen. Trading plan intraday looking for long around $363.8 and take profit about 40tick (green zone) or set break even SL. after that looking for short at zone (red box) to fullfill the imbalance/FVG candle TP at the swing low. TAYOR

long on nas100Looking for a lower high to be made noting it went down a bit Im still thinking its gonna retrace and then keep going

Read the chartnot much to say ive been posting prior... we in a ut simple we in the top aka everasla...

Todays position on goldWhat a beautiful move from our golden area to our target
We buy gold from lowest level and golden area
With almost 150 pips profit

Yesterdays position on goldWe trade yesterday and forgot to share with you my friends
Gold had huge down trend and we sell it to made almost 150 pips ...

Yesterdays position on goldWe trade yesterday and forgot to share with you my friends
Gold had huge down trend and we sell it to made almost 150 pips ...

My opinion on the gold trend. I am happy to share your opinion wAlanaysis
In this section, we have the trend of the future few weeks of gold, which we can use for floating trades and ride the waves. Hoping for good days for all the people of the earth

XAUUSD Analysis (31st May 2024)
XAUUSD Analysis(15M TF)
Price Rejected 4 hour Bullish FVG at the 2340.98 level.
BUY/SELL SCENARIOS:
🟢BUYS: Price Rejects the 2341.43 level and creates a 5 minute CHOCH to continue higher, targeting 2356 level.
🔴SELLS: Price Dumps below the 2340.02 level with a body candle close. If this happens, Bearish CHOCH forms, indicating selling Pressure > Buying Pressure. Look to target 2327 level.

GolD Expected MoveGold expected next technically move. wait for the levels and confirmations. Gold have expected target of 2380

SELAHI knew this low would be taken because prices true objective was macro equal lows to the left. Simple continuation. Praise God!

$gold- end of the rainbow is nearready for $2600 as we flip our ath
should get a retest but since am bearish on the dixie recon we keep going from here and the fun has not even started for peter schiff
flip side dixie may deviate above range for now so pullbacks are for buying

Crude Steps and Forces- all rectangles are potential support/resistance with the last one blue being a probable exception
- the 3 marked with dots levels can also become support/resistance, especially the first bottom blueish one, but they can also become like milestones levels or steps in the evolution of the price
- the 2 green curves are also potential support/resistance acting as forces pushing the price up or down
This snapshot considers the bullish scenario where the price remains above 66, with potential reversal patterns to occur near the red rectangle zone.

Gold trade analysis
On May 30, the price of gold (2353.87, -10.23, -0.43%) fell nearly 1% on Wednesday to close at $2,337.88 per ounce. The U.S. dollar strengthened to a two-week high, U.S. Treasury bond yields rose to a four-week high and hawkish statements from Federal Reserve officials dampen market sentiment. Market focus turns to the release of U.S. inflation data later this week. The U.S. dollar index rose 0.49% on Wednesday, hitting an intraday high of 105.19, a new high since May 14, making gold more expensive for investors holding other currencies. The market is watching the U.S. core personal expenditures (PCE) price index report due out on Friday for more clues on the timing and scale of interest rate cuts. PCE is the Fed's favored inflation measure.
In the short term, the rebound in gold prices has ended. H4 has once again entered a short-selling and heavy-volume trend, and fell in the early morning. Then the high in the early morning will be the dividing line between strength and weakness during the day, that is, if 2344 is not broken, the gold price will be extremely weak. If it breaks above, just watch the shock. , the Asian market opened directly down in the morning, there is no need to chase, everyone can wait for 2337-39 to go short, add positions to 2344, defend 2349, and look at 2325-20. The focus is still on the strength of the European market. If the European market is strong, the U.S. market will rise first and then fall. If the European market is weak, just continue to be short after the rebound before the U.S. market.

gold will buy shorttermwe have completed our previous plans .also gold did a huge bullish price action that we can able to buy.we have to see the reaction around level 2344 which is having a critical volume range then we buy once we see a reaction on that range .otherwise let is crawl down and lowe level buy it
Do not change the plan
stick with your rules
Apply risk.
do not think about the outcome ..love the process that is what professionals do


BANKNIFTY BANKNIFTY closed inside va
1.gapup 49200 long till 49400
2.49200-48900 trade breakout
3. Gapdown 48900 short

Crude oil - rangebreakingBoth Brent and WTI continue to frustrate investors. Last week saw both contracts break below significant support in a move which suggested further weakness to come. But prices reversed sharply and rallied back above resistance yesterday, signalling the likelihood of a breakout through the top of a range which has been building since the beginning of this month. Yet having smashed through resistance, crude reversed direction again, pulling back from Wednesday's month-long high, and dropping back into its rough trading range. What to make of it all? As noted yesterday, this market has form when it comes to wrongfooting traders, and there’s no reason why that shouldn’t continue to be the case. The market has repeatedly shrugged off geopolitical concerns, but remains unsure of the outlook for future demand growth. In this regard, there is considerable uncertainty about the state of China’s economy, and how that will affect crude imports. At the same time, there are worries about how the US economy will perform now that the Federal Reserve has forced the market to dial back its interest rate cut expectations. Add in this weekend’s OPEC/OPEC+ meetings and volatility is perhaps the only thing traders can take to the bank.

2024 : XAMD PROFILE?There has not been any drastic movement from April until today.
The possibility of this phase is Accumulation. if this phase is accumulation. this means that the next phase is Manipulation followed by Distribution.
However, any movement will change according to price conditions
This is just an analysis. All risks are your own responsibility
