Futures market

Plans GOLD for the first week of JuneThis week gold will revolve around 2 price zones 2360 - 2300
SELL zone 2360 - 2362 SL 50pips TP 100-200-300pips
BUY zone 2305 - 2032 SL 50pips TP 100-200-300pips

USOIL: Bullish Forecast & Outlook
Remember that we can not, and should not impose our will on the market but rather listen to its whims and make profit by following it. And thus shall be done today on the USOIL pair which is likely to be pushed up by the bulls so we will buy!
❤️ Please, support our work with like & comment! ❤️

GOLD: Will Start Growing! Here is Why:
Balance of buyers and sellers on the GOLD pair, that is best felt when all the timeframes are analyzed properly is shifting in favor of the buyers, therefore is it only natural that we go long on the pair.
❤️ Please, support our work with like & comment! ❤️

Gold SilverNew Week - New 2 Week - New Month Range...
If the 180-90-45 doesn't give you a good answer one of the other 3 will

USOIL BEST PLACE TO BUY FROM|LONG
Hello,Friends!
Bullish trend on USOIL, defined by the green colour of the last week candle combined with the fact the pair is oversold based on the BB lower band proximity, makes me expect a bullish rebound from the support line below and a retest of the local target above at 78.53.
✅LIKE AND COMMENT MY IDEAS✅

NQ1 & SP1 W BLACKSWANNNNNN!!!!!!! GG USA & DOLARCME_MINI:ES1! TVC:DXY CME_MINI:NQ1!
This is my own opinion, for better or worse. God knows. From what I see, Nasdaq and S&P 500 are facing a very serious collapse. Keep this in mind if you want to open a big short position. You can see an example of a black swan pattern and my concept intersecting on the chart. If you ask me, the problem is significant, and the end of the dollar has come maybe ww3.

XAGUSD. Weekly trading levels 3 - 7.06.2024During the week you can trade from these price levels. Finding the entry point into a transaction and its support is up to you, depending on your trading style and the development of the situation. Zones show preferred price ranges WHERE to look for an entry point into a trade.
If you expect any medium-term price movements, then most likely they will start from one of the zones.
Levels are valid for a week, the date is in the title. Next week I will adjust the levels based on new data and publish a new post.
! Please note that brokers have a difference in quotes, take this into account when trading.
The history of level development can be seen in my previous posts. They cannot be edited or deleted. Everything is fair. :)
----------------------------------------------
I don’t play guess the direction (that’s why there are no directional arrows), but zones (levels) are used for trading. We wait for the zone to approach, watch the reaction, and enter the trade.
Levels are drawn based on volumes and data from the CME. They are used as areas of interest for trading. Traded as classic support/resistance levels. We see the reaction to the rebound, we trade the rebound. We see a breakout and continue to trade on a rollback to the level. The worst option is if we revolve around the zone in a flat.
Do not reverse the market at every level; if there is a trend movement, consider it as an opportunity to continue the movement. Until the price has drawn a reversal pattern.
Don't forget to like Rocket and Subscribe!!! Feedback is very important to me!

Gold 1-hour wave count updated: tracking green corrective wave f1-hour gold wave count: The rebound conditions were not met last night, insufficient energy, yesterday's daily chart closed with a shadow upper wick, the weekly chart with a small bearish candle, high probability of continued decline next week. Currently, it seems that the blue B wave rebound has ended at 2364, and the blue C wave decline is in progress. Keep an eye on whether it will be a 3-wave or 5-wave decline, to be continued next week. Always focus on the Fibonacci 0.382-0.5-0.618 correction levels of the green fourth wave. There will be an ending day, patiently waiting for the start of the green fifth wave.

GOLD SHORT POSITION SETUPFORTUNE'S OF BETLORD🤑
GOLD ANALYSIS✨✨✨
Final Sell before the next big uptrend again.
Cheers,
betlord.

CL - 8 Hrly - Weekly Forecast - 03 June 2024This is my weekly forecast of Oil for the week of 03 June 2024
We have closed below a key support level on the Monthly, so I now see this as bearish.
Looking to short at the daily inefficiency (FVG) for targets below liquidity lows.

Elliott Wave Rare Expanding Diagonal potentialwhen a diagonal pattern forms our structure changes to 3-3-3-3-3 instead of 5-3-5-3-5.
Im counting ABC zig zag formations in the first 3 waves which leads me to believe an ending diagonal pattern is taking place.
Im seeing wave 3 completed at 2432 area and because our trend line from wave 1 to 3 is expanding this gives us an indication of a deep wave 4 correction to expand the bottom trend line. In an expanding diagonal wave 4 must be bigger than wave 2
after Wave 4 we will have wave 5 that will break the highs of wave 3 and hit our upper trend line
After Wave 5 lookout for the crash where we could go as low as 1600 as after and ending diagonal price usually goes back to where the patten started.
This is long term analysis taking place over the next 6-12 months.
This is purely technical analysis not taking any war or interest rate decisions into account we are merely following the waves of the market

XAUUSD (Gold) - Weekly Forecast - 03 June 2024This is my weekly forecast of Gold for the week of 03 June 2024.
We are still in a sell program, so i forecast lower lows to come.
I'm looking to short next week for targets down near 2260

Great entry for gold next weekLooks like the gold will be going down for A very nice entry on here wish you a good money back from this trade

1/3 ADR + OHLC -D Manipulationbeautiful reaction of1/3 ADR + OHLC -D Manipulation with beautiful SMT at highs, entry is refined on lower timeframes.
These points are very good to monitor setups from them like this.
good target could be opposing ADR or Open of OHLC like today.

This golden analysis will help you make money.Gaza ceasefire talks broke down, Israel advanced into northern Gaza and stormed Rafah without making any progress. U.S. CPI data in April fell short of expectations, April retail sales data fell short of expectations, U.S. inflation has gradually cooled over time, and weak retail sales data have boosted the possibility of the Federal Reserve cutting interest rates this year. Fed officials remain cautious about cutting interest rates. Williams said he has not seen any signs that there is now reason to change the stance of monetary policy and does not expect there will be a reason to cut interest rates in the short term; Barkin said inflation is falling toward the 2% target. More time is needed; Mester said inflation progress this year has been disappointing.
On the daily chart, gold continues to rise after stabilizing the middle track of the Bollinger Bands, and currently encounters resistance at the upper track of the Bollinger Bands. For pressure above gold, you can focus on the daily Bollinger Band upper track of $2,387, which is also the current intraday high, followed by a one-month high of $2,397; for support below, you can focus on Thursday's low of $2,370, followed by the weekly MA5 moving average of $2,354. The 5-day and 10-day moving averages are golden crosses upward, the KDJ and RSI indicators are oscillating upward, and the MACD indicator is slightly golden cross, indicating that the technical side is relatively dominant.
In terms of operation, it is recommended to treat it with a shock idea. The support below will focus on $2,370, followed by $2,354. The pressure above will focus on $2,387, followed by $2,397.

Golden range profit signalGold hit the bottom and recovered to close as expected on Wednesday. The price of gold retraced its lowest support of 2351.7 and started to rise. It closed at 2385 in late trading, with a daily increase of 1.18%. It is a strong closing pattern, which also laid the foundation for
Technically, after the daily closing of the Yang line, the gold price rushed towards the 2400 mark to test the resistance. Although there was no direct breakthrough in early trading, and the market has briefly entered the correction stage after the short-term retracement, we are still optimistic about the market breakthrough later.
In the short term, we can only look at the conversion support of the previous high of 2378. If 2378 does not break, the market will stabilize and rise again. The best choice for intraday operations is to follow the trend with long orders.

Will gold continue to rise?Short-term gold continues to rise. Gold is still maintaining a strong and volatile trend along the short-term moving average on the daily trend. The price fell back after touching the early pressure zone, but the continuation was not very good and it continued to pull as expected. , but we need to see how the daily line closes today. Judging from the current trend, there may be room for continued growth on the daily trend. If it closes above 2378 in one hour, it will further hit 2400, or even the previous high! Therefore, radicals can choose to go long in light positions at 2375! On the whole, today's gold short-term operation thinking is Xu Xin's suggestion to focus on longs on callbacks, supplemented by shorts on rebounds. The top short-term focus will be on the 2395-2400 first-line resistance, and the bottom short-term focus will be on the 2372-2370 first-line support.

GOLD (XAUUSD) Intraday Short Trade Idea Both path ways are possible to move between the support and resistance area.
In case of breaking any level we can set our postion close

volume spread analysis on JPY indexCME 6J Japanese Yen index is down very significantly for long time
Bank of Japan tell public to day that BOJ already do intervention to protect JPY not to make it drop more than this
Now based on VSA trading analysis
there are 1H candle stick show extremely high volume with small candle body
this can be interpreted that some big player absorbed the selling pressure using limit buy order
so open long position here have some edge from both BOJ intervention news + VSA analysis

Usoil sellWhooo
Same side sell position yesterday 70 pips move
Today 150 pips moved ... perfect analysis perfect entry's 🥰 all the time

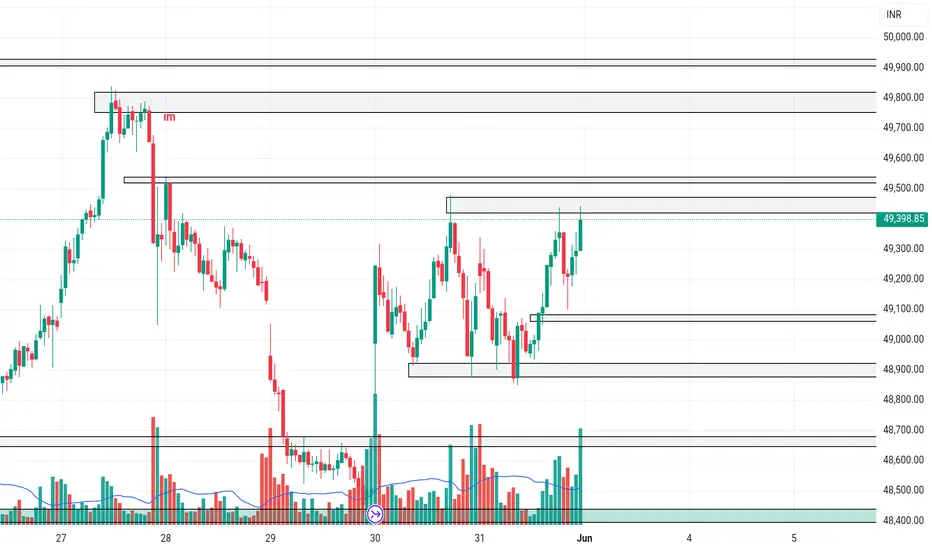
BANKNIFTYBANKNIFTY closed above va
1. gapup 49550 long till 49800
2. 49550-49100 trade reversal
3. gapdown 49100 short
NQ - trading session no.154:00pm - 5:00pm
learned some stuff today but overall it was a good session
- dont only have a bullish bias - it can still go down you dipsh!t
- just because its a small candle/ small SL it doesnt mean its a bad trade
PnL: -1 RR (its a part of the game)
