USOILRSI indicates Bullish Divergence. Which means that at any time the market trend can change to HH and HL.
Order type : buy stop
Entry : 78.82
SL : 77.38
TP1 : 78.82
TP2 : open
Futures market

Gold analysis What a year it has been with the main scenario turning around inflation and interest rate cut expectations across the world; To that, we can add the multiple conflicts around the world effecting trade and business. With that being said and with the 2nd quarter coming to an end in the next 30 days, The big picture is taking form and I believe we will soon have some great buying opportunities in Gold. Fundamentally, I am biased on a no interest rate cut this year 2024 therefore we will observe a stronger dollar. This will present good prices to get into gold and by that time in 2025 we will potentially already have some cuts which will support a gold move higher after locking in some long entries.
On a technical basis, I've been following the price action and it has been moving accordingly to all the levels identified. Therefore, I am continuing to follow the price to lock in some longs.

XAGUSD SELL Could this be a possible selling zone for Silver?
The RSI is showing that the market has reached maximum buying area.
The 4HR is also showing a reversal chart pattern at the current zone, we could possibly see selling pressure coming in.
Let's see how this will play out

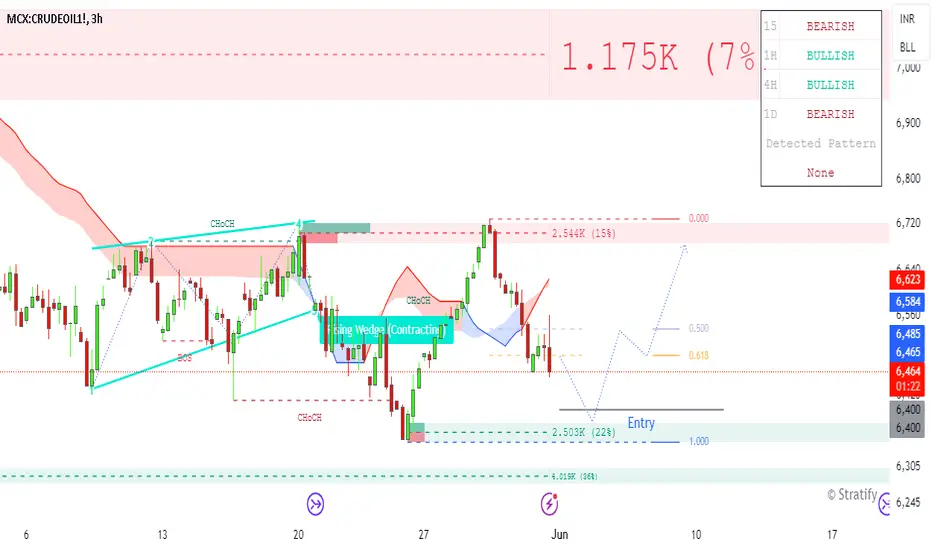
CRUDEOIL Buy Setup 3 hrs TGT with in a 3 daysSuper valid-looking! Leave a comment if you like my entry setup. This share is for educational learning purposes only, and I am not responsible for your profit or loss. Note: For more details, check the chart."
GOLD - Not the time for long yet05.03.2024 - Gold printed a very mild DCL on day 57.
Today is day 20 in the new daily cycle . Though this daily cycle run to new all time highs price was not able to stay above 2433$...
It seems we are forming a double top and the double top's neckline is pulling down the price like the magnet at the prevoius DCL ( 2277$)
After the 2 -day-drop this week we printed a bear flag what broke down yesterday. Buyers are trying to buy every dip but the bounces are not holding for too long just like today.
First we are going to tag the trendline and the 50 EMA at 2310 and when this breaks it will trigger a very fast move to the neckline at 2277$.
Notice how RSI dropped to oversold levels on day 11-12... If this happens early in a daily cycle is not a good sign : it predicts further decline.
We have around 20-30 days from today to complete this daily cycle and the 2 possible targets are :
1. 2200-2150 $ ( 03.08-03.25 consolidation)
2. a backtest of the breakout at 2080-2083$.
Don't forget if it's an ICL the 5-6 day RSI will get oversold and stay oversold for days....

Silver International : Entering Buy Zone . Silver 60 Min chart is in Downtrend at 80 Degree slope (Sign of Reversal at Support zone)
Entering Buy Zone .
Waiting for Price Pattern to Change HH-HL
and candlestick Green.

XAUUSD (Toward 2327!!!) or yet... Technical Analysis of Gold
The price remains stabilized in the bearish area, as indicated by the closing of the 4-hour candle below the support line. The price is expected to move between 2348 and 2327. As long as it trades below 2347, a drop to 2327 is anticipated.
The bullish scenario will be activated if the price stabilizes above 2348, targeting 2364 and 2369.
Pivot Price: 2344
Resistance Levels: 2354, 2369, 2388
Support Levels: 2327, 2318, 2304
Today's anticipated trading range is between the support level at 2302 and the resistance level at 2355.
previous idea:

Natural Gass CompassIn this one I use my preferred charting tool that uses data points from the past: Curved Trendlines. While there are other variations of such lines that I might use depending on the context, in this case the pattern low-high-high or high-low-low is widely detected as relevant and used as such for mapping out potential forces and support/resistance zones.
As you can see there is a relevant potential support zone validated by both the white curve and the blue curve which overlap further in time. There will be no surprises if the these levels keep holding the price for a while.
The yellow one is the weakest one in my opinion, because of the peculiar case on natural gas that doesn't provide much options for such support/resistance lines, because of the X high that was created in a strong but weird position relative to past highs and lows. Meaning that if the yellow is broken on the up, it might not even matter in the future because a different setup might unfold, creating a totally different type of line in any type of pattern regarding previous highs and lows.
What I like about these lines is that the relevant ones tend to provide clear cut cases of rebounds (example in the white dot), retests after break (green dot), or even pure power breaks with no comebacks (yellow dot).
The scenarios I find important in this picture are the following:
- the obvious potential rebound from the white and blue
- the less obvious but very important break on the downside of the white and blue which has a higher chance of a retest because of the significance of these lines (these retests tend to happen for these long lasting lines with many data points)
- supposing the yellow line does hold, or if another similar resistance line appears after another high lower than X, and supposing the white is finally penetrated, we enter the C zone which I believe has a decent probability for action inside it.
I find the B zone less likely to be relevant as it implies the breaking of the white which should lead to a more bearish or consolidation mood rather that another power bullish move.
I decided to post this snapshot here with these lines because as you can see the price has provided decent relevant lines in the recent past with the greens and blue, while in the current present case, these lines are almost non existent because of the position of the X high relative to the previous highs and lows.
My guess is that a careful analysis of the reaction of the market to these lines could give us clues of what the sentiment in the market is, shifting from the bullish mood to a more cautious neutral or indecision mood with the break of the white and blue.

XAUUSD (GOLD), downward trend after bull accumulate.Hi friend. Lets look at gold chart window. We have more then 2k of bulls accumulate. So my opinion price will fall to 2328 secondly. Thanks for your support.

XAUUSD SHORTThis is just simple trading idea draw into chart using labels and lines. Please use it as educational purpose and you are free to modify any

GOLD - there is single area, hold or not?#GOLD.. so guys market very well hold so far your yesterday resistance area now as supporting area.
keep close it that is 2340 it will be your key level now. if market hold it then further bounce expected above that level. only only short below that otherwise not.
keep in mind guys below 2340 cut n reverse keep in hand.
good luck
trade wisely

Update the latest gold price todayDear traders! Today's world gold price is listed on Kitco at 2,344 USD/ounce, up 7 USD/ounce compared to early yesterday morning.
Accordingly, recently, traders' views have increasingly favored the scenario in which the Fed will keep interest rates higher for longer, increasing the opportunity cost of holding the yellow metal and creating Strong resistance level in price.
In terms of the prospect of precious metals' upward momentum still remaining, it is forecasted that the price will reach 2,400 USD/ounce in the near future and increase to 2,500 USD/ounce in September, reaching 2,600 USD/ounce by the end of this year and increase to 2,700 USD/ounce in June 2025.
However, if the PCE index rises higher than expected, it could cause gold prices to fall back to 2,300 USD/ounce or lower before strengthening again.

Trading Signal For XAUUSD Trading Setup:
There is a Trading Signal to Buy in Gold XAUUSD (h1)
Traders can open their Buy Trades NOW
⬆️ Buy Now or buy on 2334.6
⭕️SL @ 2321.0
🔵TP1 @ 2374.5
🔵TP2 @ 2406.4
🔵TP3 @ 2442.0
What are these signals based on?
Classical Technical Analysis
Price Action Candlesticks Fibonacci
RSI, Moving Average , Ichimoku , Bollinger Bands
Risk Warning
Trading Forex, CFDs, Crypto, Futures, and Stocks involve a risk of loss. Please consider carefully if such trading is appropriate for you. Past performance is not indicative of future results.
If you liked our ideas, please support us with your likes 👍 and comments .

XAUUSD IDEAThis is just simple trading idea draw into chart using labels and lines. Please use it as educational purpose and you are free to modify any

THE KOG REPORT - UpdateEnd of day update from us here at KOG:
Yesterday we posted the idea to short into the support level and then take the long trade back up looking for the higher levels, which has worked well. Our target level has been market complete, so for this report we would say, anyone long from below, protect, take partials and let's see if we can break above the 2350 region and hold if we're going to see higher pricing.
So, what now?
We have support below 2340, which has flipped us again but as you can see, we have a strong resistance level here in 2355. Ideally, we should see a pullback in the Asian session, and if held again a push upside into the higher levels. For us, we're done, we've have an extremely successful month again and due to it being the end of the month and a Friday tomorrow, we'll most likely be taking it easy in Camelot awaiting the monthly close.
So, if you're in you're in, happy days and protect. If you're not in, sit it out and come back next week.
As always, trade safe.
KOG

Hellena | GOLD (4H): Long to resistance area 2404.446.Dear colleagues, the markup turned out to be rather unusual, but I still assume that the price is headed for a correction in wave “4” (2328.823). This may mean that the price will soon start an upward movement at least to the area of the nearest resistance at 2404.446.
After confirmation of this movement we will consider options for further upward movement.
Manage your capital correctly and competently! Only enter trades based on reliable patterns!

SILVER Will Fall! Short!
Please, check our technical outlook for SILVER.
Time Frame: 1D
Current Trend: Bearish
Sentiment: Overbought (based on 7-period RSI)
Forecast: Bearish
The market is trading around a solid horizontal structure 31.601.
The above observations make me that the market will inevitably achieve 27.300 level.
P.S
We determine oversold/overbought condition with RSI indicator.
When it drops below 30 - the market is considered to be oversold.
When it bounces above 70 - the market is considered to be overbought.
Like and subscribe and comment my ideas if you enjoy them!

Closing my Selling order / #45 Profits rowAs discussed throughout my yesterday's session commentary: "I have closed my Selling order (#2,352.80 - #2,340.80) which delivered fine #12-point Profit, and on a pullback to #2,344.80, throughout the same session, I have re-Sold Gold on #2,344.80 and kept the Selling order with #2,300.80 benchmark Target which is currently running in excellent Profit. I am on #44 Profits and #9 Stop hits regarding October - May cycle."
I have closed second Selling order (#2,344.80 - #2,330.80) on a fine #14-point run and coupled with yesterday's #12-point Profit, I have extended my total Profits row on #45 Profits and #9 Stop-loss hits regarding October - May cycle. I will use this chance to congratulate Traders who re-Sold Gold with me, well done!
Technical analysis: Gold continues to Trade within healthy Daily chart’s Descending Channel, holding tightly the #2,327.80 - #2,332.80 pressure point as an Support zone (see how it held throughout today’s session on the exact spot, as well holding and untouched in #1-Month base). Assuming that the Selling pattern continues, then the current market sentiment represent an additional solid Selling opportunity towards the #2,300.80 extension (taken from mid-April Annual High’s), as recession sentiment is slowly fading so safe-haven assets such as Gold (which were in High-demand) should suffer as Investors are slowly losing interest which should add strong Buying pressure on Bond Yields and DX (my strongest correlations at the moment). There is however only one Resistance line left towards #2,372.80, which is currently Trading on #2,356.80 configuration (slim chances). I’ve been highlighting the #2,300.80 potential, and I assume with current market overview, Gold may test it within early next week's phase and sole reason why Gold isn't already Trading below it is mixed numbers on DX. After the Higher High’s Lower extension test it is pure speculation where market will be headed next, however my Technical estimates show (according to Weekly chart’s (#1W) historical resemblance / Bear cycle) that correction process on Gold is over and multi-Month Selling sequence will continue towards #2,200.80 benchmark first and #2,152.80 in extension (more Medium to Long-term).
My position: As it is Friday's session and as I am more than satisfied with my Trading results, I will not assume more orders for the session and take early weekend break.

USOIL Downtrend Line Rejection At $78.11 31.05.2024- USOIL downtrend line rejection at $78.11 on 30-minute chart
- If rejection holds, likely drop to $77.44
- Break below $77.44 could lead to $75.53
- If rejection fails, potential rise to $78.63
- Break above $78.63 could push price to $79.00
- Apply Risk Management
_____________________________________________________________________________
Risk Warning: Trading in CFDs is highly speculative and carries a high level of risk. It is possible to lose all of your invested capital. These products may not be suitable for everyone, and you should ensure that you fully understand the risks taking into consideration your investment objectives, level of experience, personal circumstances as well as personal resources. Speculate only with funds that you can afford to lose. Seek independent advice if necessary. Please refer to our Risk Disclosure.
BDSwiss is a trading name of BDS Markets and BDS Ltd.
BDS Markets is a company incorporated under the laws of the Republic of Mauritius and is authorized and regulated by the Financial Services Commission of Mauritius ( FSC ) under license number C116016172, address: 6th Floor, Tower 1, Nexteracom Building 72201 Ebene.
BDS Ltd is authorized and regulated by the Financial Services Authority Seychelles (FSA) under license number SD047, address: Suite 3, Global Village, Jivan’s Complex, Mont Fleuri, Mahe, Seychelles. Payment transactions are managed by BDS Markets (Registration number: 143350)

NATURAL GAS Rejection at the top of the Falling WedgeNatural Gas (NG!) hit last week the top (Lower Highs trend-line) of the long-term Falling Wedge pattern that started on the April 10 2023 Low and was immediately rejected back to the 1W MA50 (blue trend-line).
As long as it holds, this rejection indicates that technically, the new Bearish Leg should start. Our Target is 1.550 (just above Support 1). If however the trend reverses and gives a candle closing above the Lower Highs, we will take the sell's loss and buy instead, targeting 3.300 (projected 1W MA100 extension).
-------------------------------------------------------------------------------
** Please LIKE 👍, FOLLOW ✅, SHARE 🙌 and COMMENT ✍ if you enjoy this idea! Also share your ideas and charts in the comments section below! This is best way to keep it relevant, support us, keep the content here free and allow the idea to reach as many people as possible. **
-------------------------------------------------------------------------------
💸💸💸💸💸💸
👇 👇 👇 👇 👇 👇

GOLD (XAUUSD): Support & Resistance Analysis
Here is my latest structure analysis and important
key levels to focus on and trade on Gold.
Support 1: 2322 - 2328 area
Support 2: 2303 - 2308 area
Support 3: 2266 - 2286 area
Resistance 1: 2361 - 2364 area
Resistance 2: 2426 - 2450 area
Consider these structures for pullback/breakout trading.
❤️Please, support my work with like, thank you!❤️

OIL: First red day on the backside moveHi everyone and welcome to my channel, please don’t forget to support all my work subscribing and liking my post, and for any question leave me a comment, I will be more than happy to help you!
“Trade setups, not movements”
1. DAY OF THE WEEK (Failed Breakout, False Break, Range Expansion)
Monday DAY 1 Opening Range
Tuesday DAY 2 Initial Balance
Wednesday DAY 3 (reset DAY 1) Mid Point Week
Thursday DAY 2 ✅ Day 2 cycle
Friday DAY 3 Closing Range
2. SIGNAL DAY
First Red Day ✅
First Green Day
3 Days Long Breakout
3 Days Short Breakout
Inside Day
3. WEEKLY TEMPLATE
Pump&Dump ✅
Dump&Pump
Frontside
Backside ✅
4. THESIS:
Long: secondary, I could see Wednesday as a dump day pulling back above the opening range high, for a long trade back to the high of week, however, considering the market on the backside move, I will be willing to put more size into the short scenario.
Short: primary, first red day, market on backside, Monday to Wednesday pump, by tomorrow Oil can definitely have a good chance to reach the LOW
Please note that the purpose of my analysis is to help me and you hunting the best trade setup for the day, none of my technical aspects are a way to forecast any directional market movement.
Gianni
