Short Crude OilOn Daily Chart and 4H chart we created the megaphone(broadening formation) so I would check the top boarder of the formation and look for breaking market structure.
Futures market

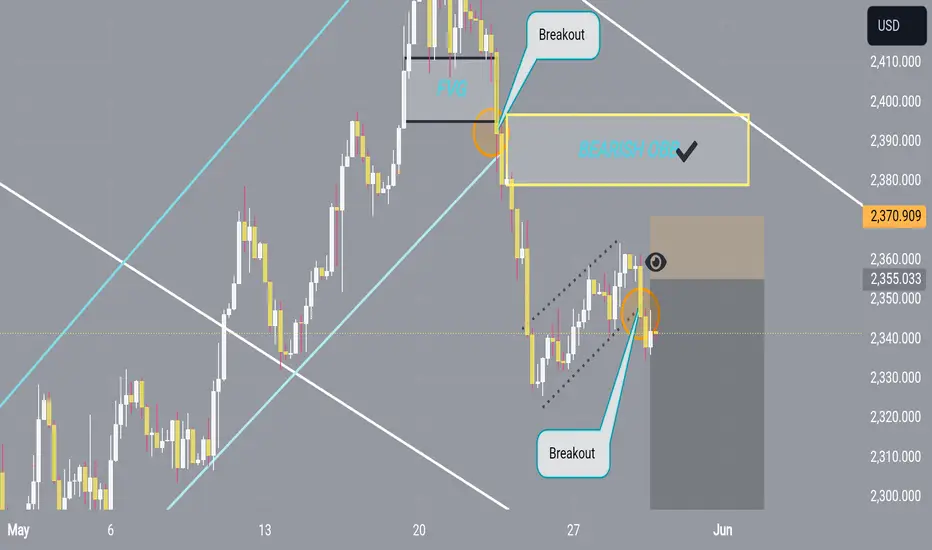
GOLD Local Long! Buy!
Hello,Traders!
GOLD is going down
But a horizontal support
Level of 2327$ is ahead
So after the retest
We will be expecting
A local bullish rebound
Buy!
Like, comment and subscribe to help us grow!
Check out other forecasts below too!

Crude Oil: Long Position Amidst Support and SeasonalityWe are considering a long position on crude oil, given that the price has reached a significant support area. This support level is reinforced by a divergence observed on the Relative Strength Index (RSI), suggesting a potential reversal in the current trend. Additionally, seasonality data supports the likelihood of a bullish movement during this period.
The convergence of these technical indicators and historical trends strengthens our conviction for a long setup. The RSI divergence indicates that the recent downward momentum may be waning, while the support area provides a strong foundation for a potential price rebound. Furthermore, seasonality data, which highlights recurring patterns in price behavior during specific times of the year, suggests that crude oil prices are poised for an upward movement.
In light of these factors, we are looking to establish a long position on crude oil, capitalizing on the technical setup and historical data that align to suggest a favorable entry point for a bullish trade.

SLV - CALLS!Silver has surged 33% this year, driven by its critical role in modern technologies and as a hedge against currency devaluation. Alan Hibbard, a noted analyst, recently discussed the factors behind silver's rise on Schwab TV, highlighting robust demand from both retail and institutional investors. Analysts expects silver to outperform gold in the short term, potentially reaching $50 an ounce. Central banks, particularly China, have been increasing their gold reserves, while copper has also reached record highs due to demand in green technologies. These dynamics underline silver's growing appeal in a turbulent economic landscape.
Personally bought $35 Strike 9/20 exp.
Buying if we go back and retest res as sup.
Multi 100% gainer!

Next Target is the Trendline TopIn Silver Future, Next Target is the Trendline Top. And Breakout will confirm the Bullish Trend.

Xauusd confirm chart Gold has been considered a highly valuable commodity for millennia and the gold price is widely followed in financial markets around the world. Mostly quoted in US Dollars (XAU/USD), gold price tends to increase as stocks and bonds decline. The metal holds its value well, making it a reliable safe-haven. It's traded constantly based on the intra-day spot rate. Improve your technical analysis of live gold prices with the real-time XAU/USD chart, and read our latest gold news, expert analysis and gold price forecast
Gold now sell 2336
Target 2330
Target 2320
Target 2300

XAUUSDI'm expecting gold to roll over to $2266 per ounce area after an impulsive leg down and a breather(retracement). we can see that momentum is back into the market after the 4hr bearish shift in market structure and after the bearish candle printed on last weekly candle it is expected to see a heavy bearish move to the downside tomorrow and friday. Trade safe.

Xauusd confirm signal FOMC Sell Gold has been considered a highly valuable commodity for millennia and the gold price is widely followed in financial markets around the world. Mostly quoted in US Dollars (XAU/USD), gold price tends to increase as stocks and bonds decline. The metal holds its value well, making it a reliable safe-haven. It's traded constantly based on the intra-day spot rate. Improve your technical analysis of live gold prices with the real-time XAU/USD chart, and read our latest gold news, expert analysis and gold price forecast.
Gold now sell 2389
Target 2385
Target 2381
Target 2350

Can the HOUSE CAPITALIZE Long above $80.00 Per Barrel...?NYMEX:CL1!
"If you train hard, you'll not only be hard, you'll be hard to beat." -Herschel Walker
Oil has been struggling to Break above $80.00 Per Barrel roughly this whole month of MAY and this week we could actually see buyers gain strength and get over the hump... However that is a long shot prediction! Now if this actually does come to pass then this is what I'll need to see in order to go LONG...
1) Price is currently trading around a 4Hr Supply Zone. ** I want to see buyers push price up N break the supply zone and continue towards the HTF S&R Zone....
2) We have a HTF Descending eR/LQ Trendline that I want to Buyers Breakout N push towards $80.00 Per Barrel... I would like to see a retest of the Failed 4Hr Supply Zone and eR/LQ trendline for buyers to gain more strength for pushing towards our target...
3) Now if we can get the sequence of events to take place that I stated above, Then we will wait for the break above $80.00 Per barrel with confirmed candle closures above price and above the S&R Zone... I want to see confirmed candle closures on the 30m TF N Below to establish conviction in the move from buyers to enter LONG....
4) Now if we can get the Break above $80.00 Per barrel with confirmed candle closures above price and above the S&R Zone then I'll Enter LONG and Target the break of the 4Hr Supply Zone price ($81.10 Per Barrel) 110 pts to be exact in our favor... Ill set my stop just below the S&R Zone EQ Level giving me roughly around a 2.7RR....
Remember when it comes to FRM (Financial Risk Management) our job is to manage the downside costs of printing High side returns of $$$ consistently... Let's Step!!
Stay Focused & Reach Excellence!!
#BHM500K #NewERA #Champions

Gold flag breakoutbearish flag broken = red boxes are possible targets
first red box = next demand
second red box = fib 1.618 (2248) to flag structure target (2238)

Gold Buy Idea Gold Buy idea Gold Buy idea Gold Buy idea Gold Buy idea Gold Buy idea Gold Buy idea Gold Buy idea Gold Buy idea Gold Buy idea Gold Buy idea Gold Buy idea Gold Buy idea Gold Buy idea Gold Buy idea Gold Buy idea Gold Buy idea Gold Buy idea Gold Buy idea Gold Buy idea Gold Buy idea Gold Buy idea Gold Buy idea Gold Buy idea Gold Buy idea Gold Buy idea Gold Buy idea

Gold going down gold Going downGold going down gold Going down Gold going down gold Going down Gold going down gold Going down Gold going down gold Going down Gold going down gold Going down Gold going down gold Going down Gold going down gold Going down Gold going down gold Going down Gold going down gold Going down Gold going down gold Going down Gold going down gold Going down Gold going down gold Going down

Gold bearish 2276Hey there on 4hTF the Gold has looking for continuing trying to drop down from 2300 level
So we are looking forward again drop liquidity
And also breakout candle looking for move sell side
usoil analysisusoil broke out the downtrend, and started a correction after the breakout, i expect that usoil is retesting the support zone on golden zone fibbo, before going bullish.

NATGAS - NAUGHTY FALL AHEAD ?Cup pattern is complete with double top resistance. Looking for a handle now.
Probable retracement area would be $2.5
Once pattern is complete Natty might fly high to $4.5 again?
Disclaimer: Do not consider this as a buy or sell recommendation. This is purely for educational purposes

Go long gold first, then go short goldGold has tended to be volatile in the past two days. As I predicted a few days ago, after the sharp decline, gold may digest the sharp decline in a volatile manner. Although the current market fluctuations are not large, it is still profitable. Judging from the current trend, the short-term decline has been alleviated, and the bulls have the motivation to continue to rebound. However, last week's high black candlestick chart was engulfed, laying the foundation for bearishness this week. The overnight strong impact also failed to break through the 2365 key point, indicating that there are still a lot of short pressure above 2360. So overall I still tend to be bearish on gold.
However, gold has now fallen back to around 2340. Before gold fails to fall below the 2335-2330 area, gold bulls still have room to fight back. So for the time being, I will not be too bearish on gold. In terms of short-term trading, I think both long and short sides have the potential to make profits.
So it has fallen back to around 2340. We can first participate in short-term long gold. After gold rebounds, we can consider shorting gold at the right time!
I share detailed trading strategies and trading signals every day. You can follow the channel at the bottom of the article to get detailed trading signals and learn trading logic. People who are already in it have already made a lot of money. Let us enjoy the journey of making money together. !

XAUUSD LongWith XAU/USD printing HH and HL's, I am entering long to capture a short move up.
Entry: 2342.87
Stop: 2332.33
Take profit: 2376.02

Sell Zone 2372-76check my previous ideas🤩 you can buy now gold with low lot, then sell from 2372 zone

short swing idea on XAUUSDA bearish flag pattern can be observed which suggests that the instrument will continue its downwards movement. There are no divergences so we can expect the bearish trend to continue in the long term.

Explosive Move IncomingI’m prepared for a small but big move towards the up position. Then more down, however you should be prepared to change your mind if the opposite happens!

Gold Deep PullbackGold has been volatile in the past two days, but everyone should be familiar with this rhythm. It is always quiet before the storm. Under the calm surface of gold, the big market is about to start. Since the pressure of 2450, the daily line has fallen sharply for three consecutive days, and then rebounded for three consecutive small positive lines. The short-term rebound rhythm is almost the same, which is in line with our expectations. The short-term trend suppression is also around 2365-2370, so after the short-term three consecutive positive adjustments, the price may weaken and fall again. The trend rebound in recent days is very weak, and the decline is completely under our control!
Today, gold focuses on the repeated pressure of 2352. If it falls below 2352 during the day, the bearish thinking remains unchanged. The price will have good support at 2340. Relative to the weakening of the market, the stage rebound will continue to be weak. The effective support below is around 2336, and the lower track of the 1-hour Bollinger band is at 2328. The lower track of the daily MA60 moving average 2320 and the lower track of the daily line 2310 are used as defensive support points.
On the whole, today's short-term gold operation advice is mainly to go short after the rebound, supplemented by long after the callback. The top short-term focus is on the 2356-2362 resistance range, and the bottom short-term focus is on the 2330-2325 support range.

Silver uptrend intact & looking good!After overcoming resistance at $34/$34, the next stop is $50 where a substantial correction should take place.

GOLD 4H CHART ROUTE MAP UPDATEHey Everyone,
Another great day on the chart today, tracking the movement up and down.
Yesterday we stated after hitting 2361 that we now need to see ema5 lock above 2361 to open the next target or rejection with no lock. We were able to get a few more hits on the 2361 level during Tokyo session and were able to use the smaller timeframes to buy dips.
2361 failed to cross with ema5 and therefore confirmed the rejection that we are seeing now towards the 2322 weighted level. As long as ema5 remains above 2322, we can use our smaller time-frames and intraday levels to buy dips from this range.
Our 1h chart has a gap open to 2365, which was just short by a few pips but as good as done and we have support at 2331 on the 1H chart. We will keep this in mind, as we track both charts.
We will keep the above in mind when taking buys from dips. Our updated levels and weighted levels will allow us to track the movement down and then catch bounces up.
We will continue to buy dips using our support levels taking 30 to 40 pips. As stated before each of our level structures give 20 to 40 pip bounces, which is enough for a nice entry and exit. If you back test the levels we share every week in the past 24 months, you can see how effectively they were used to trade with or against short/mid term swings and trends.
BULLISH TARGETS
2361 - DONE
EMA5 CROSS AND LOCK ABOVE 2361 WILL OPEN THE FOLLOWING BULLISH TARGET
2385
EMA5 CROSS AND LOCK ABOVE 2385 WILL OPEN THE FOLLOWING BULLISH TARGET
2416
BEARISH TARGETS
2322
EMA5 CROSS AND LOCK BELOW 2322 WILL OPEN THE FOLLOWING BEARISH TARGET
2290
EMA5 CROSS AND LOCK BELOW 2290 WILL OPEN THE FOLLOWING SWING RANGE
SWING RANGE
2274 - 2246
As always, we will keep you all updated with regular updates throughout the week and how we manage the active ideas and setups. Please don't forget to like, comment and follow to support us, we really appreciate it!
Mr Gold
GoldViewFX
