SPX/VTI bear flagSPX, VTI forming a barish flag pattern in the 15m timeframe.
The chart above is in 4h, to provide the fib view also. You can clearly see a bearish flag in the 15m TF, try it yourself.
Target: 234-236 (-5.5%)
VTI trade ideas

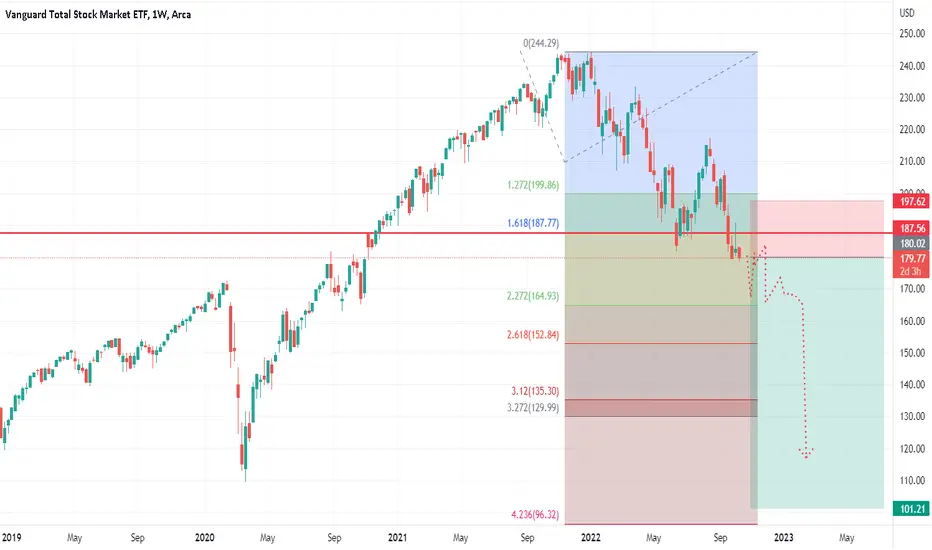
For the doomsday peopleYeah, I could see it. Dunno if it'll happen, but I definitely see it.
Good setup for a pullback in the least. Given how Feds are at the moment, what stops a crash?

Are Foreign Stocks Forging a Relative Comeback? Perhaps the most important macro driver for stock prices in the last year and a half has been the US Dollar Index. The DXY has ranged between the upper 90s and about 107 since the third quarter of 2022. When the greenback has been on the rise, equities have generally been weak. A softer dollar has led to a period of stock market strength. Of course, ebbs in the forex market are always crucial for foreign stocks. That brings me to today's idea.
The Vanguard FTSE All-World ex-US ETF (VEU) has sharply underperformed the Total US Stock Market ETF (VTI) since 2007. In that time, the dollar has moved from the low 70s to well above 100. I like to compare the relative price chart of VTI to VEU for a gauge of relative strength between the US and non-US markets. Right now, it might appear that discarding VEU in favor of an all-US portfolio would make the most sense. But I am monitoring a potential false breakout on the chart of VTI/VEU. If we see a continued drop off in relative US strength, then a move toward support, illustrated on the chart could be in play over the coming months.
So, don’t forget about the 37% chunk of the investable equity universe that is foreign stocks. Fundamentally, VEU trades about 13 times forward earnings estimates compared with about 19 times on the US cap-weighted index. The ex-US market also features more sector diversification and a higher dividend yield. Of course, this key technical move right now bears close watch for macro investors as 2024 gets underway.

#VTI#The decision to maintain current interest rates, as announced in the latest Federal Reserve meeting, is likely to have a positive effect on the stock market. However, it is essential to consider current geopolitical tensions that may influence market dynamics. Overall, I remain optimistic about the future trajectory of the US stock market, particularly for ETFs encompassing the tech sector, which tend to exhibit robust technical performance.
Analyzing VTI's technical indicators, we see a similar pattern to VOO's. On the 4-hour chart, the RSI is approaching the overbought threshold, suggesting a short-term resistance level around $214. On the daily chart, the appearance of a bullish MACD crossover signals the end of a bearish trend. Looking at the weekly chart, it seems we are nearing the end of a fourth-wave, with a primary price target at $282.46 and a secondary target around $348.96.

$VTI Cup W/ Handle Formation?AMEX:VTI – Vanguard Total Stock Market ETF looks to be forming a Cup with Handle on the Weekly Chart.
I have an alert set for a cross over the top if the handle trendline. If the market firms up and this triggers, I will use a lower timeframe to look for a good RR entry and stop loss.
Ideas, not investing / trading advice. Comments always welcome. Thanks for looking.

VTI hitting bottom of channel looking for bounceI do not hold VTI but instead VTSAX as my main long-term hold for spot account. This channel has stayed true for a while and this bounce zone could be a good DCA add.

VTI at classic bull trap levels. VTI now has a classic bull trap formation. Big decision level here. Were we to see a rejection of the attempt at a new high and breaking of the 2022 low we'd likely only have seen the early section of the VTI drop.
A spot to be careful for bulls.

Total Stock Market reveals recession trend lineThe total stock market tracked by AMEX:VTI looks fairly bullish in that we are now trending along post-Great Recession (GR) lows for the upper non-recessionary channel defined since the GR. So if no recession is ahead of us (a very BIG if), things ought to be looking up.
The two most recent recessions each hit the same lowest bound in this two-tiered channel defined since the GR, suggesting that this lowest trend line may mark reliable 'recession resistance' such that it might mark the low point for the next recession. I'm surprised that there is this fairly obvious recession-tested lower bound that I've never seen anyone point out before, so I wanted to share this observation.

this is really lazy but yeahyou can clearly see where my head is at. i have to write a bit more for tv to let this post, or else i wouldve wrote less.

Historical Comparison of Vanguard Sector ETFsQuick comparison chart to see which performed better (or worse) during bull and bear markets.
It's not always a straight-forward answer, and more variables involved.
But... should give you an idea all things else equal regarding ticker choices and weights.

VTI massive monthly Head and Shoulders VTI has a monthly bearish divergence in RSI. There is massive head and shoulders forming. Headlines coming about how money is flowing in. I believe they just want money to flow in so they can have liquidity to dump into. The market has had the most orderly decline this year that I know of. I still believe massive downside is in store for ETF's, blue chips that haven't fallen yet (AHEM $AAPL) and oil as well after the fantastic year it just had. We have been goin straight up since GFC and now it's time to give some back. Hopefully not too much. First price target is green ray.

Santa rally or the grinch that stole Christmas?Will we have a Santa rally or the grinch that stole Christmas? Here's the US Equity market VTI etf December stats pattern search. The past 13 years (baker's dozen) December is historically bullish probability wise.
December 2009 - 2022
10 bull December
3 bear December
77% odds bull
23% odds bear
Average bull percent = +2.37%
Average bear percent = -4.32%
Forecast bull price = $208.90
Forecast bear price = $195.24
November 2022 close = $204.06
1 month moving averages:
EMA12 = $203.45
SMA24 = $212.43
SMA50 = $180.96
SMA100 = $149.01
December 2009 = +2.21%
December 2010 = +6.39%
December 2011 = +0.41%
December 2012 = +0.55%
December 2013 = +2.19%
December 2014 = -0.56%
December 2015 = -2.68%
December 2016 = +1.35%
December 2017 = +0.67%
December 2018 = -9.71%
December 2019 = +2.25%
December 2020 = +4.25%
December 2021 = +3.42%
December 2022 = ?%
Do your own due diligence, your risk is 100% your responsibility. This is for educational and entertainment purposes only. You win some or you learn some. Consider being charitable with some of your profit to help humankind. Good luck and happy trading friends...
*3x lucky 7s of trading*
7pt Trading compass:
Price action, entry/exit
Volume average/direction
Trend, patterns, momentum
Newsworthy current events
Revenue
Earnings
Balance sheet
7 Common mistakes:
+5% portfolio trades, capital risk management
Beware of analyst's motives
Emotions & Opinions
FOMO : bad timing, the market is ruthless, be shrewd
Lack of planning & discipline
Forgetting restraint
Obdurate repetitive errors, no adaptation
7 Important tools:
Trading View app!, Brokerage UI
Accurate indicators & settings
Wide screen monitor/s
Trading log (pencil & graph paper)
Big, organized desk
Reading books, playing chess
Sorted watch-list
Checkout my indicators:
Fibonacci VIP - volume
Fibonacci MA7 - price
pi RSI - trend momentum
TTC - trend channel
AlertiT - notification
tickerTracker - MFI Oscillator
www.tradingview.com

Markets topped at RSI 50-55 all year Nothing fancy, US stocks are in a downtrend with downward pressure by a falling 50-week MA.
RSI of 50-55 has been the upper bound of RSI all year and coincided with tops in January, March, and August.
The 200-week MA is still rising and may provide near term support. However, in recessions this support is decisively broken (see 2020 and 2008). Given the velocity of the market downtrend, whether the 200-week MA will be upheld may be answered within the next 6 months.
Markets are chopping lower, navigate markets carefully.

Comparing Vanguard to BTC In both of these charts, you can see the correlation between 2 sectors that had if not IDENTICAL run ups due to their nature of being overbought and unregulated. (housing crisis of 08 vs Crypto crisis of 2022)
As of now we are still on our path downwards. The housing crisis took until Nov 2007 to late 2009 to start on the path of recovery. We know cryptocurrency is here to stay and the technological advances in our payments systems and the way we book keep and communicate will eventually if not be on blockchains.
Being that it took us 2 years to recover from the housing crash by implementing regs such as Dodd Frank and Fannie Mae, Freddie Mac, FHA, VA, ext. we have a much more investor friendly housing market. Crypto will soon be on that path with regulations. 2023 should be a ideal year to add to short positions or even build upon current ones. However 2024 it would be unsafe to carry that mentality. Regardless of who is president, this market sentiment will turn around and 2024 we can expect a reversal.

US Election patternIs there a US Election month pattern? US Federal elections are always on the first Tuesday following the first Monday in November. This year election day is tomorrow, Tuesday 11/8. Statistically speaking November is a bullish month for US equities. As you can see here on the VTI 1month chart for the past dozen years, 10 out of 11 times November has closed with a green candlestick. Will this November 2022 become 11 out of 12 green monthly candlesticks? If so, that would mean VTI would have to close above $196 by the end of this month. Only time will tell for certain, but probability wise, November has a high probability for having a bullish end result.
Do your own due diligence, your risk is 100% your responsibility. This is for educational and entertainment purposes only. You win some or you learn some. Consider being charitable with some of your profit to help humankind. Good luck and happy trading friends...
*3x lucky 7s of trading*
7pt Trading compass:
Price action, entry/exit
Volume average/direction
Trend, patterns, momentum
Newsworthy current events
Revenue
Earnings
Balance sheet
7 Common mistakes:
+5% portfolio trades, capital risk management
Beware of analyst's motives
Emotions & Opinions
FOMO : bad timing, the market is ruthless, be shrewd
Lack of planning & discipline
Forgetting restraint
Obdurate repetitive errors, no adaptation
7 Important tools:
Trading View app!, Brokerage UI
Accurate indicators & settings
Wide screen monitor/s
Trading log (pencil & graph paper)
Big, organized desk
Reading books, playing chess
Sorted watch-list
Checkout my indicators:
Fibonacci VIP - volume
Fibonacci MA7 - price
pi RSI - trend momentum
TTC - trend channel
AlertiT - notification
tickerTracker - MFI Oscillator
www.tradingview.com

VTI - Broad Index Fund (Sp500)Vti is the entire SP500 index fund with low cost. If you have no clue about companies and stuff and still want to be part of USA who is biggest economy in the world at the moment, VTI is your go to. Markets are struggling so i wanted to look HTF charts and best possible prices to accumilate over time.
Fibonacci is great tool for long term price targets. 0.5 is great start, 0.618-66 golden ratio zone are perfect.
You'll thank me 5-10years later.

Bear market or FOMC market?Bear market or FOMC market?
The standard definition of a bear market is when major U.S. stock indices, such as the S&P 500, drop by 20% or more from their peak. The signs of a weak or slowing economy are typically low employment, low disposable income, weak productivity, and a drop in business profits. In addition, any intervention by the government in the economy can also trigger a bear market. A secular bear market can last anywhere from 2 to 10 years and is characterized by below-average returns on a sustained basis. There may be rallies within secular bear markets where stocks or indexes rally for a period, but the gains are not sustained, and prices revert to lower levels. A cyclical bear market, on the other hand, can last anywhere from a few weeks to several months. Short selling, put options, and inverse ETFs are some of the ways in which investors can make money during a bear market as prices fall.
FOMC Prees Release October 21, 2021. Federal Reserve Board announces a broad set of new rules that will prohibit the purchase of individual securities, restrict active trading, and increase the timeliness of reporting and public disclosure by Federal Reserve policymakers and senior staff. Fed officials traded in individual stocks, real estate securities and stock funds in 2020, a year in which the central bank rolled out a range of pandemic response programs that placed official's day-to-day decisions at the core of what happened in financial markets. Three high-ranking policymakers resigned earlier than they had planned after news of the trading became public.
The policymaking Federal Open Market Committee announced that most of the restrictions will formally take effect on May 1, 2022. The rules will cover FOMC members, regional bank presidents and other officials including staff officers, bond desk managers and Fed employees who regularly attend board meetings. They also extend to spouses and minor children. It prevents senior officials from purchasing individual stocks or funds tracing business sectors and they ban investments in individual bonds, cryptocurrencies, commodities or foreign currencies, among other securities.
Do your own due diligence, your risk is 100% your responsibility. This is for educational and entertainment purposes only. You win some or you learn some. Consider being charitable with some of your profit to help humankind. Good luck and happy trading friends...
*3x lucky 7s of trading*
7pt Trading compass:
Price action, entry/exit
Volume average/direction
Trend, patterns, momentum
Newsworthy current events
Revenue
Earnings
Balance sheet
7 Common mistakes:
+5% portfolio trades, capital risk management
Beware of analyst's motives
Emotions & Opinions
FOMO : bad timing, the market is ruthless, be shrewd
Lack of planning & discipline
Forgetting restraint
Obdurate repetitive errors, no adaptation
7 Important tools:
Trading View app!, Brokerage UI
Accurate indicators & settings
Wide screen monitor/s
Trading log (pencil & graph paper)
Big, organized desk
Reading books, playing chess
Sorted watch-list
Checkout my indicators:
Fibonacci VIP - volume
Fibonacci MA7 - price
pi RSI - trend momentum
TTC - trend channel
AlertiT - notification
tickerTracker - MFI Oscillator
www.tradingview.com

VTI is under its 161 of the topping swing. After complying with the 161 topping tendency, VTI has now made a break of the 161 of the topping swing and held a retest. These are things often seen in macro reversals.
Total Stock Market (Bottom Prediction and Hypothesis)It honestly just makes sense. This should end around 35%. The market will be at its fair value once again.

VTI 4-6 month/ Personal trading planThis post is personal. We all have strategies on trading and the most important things for any trader in my opinion is to finally discover his/her strategy which suites there emotional temperament (pessimist / optimist). intellectual capacity ( children with a few simple rules trade better then many seasoned smart adult analysts/ proven back-testing results) , and their life style (how much time do you have, and the time frame you feel comfortable with).
We trade up to 25 stocks/commodities and about 10 at any given time and are on a mostly weekly cycle. VTI is one of them. 90% of the stock we trade have similar wave patterns (as this cuts down on analyzing time), we short for a hedge. The commodities we trade are more on the monthly cycle trade commodities less often. We analyze with indicators, Elliott and trendlines, we try to ignore the news media. When it comes to Elliott counting we believe the count which make you money is the "right count". Our simple rule is BUY low and SELL high, when his is done consistently you will inevitably see your portfolio go up,.... it works.
Anyway if you have thoughts please feel free to share, again I am sharing a very personalized trading plan this may not fit you temperament, style of trading or your time frame.

VTI 8/19 expiryThis Friday 8/19 is August monthly options expiry. Technically, the risk:reward and probability are to lean short now at this entry point. I'm thinking the market goes sideways at best this week. Here's a Mega Triangular Trend Channel MTTC2.0 (beta) set to 200SMA with 19 levels. And my tickerTracker MFI Oscillator set to 20 with SPY, VTI, QQQ, IWM & DIA.
Do your own due diligence, your risk is 100% your responsibility. This is for educational and entertainment purposes only. You win some or you learn some. Consider being charitable with some of your profit to help humankind. Good luck and happy trading friends...
*3x lucky 7s of trading*
7pt Trading compass:
Price action, entry/exit
Volume average/direction
Trend, patterns, momentum
Newsworthy current events
Revenue
Earnings
Balance sheet
7 Common mistakes:
+5% portfolio trades, capital risk management
Beware of analyst's motives
Emotions & Opinions
FOMO : bad timing, the market is ruthless, be shrewd
Lack of planning & discipline
Forgetting restraint
Obdurate repetitive errors, no adaptation
7 Important tools:
Trading View app!, Brokerage UI
Accurate indicators & settings
Wide screen monitor/s
Trading log (pencil & graph paper)
Big, organized desk
Reading books, playing chess
Sorted watch-list
Checkout my indicators:
Fibonacci VIP - volume
Fibonacci MA7 - price
pi RSI - trend momentum
TTC - trend channel
AlertiT - notification
tickerTracker - MFI Oscillator
www.tradingview.com

Vanguard Total market ETF to fall -26.15% down to 144The Vanguard Total Market ETF on a monthly timescale already highlights an ongoing correction downfall in the ETF marked-to-market net asset value. In the coming months, the Vanguard Total Market ETF could well fall another -26.15%
down to 144 points, where the ETF price trendline would test the IKH Senkou A/B support, which would match up the support line of the structural trading channel.
MACD oscillator also signals an ongoing Sell Signal that will continue its retracement toward the channel.

RSI and 200 week MA suggest a buyMedium to long-term entry is reasonable here, but the 200 week MA is not a precise timing mechanism.
If we are in a secular bear market, moving averages could reverse and no longer be reliable, as seen in 2007 - 09.
Hopefully we are closer to the end than the beginning.
