UEC Uranium space is breaking out again. Amir keeps looking smarter and smarter all the time. Like ten fifteen years ahead of the pack. Boss Energy also looking nice. It’s at least competitive with UEC, but they move a little differently, so the pair reduce volatility.
ETF market

HydrogenThis is mission accomplished to the downside for Hydrogen. Plug Power made a deep retrace. Not full retrace, but still very deep. Fcel just closed a gap in the volume profile down to $.87, and even lower. I’m in at 2.40. You just need to zoom out. Always zoom out to know what’s about to happen. A nasty reversal to the upside. You have been lulled to sleep by record low volatility in the hydrogen space, and low volatility begets high volatility, and all of the hydrogen space, etfs and stocks, is coming off a “higher low” in the largest timeframes. Do don’t see this, because most all of the etf originate at the most recent high, so all they have done is fall. Nobody knows what the etf will do once they see inflow.

Thrift Savings Plan (TSP) S-Fund $DWCPF $VXF next leg up?Broke through the 50 DMA, VWAP resistance and Volume shelf.

When it comes to broadening wedges...AMEX:SPY Here we have a few broadening wedges. The last 2 were descending and SPY blasted off to new ath highs. Now were in a ascending wedge and sitting at 514. We have a few big name ERs that can put us back on the path to new aths but I think we are heading back to 480 by July based on the previous wedge behavior, and long support and resistance.

Spy may 6 Set up looks like it wants to fall/Puts. I think we would need a nice gap/push up Monday morning to fill another gap


Strategic Entry Points for SPY.SPDR S&P 500 ETF Trust (SPY) is showing signs of potential bullish momentum after a period of consolidation. Based on an in-depth examination of the technical indicators and recent price action, there are actionable insights that sophisticated traders might leverage.
The ETF has formed a notable (bullish engulfing pattern) on the daily chart, suggesting a strong reversal from the recent downtrend. This pattern, coupled with a break above the descending trendline, indicates increasing buying pressure. The ETF is currently testing a critical resistance level, and a decisive breakout above this point could confirm the continuation of the uptrend.
RSI (Relative Strength Index): The RSI is slightly above the mid-line at 55, suggesting a growing bullish momentum without being overbought.
MACD (Moving Average Convergence Divergence): The MACD line has crossed above the signal line and is trending upwards, which is traditionally seen as a bullish signal.
Volume: There has been a noticeable increase in volume accompanying recent bullish candles, indicating strong buyer interest.
Stochastic RSI: This oscillator is trending upwards but has not yet reached overbought levels, suggesting there is room for upward movement before the ETF becomes overextended.
SPY is currently positioned above several key moving averages, including the 10, 20, and 50-day MAs, which are now acting as support levels. This positioning underpins the bullish sentiment.
Support: The immediate support is found at the $506 level, with more robust support at $495, aligning with the 100-day moving average.
Resistance: Immediate resistance is observed around $518. Further resistance can be expected near the $530 level.
Long Position: Consider initiating a long position if SPY breaks and holds above the $518 resistance level. A successful hold would target a move towards the next resistance at $530. Set a stop loss just below the breakout level at $515 to mitigate risk.
Short Position: A short opportunity may arise if SPY fails to breach the $518 level and shows reversal patterns. In this scenario, a move back towards $506 could be targeted. Place a stop loss at $521 to limit potential losses.
If the bullish momentum continues with support from market fundamentals, SPY could potentially approach the $530 mark in the short term. A breach above this level could extend gains towards $540, guided by the momentum indicators and moving averages supporting upward movements.
The SPDR S&P 500 ETF Trust shows promising signs for both bullish and bearish traders, with defined levels for entry and exit based on current technical setups. Traders should closely monitor these levels, along with volume and price action, to align their strategies with the prevailing market conditions. As always, it is crucial to consider external market factors and news events that could impact market sentiment and price action.

XBI - biotech has been hot last weekI like this breakout on XBI.
I'm in with a bigger position and we're sitting right at the 100SMA> We could retest from here closer to 88/86 but below that I'd cut the trade.
It's also sitting in a demand zone and ideally moves above $92/ 93.

SPY WEEKLY-MAY 6 2024Welcome to SPY weekly and I have clearly explained which levels to trade & what direction market can take.
If you have any questions feel free to DM
NOTE: AVOID TRADING SPY

Spy 4hr Major demand at the $500 level (zone 1). Pushed thru zone 2 now trading in zone 3. I expect some consolidation and a strong pullback to possibly back zone 2 before a continuation up to the upside.


SPY: Last week of AprilSeems like its going to be a short.
HA setup for a move to 500 inclusive of extended hours, with an equal bearish setup to 501 with extended hours toggled off.
Interestingly enough 500 is also PL2 on the prospective levels (in the chart above).
Sentiment for Monday is neutral to bearish. I have included some old tricks and models since this past week relying on one alone really gave me a run for my money haha.
Pinescript similar day analysis: Neutral (equal bullish and bearish days);
R Similar day analysis: Bearish
R Logistic Regression model: Bearish
R Z-Score Model: Bearish
So let's hope that its going to be bearish on Monday haha.
For the Week, half the models were unsure, the other half were questionable based on the cases. So let's leave it as neutral.
It doesn't matter too too much because there is a really nice HA setup which gives a TP of PL2 on the week. We also have a bearish reference target at around 507. Remember with those, we open above, we will generally circle back down and if we open below we will generally circle back up.
Let's hope SPY gives it up.
If we do snag these low targets, the question becomes, when do we reverse back up. The answer likely being at the low targets. Market is bullishly bearish with constant over-exaggerated bounces everywhere. You really can't do wrong longing unless you over-stay.
Those are my thoughts. Adopt a bullish bias if we end up snagging the reference target and holding it as support (because its right on the bearish condition). If that happens and we head back up, its looking like a bullish thesis is more correct.
Let's see what we get!

Soybeans and Corn are ready to goAMEX:SOYB and AMEX:CORN seem to be heading for big moves.
Not the most glamarous commodities but if one has leverage they can get a great risk to reward ratio.
Does anyone know how I can buy these commodities ?

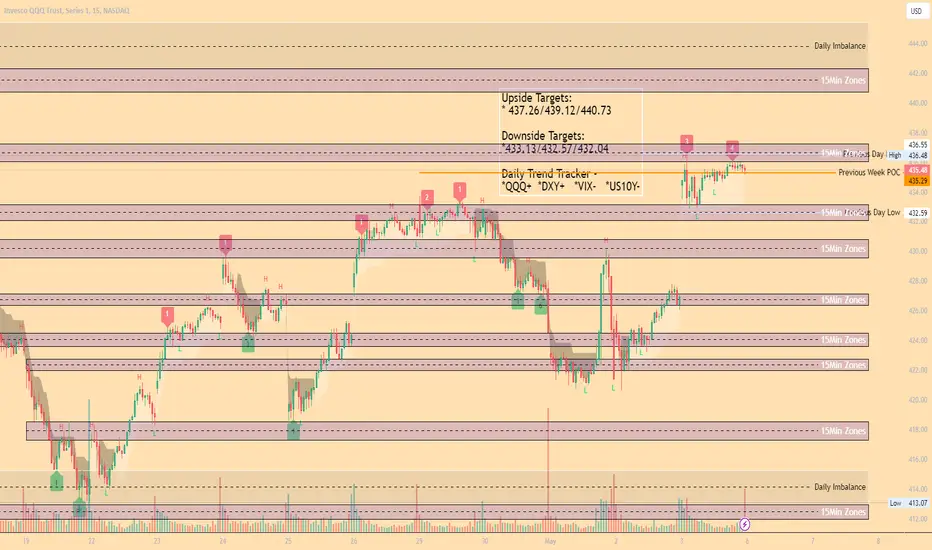
QQQ Scalping Zones 5/6Upside Targets:
* 437.26/439.12/440.73
Downside Targets:
*433.13/432.57/432.04
Daily Trend Tracker -
*QQQ+ *DXY+ *VIX- *US10Y-
BEAR FLAG FORMATION FOR SMALL CAPS 🐻🚩 PRICE TARGETS SETThere is bear flag formation for small caps 🐻🚩 AMEX:IWM
We have pointed FIB price targets for both the upside and downside.
We expect the retracement to go as between the range as low as $169 to $176
Will you be shorting?👀

SPY Under Pressure! SELL!
My dear friends,
My technical analysis for SPY is below:
The market is trading on 511.28 pivot level.
Bias - Bearish
Technical Indicators: Both Super Trend & Pivot HL indicate a highly probable V continuation.
Target - 507.15
About Used Indicators:
A pivot point is a technical analysis indicator, or calculations, used to determine the overall trend of the market over different time frames.
———————————
WISH YOU ALL LUCK

SPY Trading Opportunity! SELL!
My dear subscribers,
This is my opinion on the SPY next move:
The instrument tests an important psychological level 508.23
Bias - Bearish
Technical Indicators: Supper Trend gives a precise Bearish signal, while Pivot Point HL predicts price changes and potential reversals in the market.
Target - 504.66
About Used Indicators:
On the subsequent day, trading above the pivot point is thought to indicate ongoing bullish sentiment, while trading below the pivot point indicates bearish sentiment.
———————————
WISH YOU ALL LUCK

QQQ: Bearish Continuation is Highly Probable! Here is Why:
The charts are full of distraction, disturbance and are a graveyard of fear and greed which shall not cloud our judgement on the current state of affairs in the QQQ pair price action which suggests a high likelihood of a coming move down.
❤️ Please, support our work with like & comment! ❤️

Trading with RSI: The Bad, The Good and Even BetterIn this video I explain how to use RSI (Relative Strength Index) to make trading decisions. You'll learn how to properly use RSI oversold condition, combining low timeframe price action signals with high level context analysis.
Besides of explaining three different strategies (the bad, the good and even better) I'll do back-testing on historical data to demonstrate how those strategies translate into real trading results.
Disclaimer
I don't give trading or investing advice, just sharing my thoughts.

Bullish on Chinese equities - breaking outBreaking out of long term decline - however might pullback shortly before moving higher

SPYjust idea for my self for spy , if broke will might go for 596 or 600 , other why we will see pull back around 476 and go up
that what i hop and i'm not sure :)
thank you for vist

$SPY daily trend breakoutAMEX:SPY has broken above the April trendline as it sits below monthly support/resistance levels.
Note : there is a new gap to fill below from fridays significant gap up at open.
Question : Can someone tell me if that is a bullish doji star?

Expired GLD Weekly outlook. 1st WK MAY 2024Expired GLD Weekly outlook. 1st WK MAY 2024
> NEUTRAL 📊 CORRECT
Closed Price: 216.62
Target Price: 214.14 | Strike Price: 211.50 APR30 24'
Upper Range: 217.38
Lower Range: 210.90
