Datafeed API
Overview
The library allows connecting market data to the chart in two ways:
- By using the built-in UDF adapter.
- By implementing your own datafeed via the Datafeed API.
This article describes the Datafeed API methods, their implementation details, and the sequence of method calls. You can also refer to the How to connect data via Datafeed API tutorial for a step-by-step guide.
Integrate Datafeed API
The Datafeed API is a set of methods that you should implement in JavaScript and assign to the datafeed property in Widget Constructor. The library calls these methods to access and process data. In response, you should evoke the provided callbacks to pass the data to the library.
The diagram below illustrates how the Datafeed API should be integrated with the library and your backend server.

All Datafeed API members are listed in the IDatafeedChartApi interface. If you use Trading Platform, you should also implement additional methods.
Asynchronous callbacks
As mentioned above, you should evoke callbacks to pass data to the library. Note that all callbacks should be evoked asynchronously. In context of the JavaScript Event Loop, the callbacks can only be evoked within different MacroTask. Otherwise, the Uncaught RangeError: Maximum call stack size exceeded issue might occur.
If you have data ready at the time of a request, you can set a delay as demonstrated below to ensure that a callback is only evoked when the library is ready.
setTimeout(() => { historyCallback(data); }, 0);
Note that the library can modify bar data that you provide utilizing callbacks. Pass a copy of the data to avoid potential issues.
Advanced Charts methods
The following methods relate to Advanced Charts and Trading Platform.
onReady
The library calls the onReady method when the chart is initialized. This method supplies the library with the datafeed configuration data such as supported symbol types, exchanges, time intervals (resolution), currency codes and more. Call the OnReadyCallback and pass a DatafeedConfiguration object as a parameter:
onReady: (callback) => {
    console.log('[onReady]: Method call');
    setTimeout(() => callback(configurationData));
}
The following code sample shows the DatafeedConfiguration implementation:
const configurationData = {
    supports_search: true,
    supports_group_request: false,
    supports_marks: true,
    supports_timescale_marks: true,
    supports_time: true,
    exchanges: [
        { value: "", name: "All Exchanges", desc: "" },
        { value: "NasdaqNM", name: "NasdaqNM", desc: "NasdaqNM" },
        { value: "NYSE", name: "NYSE", desc: "NYSE" }
    ],
    symbols_types: [
        { name: "All types", value: "" },
        { name: "Stock", value: "stock" },
        { name: "Index", value: "index" }
    ],
    supported_resolutions: ["D", "2D", "3D", "W", "3W", "M", "6M"]
}
searchSymbols
The library calls the searchSymbols method to request symbols that match some user input. Pass the resulting array of symbols as a parameter to SearchSymbolsCallback.
searchSymbols: async (
    userInput,
    exchange,
    symbolType,
    onResultReadyCallback,
) => {
    console.log('[searchSymbols]: Method call');
    const symbols = await getMatchingSymbolsFromBackend(userInput, exchange, symbolType);
    onResultReadyCallback(newSymbols);
}
As a result, the library gets an array of SearchSymbolResultItem objects that have the following format:
[
    {
        "symbol": "<short symbol name>",
        "description": "<symbol description>",
        "exchange": "<symbol exchange name>",
        "ticker": "<symbol ticker name>",
        "type": "stock" // "futures"/"crypto"/"forex"/"index"
    },
    {
        //...
    }
]
If no symbol is found, pass an empty array to SearchSymbolsCallback.
You can adjust the frequency of search requests utilizing the symbol_search_request_delay property.
resolveSymbol
The library calls the resolveSymbol method to get symbol information such as the exchange, time zone, trading hours, etc. Specify this information in a LibrarySymbolInfo object as demonstrated below:
const symbolInfo = {
    ticker: 'BTCUSD',
    name: 'BTCUSD',
    description: 'Bitcoin/USD',
    type: symbolItem.type,
    session: '24x7',
    timezone: 'Etc/UTC',
    exchange: 'Example Exchange',
    minmov: 1,
    pricescale: 100,
    has_intraday: false,
    visible_plots_set: 'ohlcv',
    has_weekly_and_monthly: false,
    supported_resolutions: ['1', '5', '30', '60', '1D', '1W'],
    volume_precision: 2,
    data_status: 'streaming',
};
Pass symbol information as a parameter to ResolveCallback. If the symbol cannot be resolved, call DatafeedErrorCallback and specify an error message.
resolveSymbol: async (
    symbolName,
    onSymbolResolvedCallback,
    onResolveErrorCallback,
    extension
) => {
    try {
        const symbolInfo = await getSymbolInfoFromBackend(symbolName, extension);
        onSymbolResolvedCallback(symbolInfo);
    } catch (err) {
        onResolveErrorCallback(err.message);
    }
}
You can display the default TradingView icon when error occurs. To do this, specify the "unknown_symbol" error message:
onResolveErrorCallback("unknown_symbol");
In this case, the chart shows the following icon and message.
If the icon is not displayed, make sure that the hide_image_invalid_symbol featureset is not enabled.
getBars
The library calls getBars to get historical data in a certain range. To transfer the requested data, pass an array of Bar objects to HistoryCallback.
The library caches historical data. Therefore, you do not need to implement a client-side cache.
Bar order
The array of Bar items should be arranged in ascending chronological order, meaning that the timestamps of the bars should be getting bigger for each bar in the array. For example, [1484179200, 1484265600, 1484611200, ...].
Note that for daily, weekly, and monthly bars, the time value should represent the beginning of the trading day at 00:00:00 UTC, not the beginning of the session.
Correct amount of data
The library calculates the amount of data that is necessary to fill the chart space and requests it in getBars. You cannot change this amount. Return data to getBars based on the following PeriodParams properties:
from— Unix timestamp of the leftmost requested bar. The library requires data in the[from, to)time range.to— Unix timestamp of the rightmost requested bar (not inclusive).countBack— the required amount of bars to load.
It is more important to pass the required number of bars than to match the [from, to) time range for the following reasons:
- The library might miscalculate the
fromvalue. It may happen if you provide incorrectsessionorsession_holidaysvalues. In this case, the[from, to)range does not represent the required number of bars. - The library calculates the correct
fromvalue, but your backend does not contain enough bars in the[from, to)range. It might happen if the market was opened, but the symbol was not traded.
In both cases, the library calls getBars multiple times in order to get the missing data. It might cause potential issues. To avoid them, consider the following recommendations:
- Your response should always include all the existing data for the requested range.
- If the number of bars in the requested range is less than the
countBackvalue, you should include earlier bars until thecountBackcount is reached. For example, the chart requests 300 bars in the range[2019-06-01T00:00:00..2020-01-01T00:00:00), and your backend have only 250 bars in the requested period. Return these 250 bars and 50 bars prior to2019-06-01T00:00:00. - In the unlikely case that the number of bars in the requested range is larger than the
countBackvalue, then you should return all the bars in that range instead of truncating it to thecountBacklength. - If there is no data left (in other words the current response to return an empty array, and there is no older data on the server), set
noDatatotrueto prevent further requests.
The library can request more bars than are visible because some indicators require additional history, for example, Moving Average with the length 10.
Previously, it was necessary to specify noData and nextTime to load data outside the requested range. For now, you can send this data in response to the current request. However, you can still use these properties if your datafeed supports only the from/to properties and requires another request from the library.
The following piece of code is just a snippet to begin with. You will have to change it to fit your requirements but copying & pasting the code below should render candles on the chart for a given symbol and nothing for all other symbols. It is also to illustrate the noData: true result.
resolveSymbol(symbolName, onSymbolResolvedCallback, onResolveErrorCallback, extension) {
    setTimeout(
        () => {
            // Return some simple symbol information for the TEST symbol
            if (symbolName === 'TEST') {
                onSymbolResolvedCallback({
                    "name": "TEST",
                    "timezone": "America/New_York",
                    "minmov": 1,
                    "minmov2": 0,
                    "pointvalue": 1,
                    "session": "24x7",
                    "has_intraday": false,
                    "visible_plots_set": "c",
                    "description": "Test Symbol",
                    "type": "stock",
                    "supported_resolutions": [
                        "D"
                    ],
                    "pricescale": 100,
                    "ticker": "TEST",
                    "exchange": "Test Exchange",
                    "has_daily": true,
                    "format": "price"
                });
            } else {
                // Ignore all other symbols
                onResolveErrorCallback('unknown_symbol');
            }
        },
        50
    );
}

getBars(symbolInfo, resolution, periodParams, onHistoryCallback, onErrorCallback) {
    setTimeout(
        () => {
            // For this piece of code only we will only return bars for the TEST symbol
            if (symbolInfo.ticker === 'TEST' && resolution === '1D') {
                // We are constructing an array for `countBack` bars.
                const bars = new Array(periodParams.countBack);

                // For constructing the bars we are starting from the `to` time minus 1 day, and working backwards until we have `countBack` bars.
                let time = new Date(periodParams.to * 1000);
                time.setUTCHours(0);
                time.setUTCMinutes(0);
                time.setUTCMilliseconds(0);
                time.setUTCDate(time.getUTCDate() - 1);

                // Fake price.
                let price = 100;

                for (let i = periodParams.countBack - 1; i > -1; i--) {
                    bars[i] = {
                        open: price,
                        high: price,
                        low: price,
                        close: price,
                        time: time.getTime(),
                    }

                    // Working out a random value for changing the fake price.
                    const volatility = 0.1;
                    const x = Math.random() - 0.5;
                    const changePercent = 2 * volatility * x;
                    const changeAmount = price * changePercent;
                    price = price + changeAmount;

                    // Note that this simple "-1 day" logic only works because the TEST symbol has a 24x7 session.
                    // For a more complex session we would need to, for example, skip weekends.
                    time.setUTCDate(time.getUTCDate() - 1);
                }

                // Once all the bars (usually countBack is around 300 bars) the array of candles is returned to the library.
                onHistoryCallback(bars);
            } else {
                // If no result, return an empty array and specify it to the library by changing the value of `noData` to true.
                onHistoryCallback([], {
                    noData: true
                });
            }
        },
        50
    );
}
}
subscribeBars
The library calls subscribeBars to receive real-time updates for a symbol. Call SubscribeBarsCallback every time you want to update the most recent bar or add a new one. For example, if the chart has loaded data up to 14:00, you can only update the last bar (14:00) or add a newer bar (15:00).
You cannot update a historical bar using this method. Otherwise, you get the putToCacheNewBar: time violation issue. If you need to change historical data, you should call onResetCacheNeededCallback and then chart.resetData() to redraw the chart.
If you return a bar that has the same time value as the most recent bar, the library replaces the most recent bar with the new one.
Consider the following example. The most recent bar (in pseudo-code) is {time: 1419411578413, open: 10, high: 12, low: 9, close: 11}.
You call onRealtimeCallback({time: 1419411578413, open: 10, high: 14, low: 9, close: 14}). As the bar with the time 1419411578413 already exists, and it is the most recent one, the library replaces the entire bar making the most recent bar {time: 1419411578413, open: 10, high: 14, low: 9, close: 14}.
Refer to the tutorial to see the example of subscribeBars implementation.
Multiple subscriptions
The library provides a unique subscriber ID as a parameter when it calls subscribeBars and unsubscribeBars. This subscriber ID allows you to track and manage subscriptions for symbol updates.
The library can have multiple subscriptions at the same time, for example, when a user switches to another symbol or resolution. You should handle subscribeBars and unsubscribeBars calls for different resolutions and symbols as independent events. Note that the library can call these methods in any order and with a delay.
When you receive an update from the server, you should send the data via the specific callback for the subscriber which has the correct symbol name and resolution.
If you send a subscriber data that does not match the subscriber's symbol and resolution, the putToCacheNewBar: time violation issue can occur.
Note that you should provide updates to all the subscriptions until the library unsubscribes from them. Therefore, you may require multiple connections to your backend server if you have multiple subscriptions.
Consider the following example. The current symbol is AAPL, and the resolution is 1D (one day). You switch the resolution to 5 (five minutes). The library separately calls subscribeBars to subscribe for five-minute updates and unsubscribeBars to unsubscribe from one-day updates (after a short delay). During this period, the library has at least two active subscribers: for five-minute and one-day updates. You should send five-minute updates to the five-minute subscriber and continue to send one-day updates to the one-day subscriber until the library unsubscribes from the 1D resolution.
Assume that the last bar (in pseudo-code) is:
{time: 1684368000000, open: 10, high: 12, low: 9, close: 11}on the one-day chart{time: 1684422300000, open: 10.5, high: 11.5, low: 10, close: 11}on the five-minute chart
If the price jumps to 13, you should send the following bars to the subscribers:
{time: 1684368000000, open: 10, high: 13, low: 9, close: 13}to the one-day subscriber{time: 1684422300000, open: 10.5, high: 13, low: 10, close: 13}to the five-minute subscriber
unsubscribeBars
The library calls unsubscribeBars to stop receiving updates for the symbol when the user selects another symbol on the chart. The listenerGuid argument contains the same object that was passed to subscribeBars before.
Refer to the tutorial to see the example of unsubscribeBars implementation.
getMarks
The library calls getMarks to request marks for the visible bar range. The library assumes that you call GetMarksCallback once per getMarks call. Pass an array of Mark objects as a callback parameter.
Only ten marks can be attached to a bar. The time of each mark must match the time of a bar. For example, if the bar times are 2023-01-01, 2023-01-08, and 2023-01-15, then a mark cannot have the time 2023-01-05.
This method is called only if your datafeed supports marks.
The code sample below demonstrates the example of getMarks implementation:
getMarks = (symbolInfo, startDate, endDate, onDataCallback, resolution) => {
    console.log('getMarks');

    onDataCallback(
        [
            {
                id: 1,
                time: endDate,
                color: 'red',
                text: ['This is the mark pop-up text.'],
                label: 'M',
                labelFontColor: 'blue',
                minSize: 25
            },
            {
                id: 2,
                time: endDate + 5260000, // 2 months
                color: 'red',
                text: ['Second marker'],
                label: 'S',
                labelFontColor: 'green',
                minSize: 25
            }
        ]);
};
getTimescaleMarks
The library calls getTimescaleMarks to request timescale marks for the visible bar range. The library assumes that you call GetMarksCallback once per getTimescaleMarks call. Pass an array of TimescaleMark objects as a callback parameter.
These method is called only if your datafeed supports marks.
The code sample below demonstrates the example of getTimescaleMarks implementation:
getTimescaleMarks = (
    symbolInfo,
    startDate,
    endDate,
    onDataCallback,
    resolution
) => {
    // optional
    console.log('getTimescaleMarks');

    let marks = [];

    if (symbolInfo.name === 'AAPL') {
        marks = [
            {
                id: 1,
                time: startDate,
                color: 'red',
                label: 'Aa',
                minSize: 30,
                tooltip: [
                    'Lorem',
                    'Ipsum',
                    'Dolor',
                    'Sit',
                ]
            },
            {
                id: 2,
                time: startDate + 5260000, // 2 months
                color: 'blue',
                label: 'B',
                minSize: 30,
                tooltip: [
                    'Amet',
                    'Consectetur',
                    'Adipiscing',
                    'Elit',
                ]
            }
        ];
    } else {
        marks = [
            {
                id: 'String id',
                time: endDate,
                color: 'red',
                label: 'T',
                tooltip: ['Nulla']
            }
        ];
    }

    onDataCallback(marks);
};
getServerTime
By default, the library gets the time from the user's machine. If the machine time is incorrect, the time used in the library is also incorrect.
To synchronize the library time with a server's time, enable the supports_time property and implement the getServerTime method.
In the implementation, send a request to a time server and return the accurate value to the library using the ServerTimeCallback.
The time value should be a Unix timestamp, for example, 1445324591.
Note that the callback should be called only once.
The library allows you to display the countdown to the bar closing on the price scale.
If you use this feature, consider implementing getServerTime to make sure that the countdown is correct.
To display a countdown, set the mainSeriesProperties.showCountdown property to true.
Note that the countdown can be displayed only for intraday resolutions.
getVolumeProfileResolutionForPeriod
The library calls getVolumeProfileResolutionForPeriod to request the resolution that is used to calculate the Volume Profile Visible Range indicator. Implement this method if you want to calculate the indicator more accurately. The implementation depends on how much data you can transfer to the library and the depth of data in your datafeed.
If this method is not specified, the library uses currentResolution.
Trading Platform methods
Trading Platform is a standalone client-side solution that provides trading capabilities. Users can manage orders, track positions, monitor their potential profits and losses, and more. Trading requires quote data that is used to display the Order Ticket, Legend, and widgets, such as Watchlist, Details, News, and Depth of Market (DOM).
Before connecting the Broker API, make sure that you implement the following methods:
If you want to implement the Depth of Market widget,
you should also implement subscribeDepth and unsubscribeDepth.
getQuotes
Trading Platform calls getQuotes to request quote data that is used to display the Watchlist, Details, Order Ticket, DOM widgets, and the legend.
To transfer the requested data, pass an array of QuoteData objects as a parameter to QuotesCallback. The library expects to receive necessary data in a single callback.
Note that if you integrate the library with mobile applications,
getQuotes is required to avoid NaN values appearing in the legend.
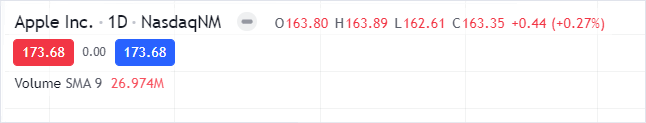
The example of QuoteData is demonstrated below:
{
    {
        "s": "ok",
        "n": "NasdaqNM:AAPL",
        "v": {
            "ch": 0,
            "chp": 0,
            "short_name": "AAPL",
            "exchange": "",
            "original_name": "NasdaqNM:AAPL",
            "description": "NasdaqNM:AAPL",
            "lp": 173.68,
            "ask": 173.68,
            "bid": 173.68,
            "open_price": 173.68,
            "high_price": 173.68,
            "low_price": 173.68,
            "prev_close_price": 172.77,
            "volume": 173.68
        }
    }
}
Note that Percentage change value, Ask/Bid buttons and lines also require quote data. They are not displayed on the chart if getQuotes is not implemented.
The following piece of code is just a snippet to begin with. You will have to change it to fit your requirements but copying & pasting the code below should enable displaying values in the Legend when on mobile along with values for ask and bid buttons (if activated within the Chart settings) when using Trading Platform. subscribeQuotes will however updates the values on regular basis.
// In this example we are returning random values (which probably don't make any sense from a trading purpose)
// but it is just to illustrate how to structure the function and returned object.
getQuotes(symbols, onDataCallback, onErrorCallback) {
    const data = [];

    symbols.forEach((symbol)=>{
        data.push({
            n: symbol,
            s: 'ok',
            v: {
                ch: Math.random() * (5 - 1) + 1,
                chp: Math.random() * (5 - 1) + 1,
                lp: Math.random() * (10 - 1) + 1,
                ask: Math.random() * (10 - 1) + 1,
                bid: Math.random() * (10 - 1) + 1,
                spread: 0.20,
                open_price: Math.random() * (5 - 1) + 1,
                high_price: Math.random() * (5 - 1) + 1,
                low_price: Math.random() * (5 - 1) + 1,
                prev_close_price: Math.random() * (5 - 1) + 1,
                original_name: symbol,
                volume: Math.random() * (5 - 1) + 1,
            },
        });
    });

    // To ensure the callback is only evoked when the library is ready - see Asynchronous callbacks
    setTimeout(() => onDataCallback(data), 0);
}
subscribeQuotes
The library calls subscribeQuotes to receive real-time quote updates for certain symbols. Call QuotesCallback every time you want to update the quotes and pass an array of QuoteData objects as a parameter.
The following piece of code is just a snippet to begin with. You will have to change it to fit your requirements but copying & pasting the code below should render different values in the Legend when on mobile along with values for ask and bid buttons (if activated within the Chart settings). unsubscribeQuotes will however updates the values on regular basis.
subscribeQuotes(symbols, fastSymbols, onRealtimeCallback, listenerGUID) {
    // In this example, `_quotesSubscriptions` is a global variable used to clear the subscription in `unsubscribeQuotes`
    this._quotesSubscriptions[listenerGUID] = setInterval(() => this.getQuotes(symbols.concat(fastSymbols), onRealtimeCallback, () => undefined), 5000);
}
unsubscribeQuotes
The library calls unsubscribeQuotes to stop receiving updates for the symbol when the user removes it from the Watchlist or selects another symbol on the chart. The listenerGuid argument contains the same object that was passed to subscribeQuotes before.
The following piece of code is just a snippet to begin with. You will have to change it to fit your requirements but copying & pasting the code below should stop updating the values created by subscribeQuotes.
unsubscribeQuotes(listenerGUID) {
    clearInterval(this._quotesSubscriptions[listenerGUID]);
}
subscribeDepth
The library calls subscribeDepth to receive real-time Level 2 (DOM) data for a symbol. Call DOMCallback every time you want to update the quotes and pass a DOMData object as a parameter.
Note that you should specify the broker_config property in the Widget Constructor and set supportLevel2Data to true. Otherwise, the library does not call the subscribeDepth/unsubscribeDepth methods.
This method should return a unique identifier (subscriberUID) that is used to unsubscribe from updates.
unsubscribeDepth
The library calls unsubscribeDepth to stop receiving DOM data updates. The subscriberUID argument contains the same object that was returned by subscribeDepth.
Sequence diagrams
In this section, you can find diagrams illustrating the sequence of Datafeed API method calls in Advanced Charts. Expand the sections below to view the diagrams for the following cases:
A user opens a chart for the first time.

A user switches to a new symbol or adds a new one to the chart.
