Other timeframes and data
- Introduction
- Common characteristics
- Data feeds
- `request.security()`
- `request.security_lower_tf()`
- Custom contexts
- Historical and realtime behavior
- `request.currency_rate()`
- `request.dividends()`, `request.splits()`, and `request.earnings()`
- `request.quandl()`
- `request.financial()`
- `request.economic()`
- `request.seed()`
Introduction
Pine Script™ allows users to request data from sources and contexts other than those their charts use. The functions we present on this page can fetch data from a variety of alternative sources:
- request.security() retrieves data from another symbol, timeframe, or other context.
- request.security_lower_tf() retrieves intrabar data, i.e., data from a timeframe lower than the chart timeframe.
- request.currency_rate() requests a daily rate to convert a value expressed in one currency to another.
- request.dividends(), request.splits(), and request.earnings() respectively retrieve information about an issuing company’s dividends, splits, and earnings.
- request.quandl() retrieves information from NASDAQ Data Link (formerly Quandl).
- request.financial() retrieves financial data from FactSet.
- request.economic() retrieves economic and industry data.
- request.seed() retrieves data from a user-maintained GitHub repository.
Note
Throughout this page, and in other parts of our documentation that discuss request.*() functions,
we often use the term “context” to describe the ticker ID, timeframe, and any modifications (price
adjustments, session settings, non-standard chart types, etc.) that apply to a chart or
the data retrieved by a script.
These are the signatures of the functions in the request.* namespace:
request.security(symbol, timeframe, expression, gaps, lookahead, ignore_invalid_symbol, currency) → series <type>

request.security_lower_tf(symbol, timeframe, expression, ignore_invalid_symbol, currency, ignore_invalid_timeframe) → array<type>

request.currency_rate(from, to, ignore_invalid_currency) → series float

request.dividends(ticker, field, gaps, lookahead, ignore_invalid_symbol, currency) → series float

request.splits(ticker, field, gaps, lookahead, ignore_invalid_symbol) → series float

request.earnings(ticker, field, gaps, lookahead, ignore_invalid_symbol, currency) → series float

request.quandl(ticker, gaps, index, ignore_invalid_symbol) → series float

request.financial(symbol, financial_id, period, gaps, ignore_invalid_symbol, currency) → series float

request.economic(country_code, field, gaps, ignore_invalid_symbol) → series float

request.seed(source, symbol, expression, ignore_invalid_symbol) → series <type>
The request.*() family of functions has numerous potential applications. Throughout this page, we will discuss in detail
these functions and some of their typical use cases.
Note
Users can also allow compatible scripts to evaluate their scopes in other contexts without requiring
request.*() functions by using the timeframe parameter of the
indicator() declaration statement.
Common characteristics
Many functions in the request.*() namespace share some common properties and parameters.
Before we explore each function in depth, let’s familiarize ourselves with these characteristics.
Usage
All request.*() functions return “series” results, which means they can produce different values on
every bar. However, most request.*() function parameters require “const”, “input”, or “simple” arguments.
In essence, Pine Script™ must determine the values of most arguments passed into a request.*() function
upon compilation of the script or on the first chart bar, depending on the qualified type
that each parameter accepts, and these values cannot change throughout the execution of the script.
The only exception is the expression parameter in
request.security(),
request.security_lower_tf(),
and request.seed(),
which accepts “series” arguments.
Calls to request.*() functions execute on every chart bar, and scripts cannot selectively deactivate them
throughout their execution. Scripts cannot call request.*() functions within the local scopes of
conditional structures, loops, or functions and
methods exported by Libraries, but they can use such
function calls within the bodies of non-exported user-defined functions and
methods.
When using any request.*() functions within a script, runtime performance is an important consideration.
These functions can have a sizable impact on script performance. While scripts can contain a maximum of 40
calls to the request.*() namespace, users should strive to minimize the number of calls in their scripts
to keep resource consumption as low as possible. For more information on the limitations of these functions, see
this section of our User Manual’s page on Pine’s limitations.
`gaps`
When using a request.*() function to retrieve data from another context, the data may not come in on each
new bar as it would with the current chart. The gaps parameter of a request.*() function allows
users to control how the function responds to nonexistent values in the requested series.
Note
When using the indicator() function
to evaluate a script in another context, the timeframe_gaps parameter specifies how it handles nonexistent
values. The parameter is similar to the gaps parameter for request.*() functions.
Suppose we have a script that requests hourly data for the chart’s symbol with
request.security() executing on
an 1-minute chart. In this case, the function call will only return new values on the 1-minute bars that cover the
opening/closing times of the symbol’s hourly bars. On other chart bars, we can decide whether the function will
return na values or the last available values
via the gaps parameter.
When the gaps parameter uses barmerge.gaps_on,
the function will return na results on all chart bars
where new data isn’t yet confirmed from the requested context. Otherwise, when the parameter uses
barmerge.gaps_off, the function
will fill the gaps in the requested data with the last confirmed values on historical bars and the most recent developing
values on realtime bars.
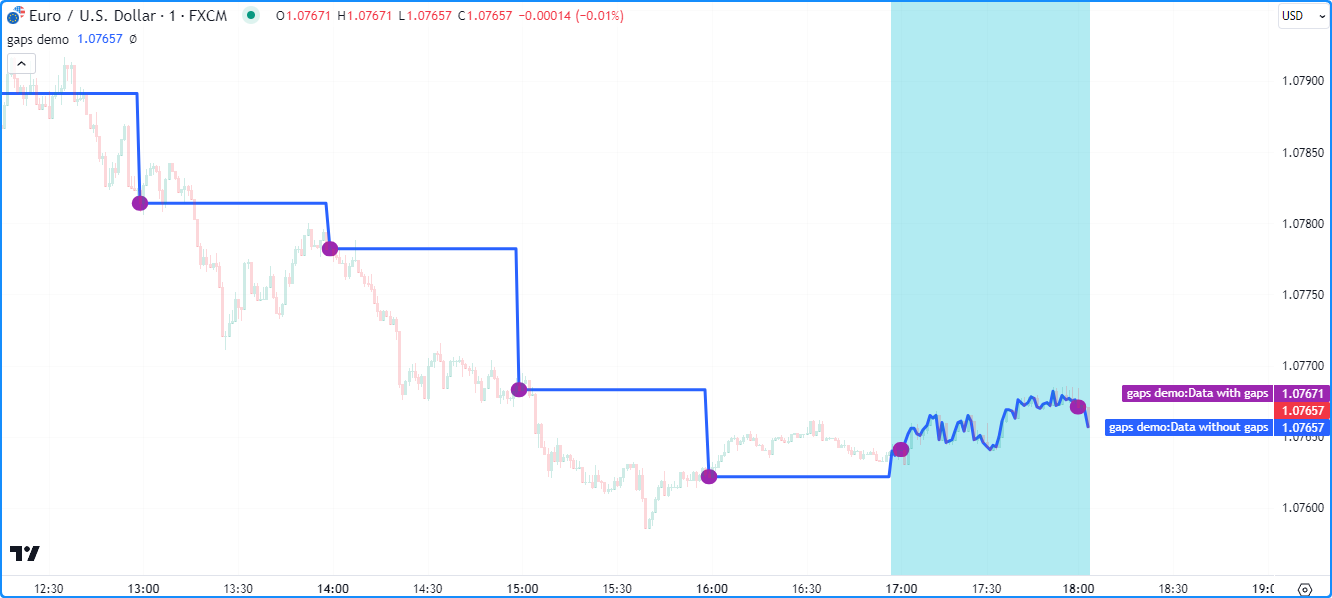
The script below demonstrates the difference in behavior by plotting the results from two
request.security() calls that
fetch the close price of the current symbol
from the hourly timeframe on a 1-minute chart. The first call uses gaps = barmerge.gaps_off and the second
uses gaps = barmerge.gaps_on:
//@version=5
indicator("gaps demo", overlay = true)

//@variable The `close` requested from the hourly timeframe without gaps.
float dataWithoutGaps = request.security(syminfo.tickerid, "60", close, gaps = barmerge.gaps_off)
//@variable The `close` requested from the hourly timeframe with gaps.
float dataWithGaps = request.security(syminfo.tickerid, "60", close, gaps = barmerge.gaps_on)

// Plot the requested data.
plot(dataWithoutGaps, "Data without gaps", color.blue, 3, plot.style_linebr)
plot(dataWithGaps, "Data with gaps", color.purple, 15, plot.style_linebr)

// Highlight the background for realtime bars.
bgcolor(barstate.isrealtime ? color.new(color.aqua, 70) : na, title = "Realtime bar highlight")
- Note that:
- barmerge.gaps_off
is the default value for the
gapsparameter in all applicablerequest.*()functions. - The script plots the requested series as lines with breaks (plot.style_linebr), which don’t bridge over na values as the default style (plot.style_line) does.
- When using barmerge.gaps_off, the request.security() function returns the last confirmed close from the hourly timeframe on all historical bars. When running on realtime bars (the bars with the color.aqua background in this example), it returns the symbol’s current close value, regardless of confirmation. For more information, see the Historical and realtime behavior section of this page.
- barmerge.gaps_off
is the default value for the
`ignore_invalid_symbol`
The ignore_invalid_symbol parameter of request.*() functions determines how a function will handle
invalid data requests, e.g.:
- Using a
request.*()function with a nonexistent ticker ID as thesymbol/tickerparameter. - Using request.financial()
to retrieve information that does not exist for the specified
symbolorperiod. - Using request.economic()
to request a
fieldthat doesn’t exist for acountry_code.
A request.*() function call will produce a runtime error and halt the execution of the script when making
an erroneous request if its ignore_invalid_symbol parameter is false. When this parameter’s value is
true, the function will return na values
in such a case instead of raising an error.
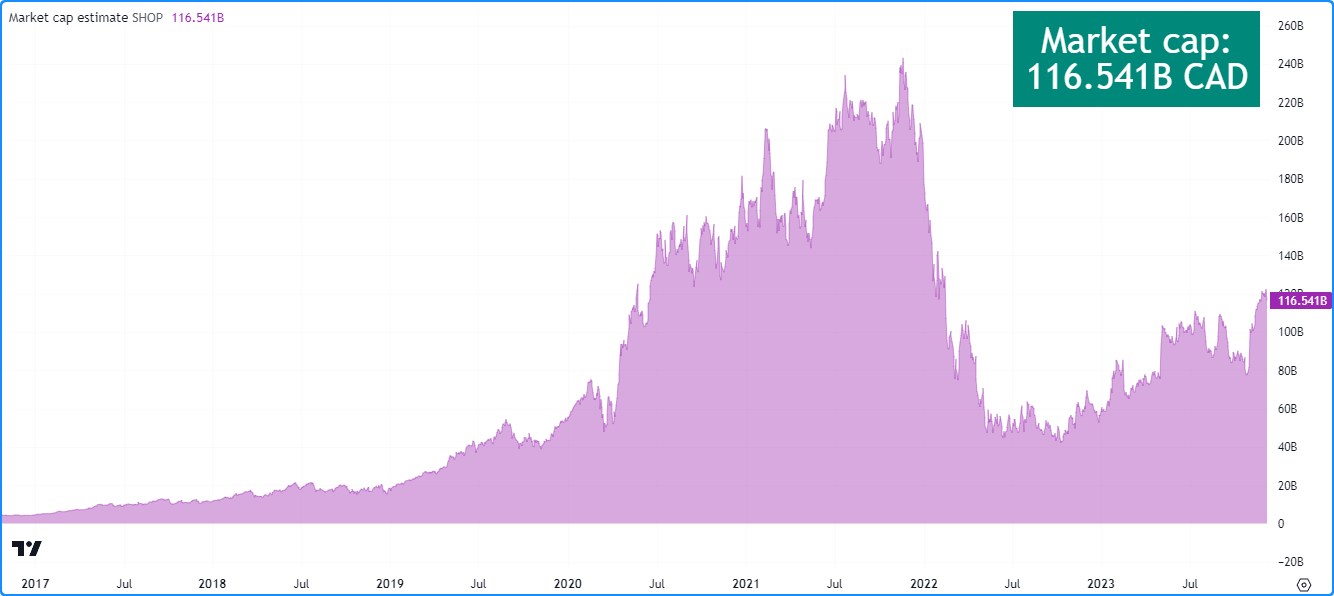
This example uses request.*() calls within a user-defined function to
retrieve data for estimating an instrument’s market capitalization (market cap). The user-defined calcMarketCap()
function calls request.financial()
to retrieve the total shares outstanding for a symbol and
request.security() to retrieve a tuple
containing the symbol’s close price and
currency. We’ve included
ignore_invalid_symbol = true in both of these request.*() calls to prevent runtime errors for invalid requests.
The script displays a formatted string
representing the symbol’s estimated market cap value and currency in a
table on the chart and uses a
plot to visualize the marketCap history:
//@version=5
indicator("ignore_invalid_symbol demo", "Market cap estimate", format = format.volume)

//@variable The symbol to request data from.
string symbol = input.symbol("TSX:SHOP", "Symbol")

//@function Estimates the market capitalization of the specified `tickerID` if the data exists.
calcMarketCap(simple string tickerID) =>
    //@variable The quarterly total shares outstanding for the `tickerID`. Returns `na` when the data isn't available.
    float tso = request.financial(tickerID, "TOTAL_SHARES_OUTSTANDING", "FQ", ignore_invalid_symbol = true)
    //@variable The `close` price and currency for the `tickerID`. Returns `[na, na]` when the `tickerID` is invalid.
    [price, currency] = request.security(
         tickerID, timeframe.period, [close, syminfo.currency], ignore_invalid_symbol = true
     )
    // Return a tuple containing the market cap estimate and the quote currency.
    [tso * price, currency]

//@variable A `table` object with a single cell that displays the `marketCap` and `quoteCurrency`.
var table infoTable = table.new(position.top_right, 1, 1)
// Initialize the table's cell on the first bar.
if barstate.isfirst
    table.cell(infoTable, 0, 0, "", text_color = color.white, text_size = size.huge, bgcolor = color.teal)

// Get the market cap estimate and quote currency for the `symbol`.
[marketCap, quoteCurrency] = calcMarketCap(symbol)

//@variable The formatted text displayed inside the `infoTable`.
string tableText = str.format("Market cap:\n{0} {1}", str.tostring(marketCap, format.volume), quoteCurrency)
// Update the `infoTable`.
table.cell_set_text(infoTable, 0, 0, tableText)

// Plot the `marketCap` value.
plot(marketCap, "Market cap", color.new(color.purple, 60), style = plot.style_area)
- Note that:
- The
calcMarketCap()function will only return values on valid instruments with total shares outstanding data, such as the one we’ve selected for this example. It will return a market cap value of na on others that don’t have financial data, including forex, crypto, and derivatives. - Not all issuing companies publish quarterly financial reports. If the
symbol’s issuing company doesn’t report on a quarterly basis, change the “FQ” value in this script to the company’s minimum reporting period. See the request.financial() section for more information. - We’ve used format.volume in the
indicator() and
str.tostring() calls, which specify that
the y-axis of the chart pane represents volume-formatted values and the “string” representation of the
marketCapvalue shows as volume-formatted text. - This script creates a table and initializes its cell on the first chart bar, then updates the cell’s text on subsequent bars. To learn more about working with tables, see the Tables page of our User Manual.
- The
`currency`
The currency parameter of a request.*() function allows users to specify the currency of the requested data.
When this parameter’s value differs from the syminfo.currency
of the requested context, the function will convert the requested values to express them in the specified currency.
This parameter can accept a built-in variable from the currency.* namespace, such as
currency.JPY, or a “string” representing the
ISO 4217 currency code (e.g., “JPY”).
The conversion rate between the syminfo.currency
of the requested data and the specified currency depends on the corresponding “FX_IDC” daily rate from the previous day.
If no available instrument provides the conversion rate directly, the function will use the value from a
spread symbol to derive the rate.
Note
Not all request.*() function calls return values expressed as a currency amount. Therefore, currency conversion is not
always necessary. For example, some series returned by
request.financial() are expressed in units
other than currency, such as the “PIOTROSKI_F_SCORE” and “NUMBER_OF_EMPLOYEES” metrics. It is up to programmers to determine
when currency conversion is appropriate in their data requests.
`lookahead`
The lookahead parameter in request.security(),
request.dividends(),
request.splits(), and
request.earnings() specifies the lookahead behavior
of the function call. Its default value is barmerge.lookahead_off.
When requesting data from a higher-timeframe (HTF) context, the lookahead value determines whether the function can request
values from times beyond those of the historical bars it executes on. In other words, the lookahead value determines whether
the requested data may contain lookahead bias on historical bars.
When requesting data from a lower-timeframe (LTF) context, the lookahead parameter determines whether the function requests
values from the first or last intrabar (LTF bar) on each chart bar.
Programmers should exercise extreme caution when using lookahead in their scripts, namely when requesting data from higher timeframes.
When using barmerge.lookahead_on as the lookahead
value, ensure that it does not compromise the integrity of the script’s logic by leaking future data into historical chart bars.
The following scenarios are cases where enabling lookahead is acceptable in a request.*() call:
- The
expressionin request.security() references a series with a historical offset (e.g.,close[1]), which prevents the function from requesting future values that it would not have access to on a realtime basis. - The specified
timeframein the call is the same as the chart the script executes on, i.e., timeframe.period. - The function call requests data from an intrabar timeframe, i.e., a timeframe smaller than the timeframe.period. See this section for more information.
Note
Using request.security() to leak future data into the past is misleading and not allowed in script publications. While your script’s results on historical bars may look great due to its seemingly “magical” acquisition of prescience (which it will not be able to reproduce on realtime bars), you will be misleading yourself and the users of your script. If you publish your script to share it with others, ensure you do not mislead users by accessing future information on historical bars.
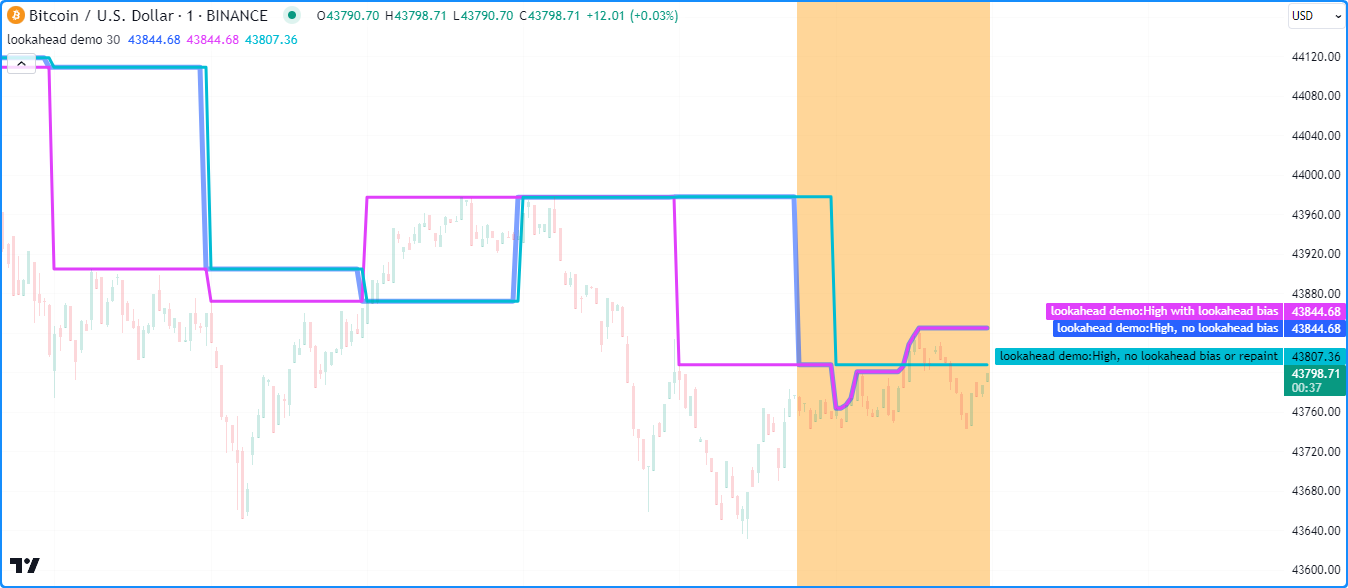
This example demonstrates how the lookahead parameter affects the behavior of higher-timeframe data requests and why enabling
lookahead in request.security() without offsetting
the expression is misleading. The script calls request.security()
to get the HTF high price for the current chart’s symbol in
three different ways and plots the resulting series on the chart for comparison.
The first call uses barmerge.lookahead_off
(default), and the others use barmerge.lookahead_on.
However, the third request.security() call also
offsets its expression using the history-referencing operator []
to avoid leaking future data into the past.
As we see on the chart, the plot of the series requested using barmerge.lookahead_on without an offset (fuchsia line) shows final HTF high prices before they’re actually available on historical bars, whereas the other two calls do not:
//@version=5
indicator("lookahead demo", overlay = true)

//@variable The timeframe to request the data from.
string timeframe = input.timeframe("30", "Timeframe")

//@variable The requested `high` price from the current symbol on the `timeframe` without lookahead bias.
//          On realtime bars, it returns the current `high` of the `timeframe`.
float lookaheadOff = request.security(syminfo.tickerid, timeframe, high, lookahead = barmerge.lookahead_off)

//@variable The requested `high` price from the current symbol on the `timeframe` with lookahead bias.
//          Returns values that should NOT be accessible yet on historical bars.
float lookaheadOn = request.security(syminfo.tickerid, timeframe, high, lookahead = barmerge.lookahead_on)

//@variable The requested `high` price from the current symbol on the `timeframe` without lookahead bias or repainting.
//          Behaves the same on historical and realtime bars.
float lookaheadOnOffset = request.security(syminfo.tickerid, timeframe, high[1], lookahead = barmerge.lookahead_on)

// Plot the values.
plot(lookaheadOff, "High, no lookahead bias", color.new(color.blue, 40), 5)
plot(lookaheadOn, "High with lookahead bias", color.fuchsia, 3)
plot(lookaheadOnOffset, "High, no lookahead bias or repaint", color.aqua, 3)
// Highlight the background on realtime bars.
bgcolor(barstate.isrealtime ? color.new(color.orange, 60) : na, title = "Realtime bar highlight")
- Note that:
- The series requested using barmerge.lookahead_off has a new historical value at the end of each HTF period, and both series requested using barmerge.lookahead_on have new historical data at the start of each period.
- On realtime bars, the plot of the series without lookahead (blue) and the series with lookahead and no historical offset (fuchsia) show the same value (i.e., the HTF period’s unconfirmed high price), as no data exists beyond those points to leak into the past. Both of these plots will repaint their results after restarting the script’s execution, as realtime bars will become historical bars.
- The series that uses lookahead and a historical offset (aqua) does not repaint its values, as it always references the last confirmed value from the higher timeframe. See the Avoiding repainting section of this page for more information.
Note
In Pine Script™ v1 and v2, the security() function did not include a lookahead parameter, but it behaved as
it does in later versions of Pine with lookahead = barmerge.lookahead_on, meaning that it systematically used data
from the future HTF context on historical bars. Therefore, users should exercise caution with Pine v1 or v2 scripts
that use HTF security() calls unless the function calls contain historical offsets.
Data feeds
TradingView’s data providers supply different data feeds that scripts can access to retrieve information about an instrument, including:
- Intraday historical data (for timeframes < 1D)
- End-of-day (EOD) historical data (for timeframes >= 1D)
- Realtime data (which may be delayed, depending on your account type and extra data services)
- Extended hours data
Not all of these data feed types exist for every instrument. For example, the symbol “BNC:BLX” only has EOD data available.
For some instruments with intraday and EOD historical feeds, volume data may not be the same since some trades (block trades, OTC trades, etc.) may only be available at the end of the trading day. Consequently, the EOD feed will include this volume data, but the intraday feed will not. Differences between EOD and intraday volume feeds are almost nonexistent for instruments such as cryptocurrencies, but they are commonplace in stocks.
Slight price discrepancies may also occur between EOD and intraday feeds. For example, the high value on one EOD bar may not match any intraday high values supplied by the data provider for that day.
Another distinction between EOD and intraday data feeds is that EOD feeds do not contain information from extended hours.
When retrieving information on realtime bars with request.*() functions, it’s important to note that historical and
realtime data reported for an instrument often rely on different data feeds. A broker/exchange may retroactively modify
values reported on realtime bars, which the data will only reflect after refreshing the chart or restarting the execution
of the script.
Another important consideration is that the chart’s data feeds and feeds requested from providers by the script are managed by independent, concurrent processes. Consequently, in some rare cases, it’s possible for races to occur where requested results temporarily fall out of synch with the chart on a realtime bar, which a script retroactively adjusts after restarting its execution.
These points may account for variations in the values retrieved by request.*() functions when requesting data from other
contexts. They may also result in discrepancies between data received on realtime bars and historical bars. There are no
steadfast rules about the variations one may encounter in their requested data feeds.
Note
As a rule, TradingView does not generate data; it relies on its data providers for the information displayed on charts and accessed by scripts.
When using data feeds requested from other contexts, it’s also crucial to consider the time axis differences between the
chart the script executes on and the requested feeds since request.*() functions adapt the returned series to the chart’s
time axis. For example, requesting “BTCUSD” data on the “SPY” chart with
request.security() will only show new values
when the “SPY” chart has new data as well. Since “SPY” is not a 24-hour symbol, the “BTCUSD” data returned will contain gaps
that are otherwise not present when viewing its chart directly.
`request.security()`
The request.security() function allows scripts to request data from other contexts than the chart the script executes on, such as:
- Other symbols, including spread symbols
- Other timeframes (see our User Manual’s page on Timeframes to learn about timeframe specifications in Pine Script™)
- Custom contexts, including alternative sessions, price adjustments, chart types, etc.
using
ticker.*()functions
This is the function’s signature:
request.security(symbol, timeframe, expression, gaps, lookahead, ignore_invalid_symbol, currency) → series <type>
The symbol value is the ticker identifier representing the symbol to fetch data from. This parameter accepts
values in any of the following formats:
- A “string” representing a symbol (e.g., “IBM” or “EURUSD”) or an “Exchange:Symbol” pair (e.g., “NYSE:IBM” or “OANDA:EURUSD”). When the value does not contain an exchange prefix, the function selects the exchange automatically. We recommend specifying the exchange prefix when possible for consistent results. Users can also pass an empty string to this parameter, which prompts the function to use the current chart’s symbol.
- A “string” representing a spread symbol (e.g., “AMD/INTC”). Note that “Bar Replay” mode does not work with these symbols.
- The syminfo.ticker or
syminfo.tickerid built-in variables,
which return the symbol or the “Exchange:Symbol” pair that the current chart references. We recommend using
syminfo.tickerid to avoid ambiguity
unless the exchange information does not matter in the data request. For more information on
syminfo.*variables, see this section of our Chart information page. - A custom ticker identifier created using
ticker.*()functions. Ticker IDs constructed from these functions may contain additional settings for requesting data using non-standard chart calculations, alternative sessions, and other contexts. See the Custom contexts section for more information.
The timeframe value specifies the timeframe of the requested data. This parameter accepts “string” values in our
timeframe specification format (e.g., a value of “1D” represents
the daily timeframe). To request data from the same timeframe as the chart the script executes on, use the
timeframe.period variable or an empty string.
The expression parameter of the request.security()
function determines the data it retrieves from the specified context. This versatile parameter accepts “series” values of
int, float, bool,
color, string, and
chart.point types. It can also accept tuples,
collections, user-defined types,
and the outputs of function and method calls. For more details on the data one can retrieve,
see the Requestable data section below.
Note
When using the value from an input.source()
call in the expression argument and the input references a series from another indicator, request.*() functions
calculate that value’s results using the chart’s symbol, regardless of the symbol argument supplied,
since they cannot evaluate the scopes required by an external series. We therefore do not recommend attempting to request
external source input data from other contexts.
Timeframes
The request.security() function can request
data from any available timeframe, regardless of the chart the script executes on. The timeframe of the data retrieved
depends on the timeframe argument in the function call, which may represent a higher timeframe (e.g., using “1D”
as the timeframe value while running the script on an intraday chart) or the chart’s timeframe (i.e., using
timeframe.period or an empty string as the
timeframe argument).
Scripts can also request limited data from lower timeframes with
request.security() (e.g., using “1” as the
timeframe argument while running the script on a 60-minute chart). However, we don’t typically recommend using this
function for LTF data requests. The request.security_lower_tf()
function is more optimal for such cases.
Higher timeframes
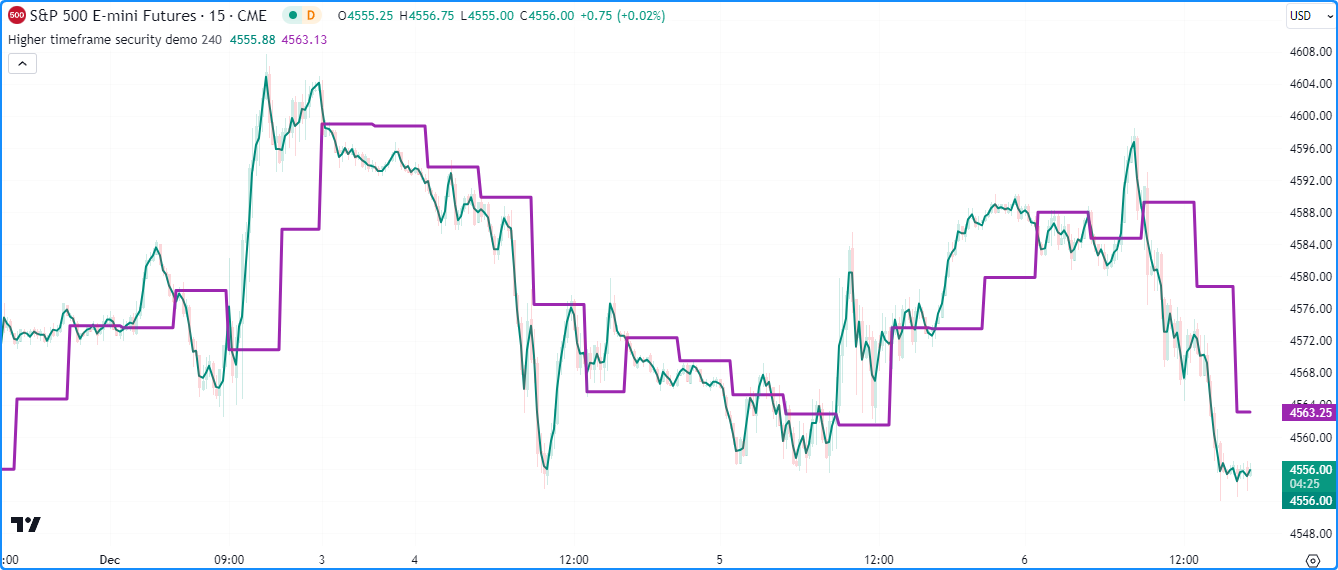
Most use cases of request.security() involve
requesting data from a timeframe higher than or the same as the chart timeframe. For example, this script retrieves the
hl2 price from a requested higherTimeframe.
It plots the resulting series on the chart alongside the current chart’s
hl2 for comparison:
//@version=5
indicator("Higher timeframe security demo", overlay = true)

//@variable The higher timeframe to request data from.
string higherTimeframe = input.timeframe("240", "Higher timeframe")

//@variable The `hl2` value from the `higherTimeframe`. Combines lookahead with an offset to avoid repainting.
float htfPrice = request.security(syminfo.tickerid, higherTimeframe, hl2[1], lookahead = barmerge.lookahead_on)

// Plot the `hl2` from the chart timeframe and the `higherTimeframe`.
plot(hl2, "Current timeframe HL2", color.teal, 2)
plot(htfPrice, "Higher timeframe HL2", color.purple, 3)
- Note that:
- We’ve included an offset to the
expressionargument and used barmerge.lookahead_on in request.security() to ensure the series returned behaves the same on historical and realtime bars. See the Avoiding repainting section for more information.
- We’ve included an offset to the
Notice that in the above example, it is possible to select a higherTimeframe value that actually represents a lower timeframe
than the one the chart uses, as the code does not prevent it. When designing a script to work specifically with higher timeframes,
we recommend including conditions to prevent it from accessing lower timeframes, especially if you intend to
publish it.
Below, we’ve added an if structure to our previous example
that raises a runtime error when the
higherTimeframe input represents a timeframe smaller than the chart timeframe, effectively preventing the script from
requesting LTF data:
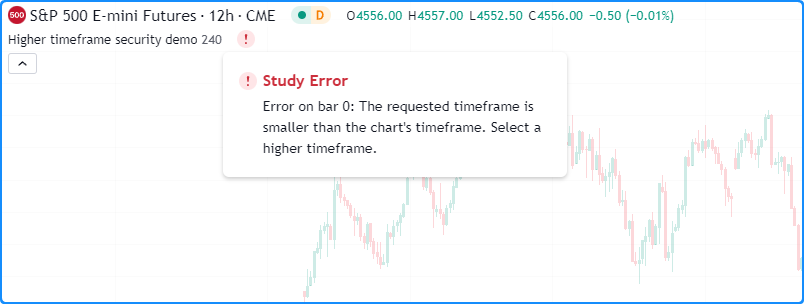
//@version=5
indicator("Higher timeframe security demo", overlay = true)

//@variable The higher timeframe to request data from.
string higherTimeframe = input.timeframe("240", "Higher timeframe")

// Raise a runtime error when the `higherTimeframe` is smaller than the chart's timeframe.
if timeframe.in_seconds() > timeframe.in_seconds(higherTimeframe)
    runtime.error("The requested timeframe is smaller than the chart's timeframe. Select a higher timeframe.")

//@variable The `hl2` value from the `higherTimeframe`. Combines lookahead with an offset to avoid repainting.
float htfPrice = request.security(syminfo.tickerid, higherTimeframe, hl2[1], lookahead = barmerge.lookahead_on)

// Plot the `hl2` from the chart timeframe and the `higherTimeframe`.
plot(hl2, "Current timeframe HL2", color.teal, 2)
plot(htfPrice, "Higher timeframe HL2", color.purple, 3)
Lower timeframes
Although the request.security()
function is intended to operate on timeframes greater than or equal to the chart timeframe, it can request data
from lower timeframes as well, with limitations. When calling this function to access a lower timeframe,
it will evaluate the expression from the LTF context. However, it can only return the results from a single
intrabar (LTF bar) on each chart bar.
The intrabar that the function returns data from on each historical chart bar depends on the lookahead value
in the function call. When using barmerge.lookahead_on,
it will return the first available intrabar from the chart period. When using
barmerge.lookahead_off,
it will return the last intrabar from the chart period. On realtime bars, it returns the last available value
of the expression from the timeframe, regardless of the lookahead value, as the realtime intrabar information
retrieved by the function is not yet sorted.
This script retrieves close data from the valid
timeframe closest to a fourth of the size of the chart timeframe. It makes two calls to
request.security() with
different lookahead values. The first call uses
barmerge.lookahead_on to access the
first intrabar value in each chart bar. The second uses the default lookahead value
(barmerge.lookahead_off), which
requests the last intrabar value assigned to each chart bar. The script plots the outputs of both
calls on the chart to compare the difference:

//@version=5
indicator("Lower timeframe security demo", overlay = true)

//@variable The valid timeframe closest to 1/4 the size of the chart timeframe.
string lowerTimeframe = timeframe.from_seconds(int(timeframe.in_seconds() / 4))

//@variable The `close` value on the `lowerTimeframe`. Represents the first intrabar value on each chart bar.
float firstLTFClose = request.security(syminfo.tickerid, lowerTimeframe, close, lookahead = barmerge.lookahead_on)
//@variable The `close` value on the `lowerTimeframe`. Represents the last intrabar value on each chart bar.
float lastLTFClose = request.security(syminfo.tickerid, lowerTimeframe, close)

// Plot the values.
plot(firstLTFClose, "First intrabar close", color.teal, 3)
plot(lastLTFClose, "Last intrabar close", color.purple, 3)
// Highlight the background on realtime bars.
bgcolor(barstate.isrealtime ? color.new(color.orange, 70) : na, title = "Realtime background highlight")
- Note that:
- The script determines the value of the
lowerTimeframeby calculating the number of seconds in the chart timeframe with timeframe.in_seconds(), then dividing by four and converting the result to a valid timeframe string via timeframe.from_seconds(). - The plot of the series without lookahead (purple) aligns with the close value on the chart timeframe, as this is the last intrabar value in the chart bar.
- Both request.security() calls return the same value (the current close) on each realtime bar, as shown on the bars with the orange background.
- Scripts can retrieve up to 100,000 intrabars from a lower-timeframe context. See this section of the Limitations page.
- The script determines the value of the
Note
While scripts can use request.security() to retrieve the values from a single intrabar on each chart bar, which might provide utility in some unique cases, we recommend using the request.security_lower_tf() function for intrabar analysis when possible, as it returns an array containing data from all available intrabars within a chart bar. See this section to learn more.
Requestable data
The request.security() function is quite
versatile, as it can retrieve values of any fundamental type (int, float,
bool, color, or string).
It can also request the IDs of data structures and built-in or user-defined types
that reference fundamental types. The data this function requests depends on its expression parameter, which accepts
any of the following arguments:
- Built-in variables and function calls
- Variables calculated by the script
- Tuples
- Calls to user-defined functions
- Chart points
- Collections
- User-defined types
Note
The request.security() function
duplicates the scopes and operations required by the expression to calculate its requested values in another context,
which elevates runtime memory consumption. Additionally, the extra scopes produced by each call to
request.security() count toward the script’s
compilation limits. See the Scope count section of the
Limitations page for more information.
Built-in variables and functions
A frequent use case of request.security() is requesting the output of a built-in variable or function/method call from another symbol or timeframe.
For example, suppose we want to calculate the 20-bar SMA of a symbol’s ohlc4 price from the daily timeframe while on an intraday chart. We can accomplish this with a single line of code:
float ma = request.security(syminfo.tickerid, "1D", ta.sma(ohlc4, 20))
The above line calculates the value of ta.sma(ohlc4, 20) on the current symbol from the daily timeframe.
It’s important to note that newcomers to Pine may sometimes confuse the above line of code as being equivalent to the following:
float ma = ta.sma(request.security(syminfo.tickerid, "1D", ohlc4), 20)
However, this line will return an entirely different result. Rather than requesting a 20-bar SMA from the daily timeframe, it requests the ohlc4 price from the daily timeframe and calclates the ta.sma() of the results over 20 chart bars.
In essence, when the intention is to request the results of an expression from other contexts, pass the expression
directly to the expression parameter in the request.security()
call, as demonstrated in the initial example.
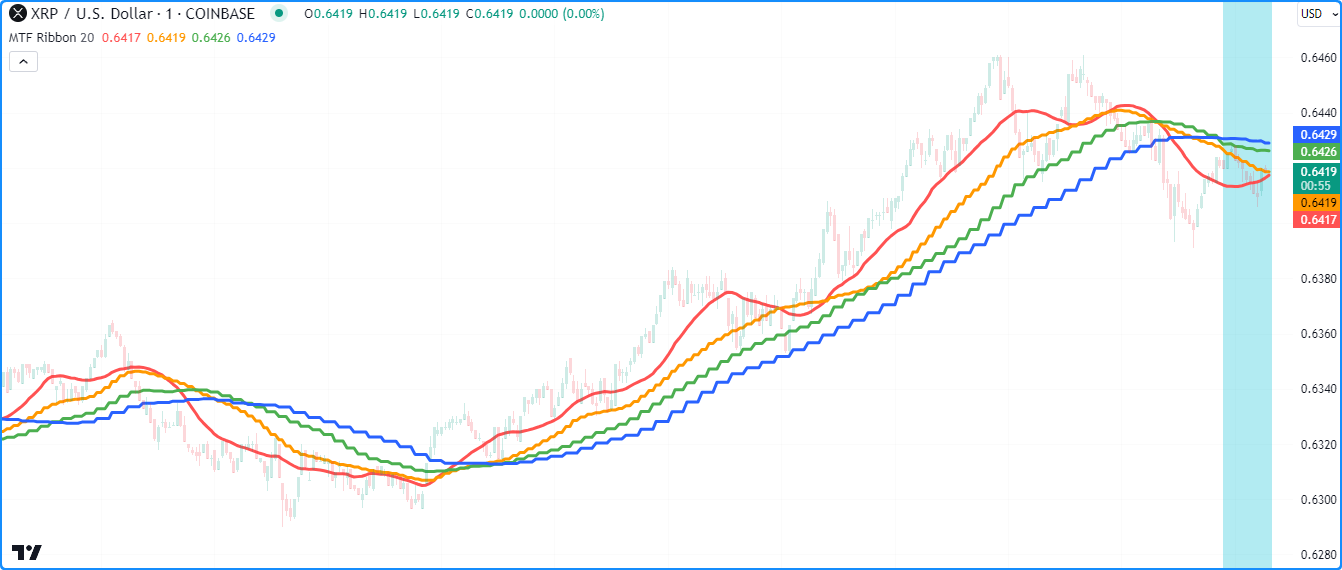
Let’s expand on this concept. The script below calculates a multi-timeframe (MTF) ribbon of moving averages,
where each moving average in the ribbon calculates over the same number of bars on its respective timeframe.
Each request.security() call uses
ta.sma(close, length) as its expression argument
to return a length-bar SMA from the specified timeframe:
//@version=5
indicator("Requesting built-ins demo", "MTF Ribbon", true)

//@variable The length of each moving average.
int length = input.int(20, "Length", 1)

//@variable The number of seconds in the chart timeframe.
int chartSeconds = timeframe.in_seconds()

// Calculate the higher timeframes closest to 2, 3, and 4 times the size of the chart timeframe.
string htf1 = timeframe.from_seconds(chartSeconds * 2)
string htf2 = timeframe.from_seconds(chartSeconds * 3)
string htf3 = timeframe.from_seconds(chartSeconds * 4)

// Calculate the `length`-bar moving averages from each timeframe.
float chartAvg = ta.sma(ohlc4, length)
float htfAvg1  = request.security(syminfo.tickerid, htf1, ta.sma(ohlc4, length))
float htfAvg2  = request.security(syminfo.tickerid, htf2, ta.sma(ohlc4, length))
float htfAvg3  = request.security(syminfo.tickerid, htf3, ta.sma(ohlc4, length))

// Plot the results.
plot(chartAvg, "Chart timeframe SMA", color.red, 3)
plot(htfAvg1, "Double timeframe SMA", color.orange, 3)
plot(htfAvg2, "Triple timeframe SMA", color.green, 3)
plot(htfAvg3, "Quadruple timeframe SMA", color.blue, 3)

// Highlight the background on realtime bars.
bgcolor(barstate.isrealtime ? color.new(color.aqua, 70) : na, title = "Realtime highlight")
- Note that:
- The script calculates the ribbon’s higher timeframes by multiplying the chart’s timeframe.in_seconds() value by 2, 3, and 4, then converting each result into a valid timeframe string using timeframe.from_seconds().
- Instead of calling ta.sma() within each
request.security() call, one
could use the
chartAvgvariable as theexpressionin each call to achieve the same result. See the next section for more information. - On realtime bars, this script also tracks unconfirmed SMA values from each higher timeframe. See the Historical and realtime behavior section to learn more.
Calculated variables
The expression parameter of request.security()
accepts variables declared in the global scope, allowing scripts to evaluate their variables’ calculations from other
contexts without redundantly listing the operations in each function call.
For example, one can declare the following variable:
priceReturn = (close - close[1]) / close[1]
and execute the variable’s calculation from another context with request.security():
requestedReturn = request.security(symbol, timeframe.period, priceReturn)
The function call in the line above will return the result of the priceReturn calculation on another symbol’s
data as a series adapted to the current chart, which the script can display directly on the chart or utilize in
additional operations.
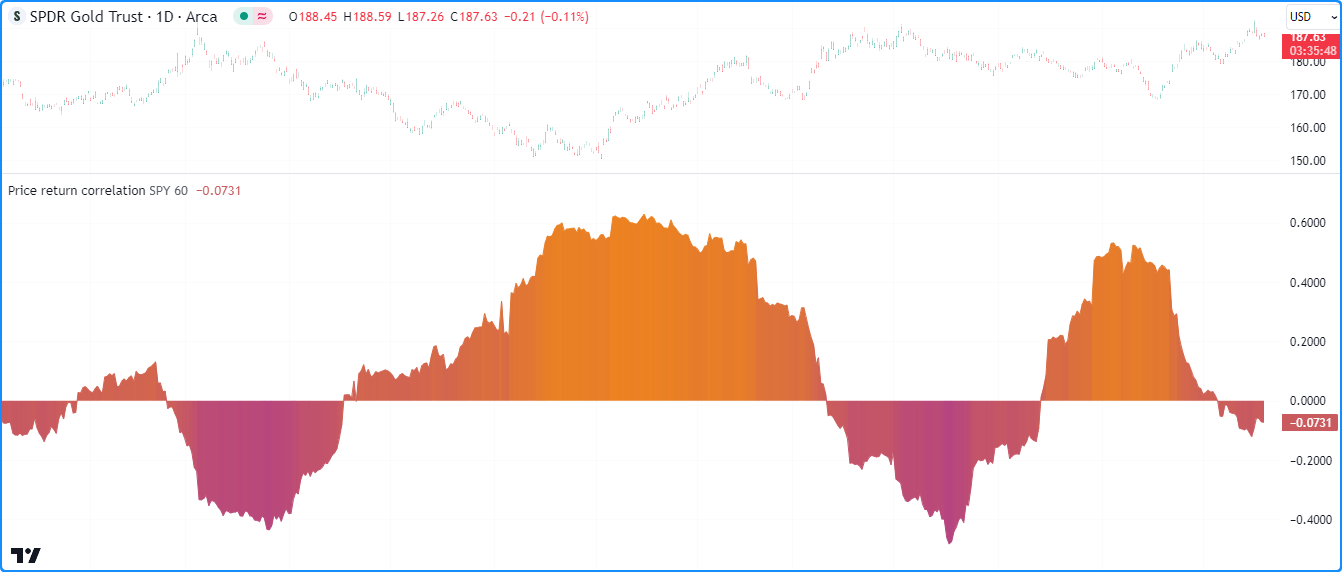
The following example compares the price returns of the current chart’s symbol and another specified symbol.
The script declares the priceReturn variable from the chart’s context, then uses that variable in
request.security() to evaluate
its calculation on another symbol. It then calculates the
correlation between the
priceReturn and requestedReturn and plots the result on the chart:
//@version=5
indicator("Requesting calculated variables demo", "Price return correlation")

//@variable The symbol to compare to the chart symbol.
string symbol = input.symbol("SPY", "Symbol to compare")
//@variable The number of bars in the calculation window.
int length = input.int(60, "Length", 1)

//@variable The close-to-close price return.
float priceReturn = (close - close[1]) / close[1]
//@variable The close-to-close price return calculated on another `symbol`.
float requestedReturn = request.security(symbol, timeframe.period, priceReturn)

//@variable The correlation between the `priceReturn` and `requestedReturn` over `length` bars.
float correlation = ta.correlation(priceReturn, requestedReturn, length)
//@variable The color of the correlation plot.
color plotColor = color.from_gradient(correlation, -1, 1, color.purple, color.orange)

// Plot the correlation value.
plot(correlation, "Correlation", plotColor, style = plot.style_area)
- Note that:
- The request.security()
call executes the same calculation used in the
priceReturndeclaration, except it uses the close values fetched from the inputsymbol. - The script colors the plot with a gradient
based on the
correlationvalue. To learn more about color gradients in Pine, see this section of our User Manual’s page on colors.
- The request.security()
call executes the same calculation used in the
Tuples
Tuples in Pine Script™ are comma-separated sets of expressions enclosed in brackets that can hold multiple values of any available type. We use tuples when creating functions or other local blocks that return more than one value.
The request.security() function
can accept a tuple as its expression argument, allowing scripts to request multiple series of different types
using a single function call. The expressions within requested tuples can be of any type outlined throughout the
Requestable data section of this page,
excluding other tuples.
Note
The combined size of all tuples returned by request.*() calls in a
script cannot exceed 127 elements. See this section of the
Limitations page for more information.
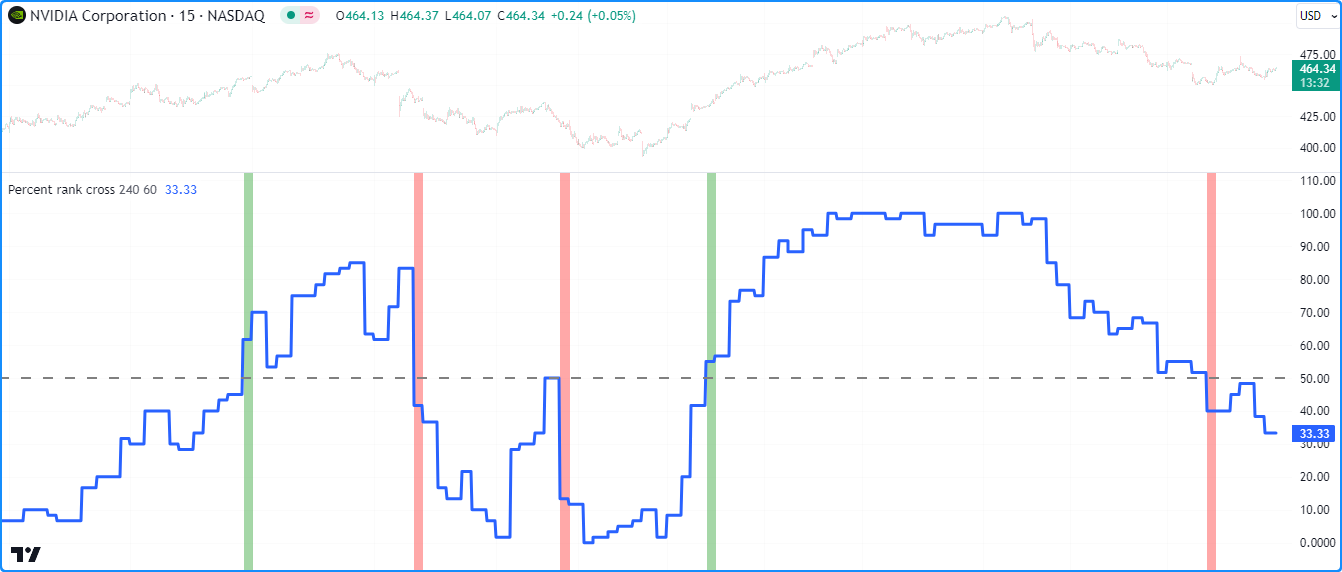
Tuples are particularly handy when a script needs to retrieve more than one value from a specific context.
For example, this script calculates the percent rank
of the close price over length bars and
assigns the expression to the rank variable. It then calls
request.security() to request a tuple
containing the rank, ta.crossover(rank, 50),
and ta.crossunder(rank, 50) values from
the specified timeframe. The script plots the requestedRank and uses the crossOver
and crossUnder “bool” values within bgcolor()
to conditionally highlight the chart pane’s background:
//@version=5
indicator("Requesting tuples demo", "Percent rank cross")

//@variable The timeframe of the request.
string timeframe = input.timeframe("240", "Timeframe")
//@variable The number of bars in the calculation.
int length = input.int(20, "Length")

//@variable The previous bar's percent rank of the `close` price over `length` bars.
float rank = ta.percentrank(close, length)[1]

// Request the `rank` value from another `timeframe`, and two "bool" values indicating the `rank` from the `timeframe`
// crossed over or under 50.
[requestedRank, crossOver, crossUnder] = request.security(
     syminfo.tickerid, timeframe, [rank, ta.crossover(rank, 50), ta.crossunder(rank, 50)],
     lookahead = barmerge.lookahead_on
 )

// Plot the `requestedRank` and create a horizontal line at 50.
plot(requestedRank, "Percent Rank", linewidth = 3)
hline(50, "Cross line", linewidth = 2)
// Highlight the background of all bars where the `timeframe`'s `crossOver` or `crossUnder` value is `true`.
bgcolor(crossOver ? color.new(color.green, 50) : crossUnder ? color.new(color.red, 50) : na)
- Note that:
- We’ve offset the
rankvariable’s expression by one bar using the history-referencing operator [] and included barmerge.lookahead_on in the request.security() call to ensure the values on realtime bars do not repaint after becoming historical bars. See the Avoiding repainting section for more information. - The request.security() call
returns a tuple, so we use a tuple declaration to declare the
requestedRank,crossOver, andcrossUndervariables. To learn more about using tuples, see this section of our User Manual’s Type system page.
- We’ve offset the
User-defined functions
User-defined functions and methods are custom functions
written by users. They allow users to define sequences of operations associated with an identifier that scripts
can conveniently call throughout their execution (e.g., myUDF()).
The request.security() function can request the results of user-defined functions and methods whose scopes consist of any types outlined throughout this page’s Requestable data section.
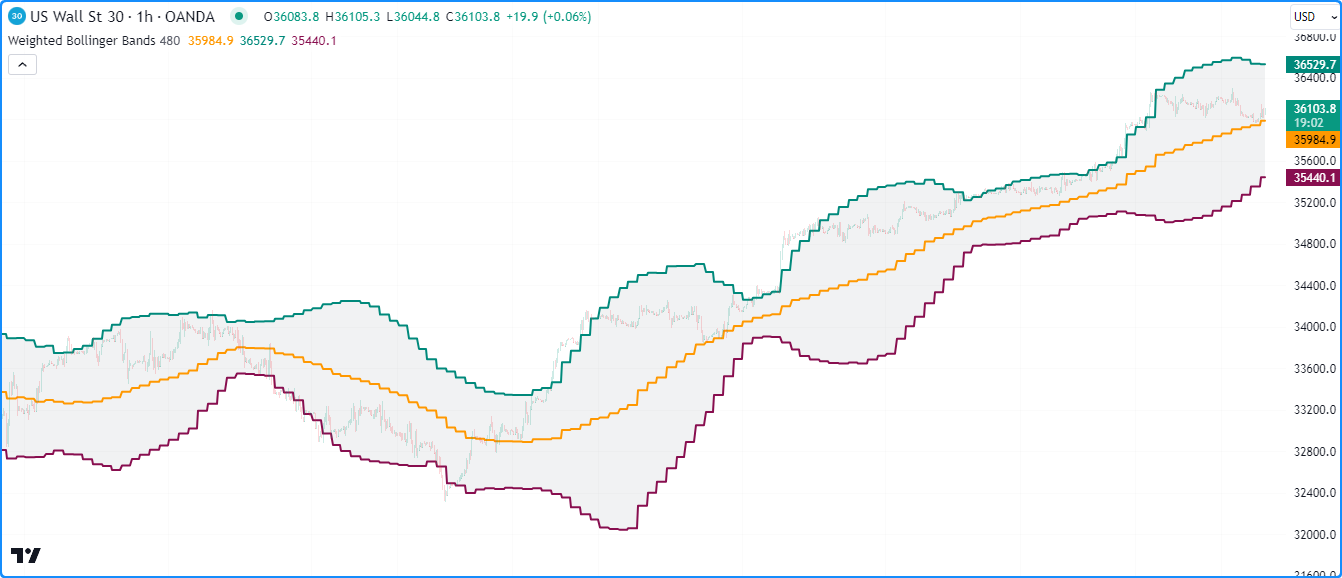
For example, this script contains a user-defined weightedBB() function that calculates Bollinger Bands with the basis
average weighted by a specified weight series. The function returns a tuple of custom
band values. The script calls the weightedBB() as the expression argument in
request.security() to retrieve a
tuple of band values calculated on the specified
timeframe and plots the results on the chart:
//@version=5
indicator("Requesting user-defined functions demo", "Weighted Bollinger Bands", true)

//@variable The timeframe of the request.
string timeframe = input.timeframe("480", "Timeframe")

//@function     Calculates Bollinger Bands with a custom weighted basis.
//@param source The series of values to process.
//@param length The number of bars in the calculation.
//@param mult   The standard deviation multiplier.
//@param weight The series of weights corresponding to each `source` value.
//@returns      A tuple containing the basis, upper band, and lower band respectively.
weightedBB(float source, int length, float mult = 2.0, float weight = 1.0) =>
    //@variable The basis of the bands.
    float ma = math.sum(source * weight, length) / math.sum(weight, length)
    //@variable The standard deviation from the `ma`.
    float dev = 0.0
    // Loop to accumulate squared error.
    for i = 0 to length - 1
        difference = source[i] - ma
        dev += difference * difference
    // Divide `dev` by the `length`, take the square root, and multiply by the `mult`.
    dev := math.sqrt(dev / length) * mult
    // Return the bands.
    [ma, ma + dev, ma - dev]

// Request weighted bands calculated on the chart symbol's prices over 20 bars from the
// last confirmed bar on the `timeframe`.
[basis, highBand, lowBand] = request.security(
     syminfo.tickerid, timeframe, weightedBB(close[1], 20, 2.0, (high - low)[1]), lookahead = barmerge.lookahead_on
 )

// Plot the values.
basisPlot = plot(basis, "Basis", color.orange, 2)
upperPlot = plot(highBand, "Upper", color.teal, 2)
lowerPlot = plot(lowBand, "Lower", color.maroon, 2)
fill(upperPlot, lowerPlot, color.new(color.gray, 90), "Background")
- Note that:
- We offset the
sourceandweightarguments in theweightedBB()call used as theexpressionin request.security() and used barmerge.lookahead_on to ensure the requested results reflect the last confirmed values from thetimeframeon realtime bars. See this section to learn more.
- We offset the
Chart points
Chart points are reference types that represent coordinates on the chart. Lines, boxes, polylines, and labels use chart.point objects to set their display locations.
The request.security() function can use
the ID of a chart.point instance in its expression
argument, allowing scripts to retrieve chart coordinates from other contexts.
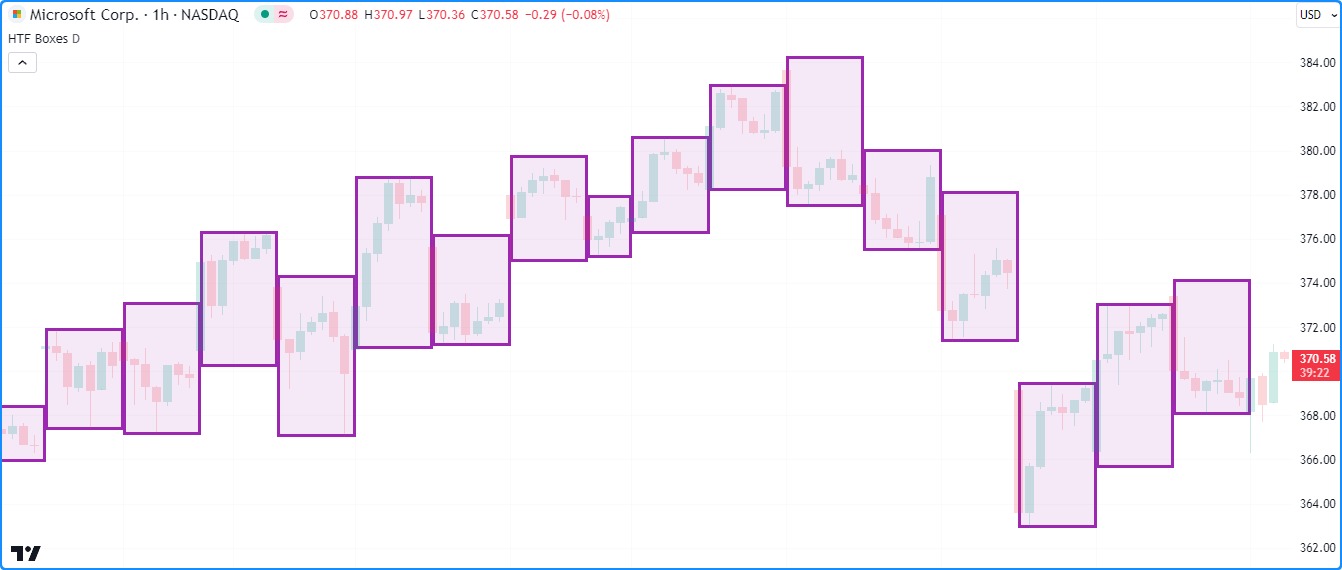
The example below requests a tuple of historical chart points from a higher timeframe
and uses them to draw boxes on the chart. The script declares the topLeft and
bottomRight variables that reference chart.point
IDs from the last confirmed bar. It then uses
request.security() to request a
tuple containing the IDs of
chart points representing the topLeft and bottomRight from a higherTimeframe.
When a new bar starts on the higherTimeframe, the script draws a
new box using the time and price coordinates
from the requestedTopLeft and requestedBottomRight chart points:
//@version=5
indicator("Requesting chart points demo", "HTF Boxes", true, max_boxes_count = 500)

//@variable The timeframe to request data from.
string higherTimeframe = input.timeframe("1D", "Timeframe")

// Raise a runtime error if the `higherTimeframe` is smaller than the chart's timeframe.
if timeframe.in_seconds(higherTimeframe) < timeframe.in_seconds(timeframe.period)
    runtime.error("The selected timeframe is too small. Choose a higher timeframe.")

//@variable A `chart.point` containing top-left coordinates from the last confirmed bar.
topLeft = chart.point.now(high)[1]
//@variable A `chart.point` containing bottom-right coordinates from the last confirmed bar.
bottomRight = chart.point.from_time(time_close, low)[1]

// Request the last confirmed `topLeft` and `bottomRight` chart points from the `higherTimeframe`.
[requestedTopLeft, requestedBottomRight] = request.security(
     syminfo.tickerid, higherTimeframe, [topLeft, bottomRight], lookahead = barmerge.lookahead_on
 )

// Draw a new box when a new `higherTimeframe` bar starts.
// The box uses the `time` fields from the `requestedTopLeft` and `requestedBottomRight` as x-coordinates.
if timeframe.change(higherTimeframe)
    box.new(
         requestedTopLeft, requestedBottomRight, color.purple, 3,
         xloc = xloc.bar_time, bgcolor = color.new(color.purple, 90)
     )
- Note that:
- Since this example is designed specifically for higher timeframes, we’ve included a custom
runtime error that the script
raises when the timeframe.in_seconds()
of the
higherTimeframeis smaller than that of the chart’s timeframe.
- Since this example is designed specifically for higher timeframes, we’ve included a custom
runtime error that the script
raises when the timeframe.in_seconds()
of the
Collections
Pine Script™ collections (arrays, matrices, and maps) are data structures that contain an arbitrary number of elements with specified types. The request.security() function can retrieve the IDs of collections whose elements consist of:
- Fundamental types
- Chart points
- User-defined types that satisfy the criteria listed in the section below
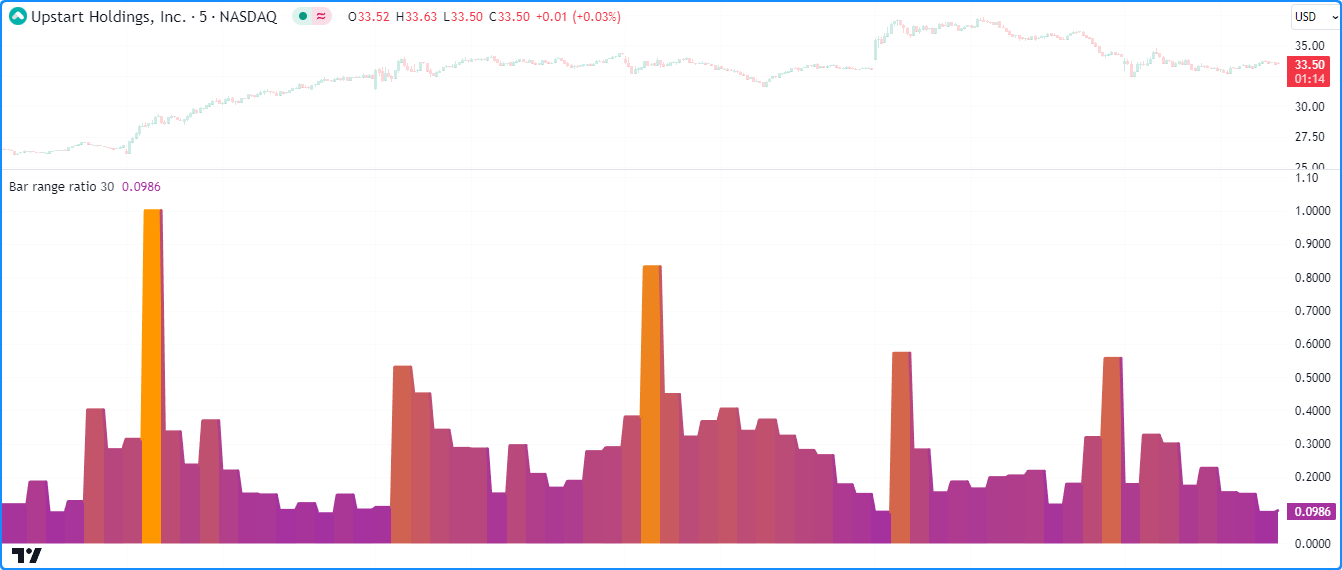
This example calculates the ratio of a confirmed bar’s high-low range to the range between the
highest and
lowest values over 10 bars
from a specified symbol and timeframe. It uses maps to hold the values used
in the calculations.
The script creates a data map with “string” keys and “float” values to hold
high,
low,
highest, and
lowest price values on each bar,
which it uses as the expression in request.security()
to calculate an otherData map representing the data from the specified context. It uses the values
associated with the “High”, “Low”, “Highest”, and “Lowest” keys of the otherData map to calculate the
ratio that it plots in the chart pane:
//@version=5
indicator("Requesting collections demo", "Bar range ratio")

//@variable The ticker ID to request data from.
string symbol = input.symbol("", "Symbol")
//@variable The timeframe of the request.
string timeframe = input.timeframe("30", "Timeframe")

//@variable A map with "string" keys and "float" values.
var map<string, float> data = map.new<string, float>()

// Put key-value pairs into the `data` map.
map.put(data, "High", high)
map.put(data, "Low", low)
map.put(data, "Highest", ta.highest(10))
map.put(data, "Lowest", ta.lowest(10))

//@variable A new `map` whose data is calculated from the last confirmed bar of the requested context.
map<string, float> otherData = request.security(symbol, timeframe, data[1], lookahead = barmerge.lookahead_on)

//@variable The ratio of the context's bar range to the max range over 10 bars. Returns `na` if no data is available.
float ratio = na
if not na(otherData)
    ratio := (otherData.get("High") - otherData.get("Low")) / (otherData.get("Highest") - otherData.get("Lowest"))

//@variable A gradient color for the plot of the `ratio`.
color ratioColor = color.from_gradient(ratio, 0, 1, color.purple, color.orange)

// Plot the `ratio`.
plot(ratio, "Range Ratio", ratioColor, 3, plot.style_area)
User-defined types
User-defined types (UDTs) are composite types containing an arbitrary number of fields, which can be of any available type, including other user-defined types.
The request.security() function can retrieve the IDs of objects produced by UDTs from other contexts if their fields consist of:
- Fundamental types
- Chart points
- Collections that satisfy the criteria listed in the section above
- Other UDTs whose fields consist of any of these types
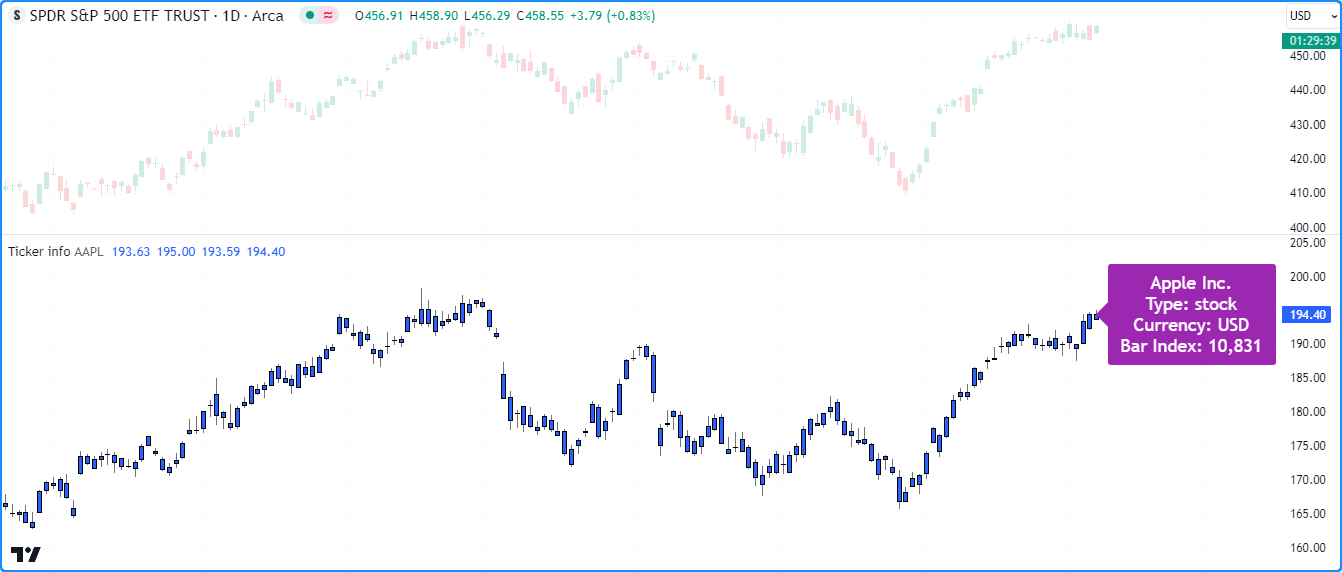
The following example requests an object ID using a specified symbol and
displays its field values on a chart pane.
The script contains a TickerInfo UDT with “string” fields for syminfo.* values, an
array field to store recent “float” price data,
and an “int” field to hold the requested ticker’s bar_index
value. It assigns a new TickerInfo ID to an info variable on every bar and uses the variable as the expression in
request.security() to retrieve the ID of an
object representing the calculated info from the specified symbol.
The script displays the requestedInfo object’s description, tickerType, currency, and barIndex values in a
label and uses
plotcandle() to display the values
from its prices array:
//@version=5
indicator("Requesting user-defined types demo", "Ticker info")

//@variable The symbol to request information from.
string symbol = input.symbol("NASDAQ:AAPL", "Symbol")

//@type               A custom type containing information about a ticker.
//@field description  The symbol's description.
//@field tickerType   The type of ticker.
//@field currency     The symbol's currency.
//@field prices       An array of the symbol's current prices.
//@field barIndex     The ticker's `bar_index`.
type TickerInfo
    string       description
    string       tickerType
    string       currency
    array<float> prices
    int          barIndex

//@variable A `TickerInfo` object containing current data.
info = TickerInfo.new(
     syminfo.description, syminfo.type, syminfo.currency, array.from(open, high, low, close), bar_index
 )
//@variable The `info` requested from the specified `symbol`.
TickerInfo requestedInfo = request.security(symbol, timeframe.period, info)
// Assign a new `TickerInfo` instance to `requestedInfo` if one wasn't retrieved.
if na(requestedInfo)
    requestedInfo := TickerInfo.new(prices = array.new<float>(4))

//@variable A label displaying information from the `requestedInfo` object.
var infoLabel = label.new(
     na, na, "", color = color.purple, style = label.style_label_left, textcolor = color.white, size = size.large
 )
//@variable The text to display inside the `infoLabel`.
string infoText = na(requestedInfo) ? "" : str.format(
     "{0}\nType: {1}\nCurrency: {2}\nBar Index: {3}",
     requestedInfo.description, requestedInfo.tickerType, requestedInfo.currency, requestedInfo.barIndex
 )

// Set the `point` and `text` of the `infoLabel`.
label.set_point(infoLabel, chart.point.now(array.last(requestedInfo.prices)))
label.set_text(infoLabel, infoText)
// Plot candles using the values from the `prices` array of the `requestedInfo`.
plotcandle(
     requestedInfo.prices.get(0), requestedInfo.prices.get(1), requestedInfo.prices.get(2), requestedInfo.prices.get(3),
     "Requested Prices"
 )
- Note that:
- The
syminfo.*variables used in this script all return “simple string” qualified types. However, objects in Pine are always qualified as “series”. Consequently, all values assigned to theinfoobject’s fields automatically adopt the “series” qualifier. - It is possible for the request.security()
call to return na due to differences between
the data requested from the
symboland the main chart. This script assigns a newTickerInfoobject to therequestedInfoin that case to prevent runtime errors.
- The
`request.security_lower_tf()`
The request.security_lower_tf() function is an alternative to request.security() designed for reliably requesting information from lower-timeframe (LTF) contexts.
While request.security() can retrieve data from a single intrabar (LTF bar) in each chart bar, request.security_lower_tf() retrieves data from all available intrabars in each chart bar, which the script can access and use in additional calculations. Each request.security_lower_tf() call can retrieve up to 100,000 intrabars from a lower timeframe. See this section of our Limitations page for more information.
Note
Working with request.security_lower_tf() involves frequent usage of arrays since it always returns array results. We therefore recommend you familiarize yourself with arrays to make the most of this function in your scripts.
Below is the function’s signature, which is similar to request.security():
request.security_lower_tf(symbol, timeframe, expression, ignore_invalid_symbol, currency, ignore_invalid_timeframe) → array<type>
This function only requests data from timeframes less than or equal to the chart’s timeframe. If the timeframe
of the request represents a higher timeframe than the chart’s timeframe,
the function will either raise a runtime error or return na values
depending on the ignore_invalid_timeframe argument in the call. The default value for this parameter is false, meaning it will
raise an error and halt the script’s execution when attempting to request HTF data.
Requesting intrabar data
Intrabar data can provide a script with additional information that may not be obvious or accessible from solely analyzing data sampled on the chart’s timerframe. The request.security_lower_tf() function can retrieve many data types from an intrabar context.
Before you venture further in this section, we recommend exploring the
Requestable data portion of the
request.security() section above, which provides foundational information
about the types of data one can request. The expression parameter in
request.security_lower_tf()
accepts most of the same arguments discussed in that section, excluding direct references to collections
and mutable variables declared in the script’s main scope. Although it accepts many of the same types of arguments,
this function returns array results,
which comes with some differences in interpretation and handling, as explained below.
Note
As with request.security(),
request.security_lower_tf()
duplicates the scopes and operations required to calculate the expression from another context. The scopes from
request.security_lower_tf()
increase runtime memory consumption and count toward the script’s compilation limits.
See the Scope count section of the
Limitations page to learn more.
Intrabar data arrays
Lower timeframes contain more data points than higher timeframes, as new values come in at a higher frequency. For example, when comparing a 1-minute chart to an hourly chart, the 1-minute chart will have up to 60 times the number of bars per hour, depending on the available data.
To address the fact that multiple intrabars exist within a chart bar,
request.security_lower_tf()
always returns its results as arrays. The elements in the returned arrays
represent the expression values retrieved from the lower timeframe sorted in ascending order based on each intrabar’s timestamp.
The type template assigned to the returned arrays corresponds
to the value types passed in the request.security_lower_tf()
call. For example, using an “int” as the expression will produce an array<int> instance, a “bool” as the expression
will produce an array<bool> instance, etc.
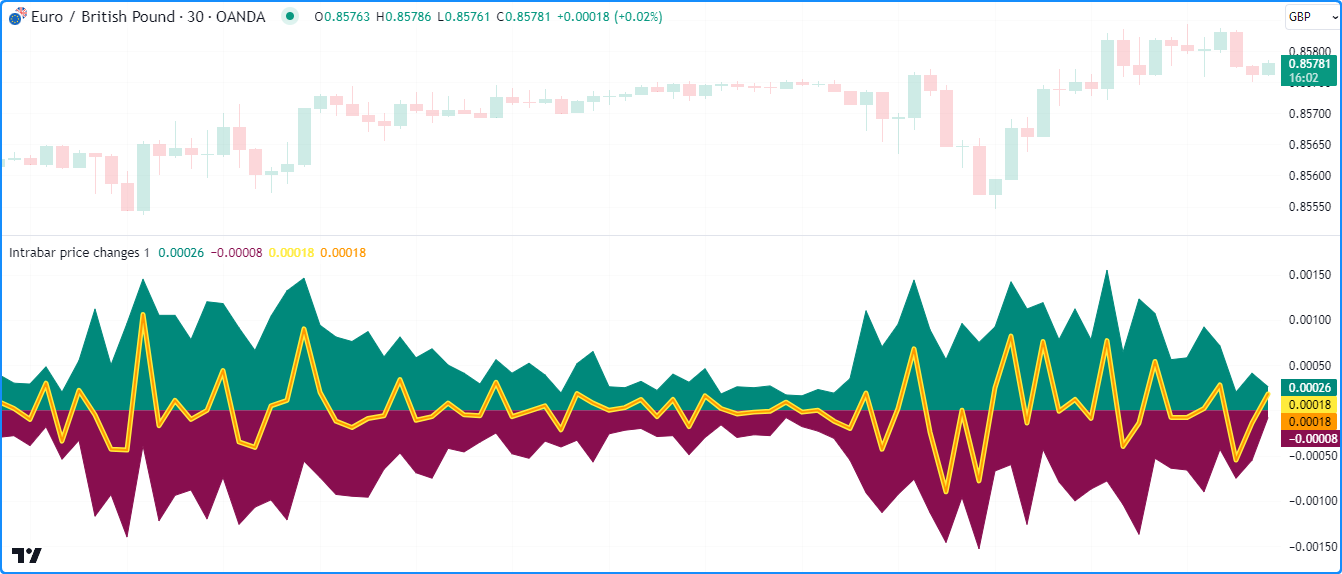
The following script uses intrabar information to decompose the chart’s close-to-close price changes into positive
and negative parts. It calls request.security_lower_tf()
to fetch a “float” array of
ta.change(close) values from the
lowerTimeframe on each chart bar, then accesses all the array’s elements using a
for…in loop to accumulate positiveChange
and negativeChange sums. The script adds the accumulated values to calculate the netChange, then
plots the results on the chart alongside the priceChange for comparison:
//@version=5
indicator("Intrabar arrays demo", "Intrabar price changes")

//@variable The lower timeframe of the requested data.
string lowerTimeframe = input.timeframe("1", "Timeframe")

//@variable The close-to-close price change.
float priceChange = ta.change(close)

//@variable An array of `close` values from available intrabars on the `lowerTimeframe`.
array<float> intrabarChanges = request.security_lower_tf(syminfo.tickerid, lowerTimeframe, priceChange)

//@variable The total positive intrabar `close` movement on the chart bar.
float positiveChange = 0.0
//@variable The total negative intrabar `close` movement on the chart bar.
float negativeChange = 0.0

// Loop to calculate totals, starting from the chart bar's first available intrabar.
for change in intrabarChanges
    // Add the `change` to `positiveChange` if its sign is 1, and add to `negativeChange` if its sign is -1.
    switch math.sign(change)
        1  => positiveChange += change
        -1 => negativeChange += change

//@variable The sum of `positiveChange` and `negativeChange`. Equals the `priceChange` on bars with available intrabars.
float netChange = positiveChange + negativeChange

// Plot the `positiveChange`, `negativeChange`, and `netChange`.
plot(positiveChange, "Positive intrabar change", color.teal, style = plot.style_area)
plot(negativeChange, "Negative intrabar change", color.maroon, style = plot.style_area)
plot(netChange, "Net intrabar change", color.yellow, 5)
// Plot the `priceChange` to compare.
plot(priceChange, "Chart price change", color.orange, 2)
- Note that:
- The plots based on intrabar data may not appear on all available chart bars, as request.security_lower_tf() can only access up to the most recent 100,000 intrabars available from the requested context. When executing this function on a chart bar that doesn’t have accessible intrabar data, it will return an empty array.
- The number of intrabars per chart bar may vary depending on the data available from the context and the chart the script executes on. For example, a provider’s 1-minute data feed may not include data for every minute within the 60-minute timeframe due to a lack of trading activity over some 1-minute intervals. To check the number of intrabars retrieved for a chart bar, one can use array.size() on the resulting array.
- If the
lowerTimeframevalue is greater than the chart’s timeframe, the script will raise a runtime error, as we have not supplied anignore_invalid_timeframeargument in the request.security_lower_tf() call.
Tuples of intrabar data
When passing a tuple or a function call that returns a tuple as the expression argument in
request.security_lower_tf(),
the result is a tuple of arrays with type templates
corresponding to the types within the argument. For example, using a [float, string, color] tuple as the
expression will result in [array<float>, array<string>, array<color>] data returned by the function.
Using a tuple expression allows a script to fetch several arrays of intrabar data with
a single request.security_lower_tf()
function call.
Note
The combined size of all tuples returned by request.*() calls in a script is limited to 127 elements.
See this section of the Limitations
page for more information.
The following example requests OHLC data from a lower timeframe and visualizes the current bar’s intrabars on
the chart using lines and boxes. The script calls
request.security_lower_tf()
with the [open, high, low, close] tuple as its expression to retrieve a tuple of arrays
representing OHLC information from a calculated lowerTimeframe. It then uses a
for loop to set line coordinates with the retrieved
data and current bar indices to display the results next to the current chart bar, providing a “magnified view” of the
price movement within the latest candle. It also draws a box
around the lines to indicate the chart region occupied by intrabar drawings:
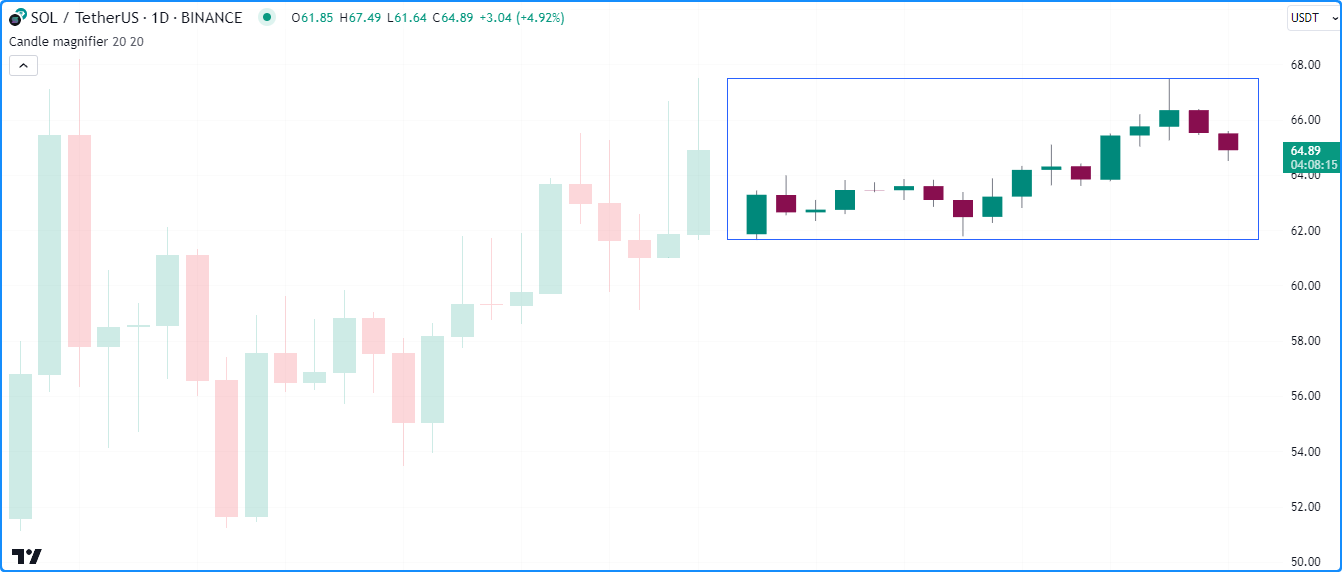
//@version=5
indicator("Tuples of intrabar data demo", "Candle magnifier", max_lines_count = 500)

//@variable The maximum number of intrabars to display.
int maxIntrabars = input.int(20, "Max intrabars", 1, 250)
//@variable The width of the drawn candle bodies.
int candleWidth = input.int(20, "Candle width", 2)

//@variable The largest valid timeframe closest to `maxIntrabars` times smaller than the chart timeframe.
string lowerTimeframe = timeframe.from_seconds(math.ceil(timeframe.in_seconds() / maxIntrabars))

//@variable An array of lines to represent intrabar wicks.
var array<line> wicks  = array.new<line>()
//@variable An array of lines to represent intrabar bodies.
var array<line> bodies = array.new<line>()
//@variable A box that surrounds the displayed intrabars.
var box magnifierBox = box.new(na, na, na, na, bgcolor = na)

// Fill the `wicks` and `bodies` arrays with blank lines on the first bar.
if barstate.isfirst
    for i = 1 to maxIntrabars
        array.push(wicks, line.new(na, na, na, na, color = color.gray))
        array.push(bodies, line.new(na, na, na, na, width = candleWidth))

//@variable A tuple of "float" arrays containing `open`, `high`, `low`, and `close` prices from the `lowerTimeframe`.
[oData, hData, lData, cData] = request.security_lower_tf(syminfo.tickerid, lowerTimeframe, [open, high, low, close])
//@variable The number of intrabars retrieved from the `lowerTimeframe` on the chart bar.
int numIntrabars = array.size(oData)

if numIntrabars > 0
    // Define the start and end bar index values for intrabar display.
    int startIndex = bar_index + 2
    int endIndex = startIndex + numIntrabars
    // Loop to update lines.
    for i = 0 to maxIntrabars - 1
        line wickLine = array.get(wicks, i)
        line bodyLine = array.get(bodies, i)
        if i < numIntrabars
            //@variable The `bar_index` of the drawing.
            int candleIndex = startIndex + i
            // Update the properties of the `wickLine` and `bodyLine`.
            line.set_xy1(wickLine, startIndex + i, array.get(hData, i))
            line.set_xy2(wickLine, startIndex + i, array.get(lData, i))
            line.set_xy1(bodyLine, startIndex + i, array.get(oData, i))
            line.set_xy2(bodyLine, startIndex + i, array.get(cData, i))
            line.set_color(bodyLine, bodyLine.get_y2() > bodyLine.get_y1() ? color.teal : color.maroon)
            continue
        // Set the coordinates of the `wickLine` and `bodyLine` to `na` if no intrabar data is available at the index.
        line.set_xy1(wickLine, na, na)
        line.set_xy2(wickLine, na, na)
        line.set_xy1(bodyLine, na, na)
        line.set_xy2(bodyLine, na, na)
    // Set the coordinates of the `magnifierBox`.
    box.set_lefttop(magnifierBox, startIndex - 1, array.max(hData))
    box.set_rightbottom(magnifierBox, endIndex, array.min(lData))
- Note that:
- The script draws each candle using two lines: one to represent wicks and the
other to represent the body. Since the script can display up to 500 lines on the chart, we’ve limited the
maxIntrabarsinput to 250. - The
lowerTimeframevalue is the result of calculating the math.ceil() of the timeframe.in_seconds() divided by themaxIntrabarsand converting to a valid timeframe string with timeframe.from_seconds(). - The script sets the top of the box drawing using the array.max()
of the requested
hDataarray, and it sets the box’s bottom using the array.min() of the requestedlDataarray. As we see on the chart, these values correspond to the high and low of the chart bar.
- The script draws each candle using two lines: one to represent wicks and the
other to represent the body. Since the script can display up to 500 lines on the chart, we’ve limited the
Requesting collections
In some cases, a script may need to request the IDs of collections
from an intrabar context. However, unlike request.security(),
one cannot pass collections or calls to functions that return them as the
expression argument in a request.security_lower_tf()
call, as arrays cannot directly reference other collections.
Despite these limitations, it is possible to request collections from lower timeframes, if needed, with the help of wrapper types.
Note
The use case described below is advanced and not recommended for beginners. Before exploring this approach, we recommend understanding how user-defined types and collections work in Pine Script™. When possible, we recommend using simpler methods to manage LTF requests, and only using this approach when nothing else will suffice.
To make collections requestable with request.security_lower_tf(), we must create a UDT with a field to reference a collection ID. This step is necessary since arrays cannot reference other collections directly but can reference UDTs with collection fields:
//@type A "wrapper" type to hold an `array<float>` instance.
type Wrapper
    array<float> collection
With our Wrapper UDT defined, we can now pass the IDs of objects of the UDT to the
expression parameter in request.security_lower_tf().
A straightforward approach is to call the built-in *.new() function as the expression. For example, this line of code
calls Wrapper.new() with array.from(close) as
its collection within
request.security_lower_tf():
//@variable An array of `Wrapper` IDs requested from the 1-minute timeframe.
array<Wrapper> wrappers = request.security_lower_tf(syminfo.tickerid, "1", Wrapper.new(array.from(close)))
Alternatively, we can create a user-defined function or method
that returns an object of the UDT and call that function
within request.security_lower_tf().
For instance, this code calls a custom newWrapper() function that returns a Wrapper ID as the expression argument:
//@function Creates a new `Wrapper` instance to wrap the specified `collection`.
newWrapper(array<float> collection) =>
    Wrapper.new(collection)

//@variable An array of `Wrapper` IDs requested from the 1-minute timeframe.
array<Wrapper> wrappers = request.security_lower_tf(syminfo.tickerid, "1", newWrapper(array.from(close)))
The result with either of the above is an array
containing Wrapper IDs from all available intrabars in the chart bar, which the script can use to reference Wrapper
instances from specific intrabars and use their collection fields in additional operations.
The script below utilizes this approach to collect arrays of intrabar data from a lowerTimeframe
and uses them to display data from a specific intrabar. Its custom Prices type contains a single data
field to reference array<float> instances that hold price data, and the user-defined newPrices() function
returns the ID of a Prices object.
The script calls request.security_lower_tf()
with a newPrices() call as its expression argument to retrieve an array
of Prices IDs from each intrabar in the chart bar, then uses array.get()
to get the ID from a specified available intrabar, if it exists. Lastly, it uses
array.get() on the data array assigned to
that instance and calls plotcandle()
to display its values on the chart:
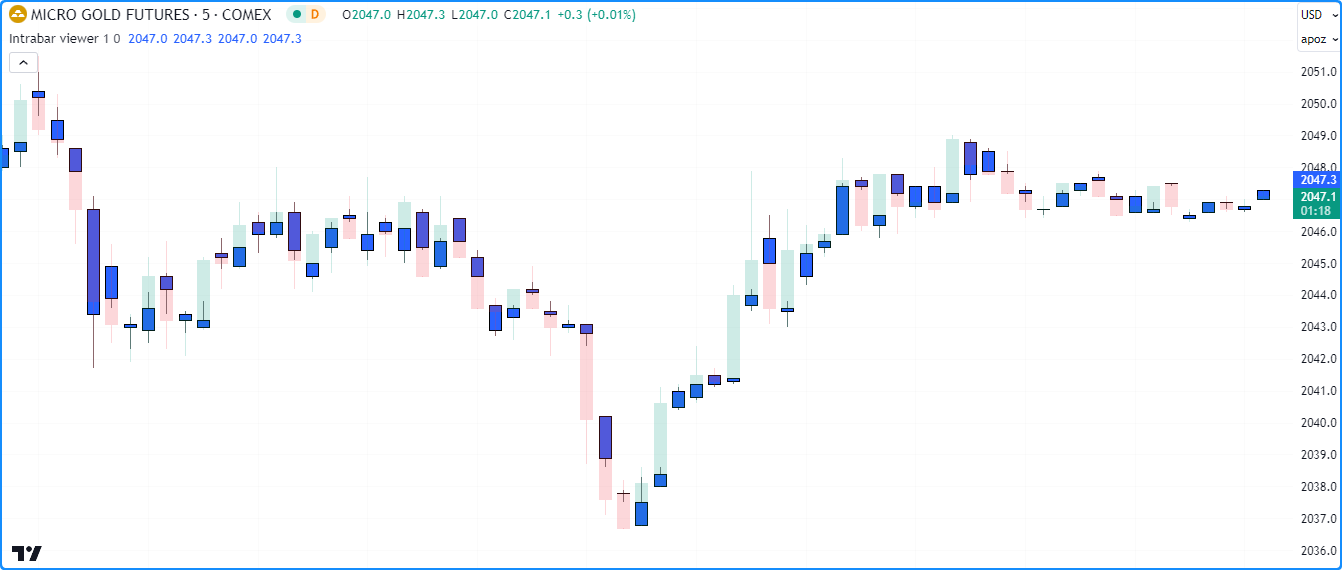
//@version=5
indicator("Requesting LTF collections demo", "Intrabar viewer", true)

//@variable The timeframe of the LTF data request.
string lowerTimeframe = input.timeframe("1", "Timeframe")
//@variable The index of the intrabar to show on each chart bar. 0 is the first available intrabar.
int intrabarIndex = input.int(0, "Intrabar to show", 0)

//@variable A custom type to hold an array of price `data`.
type Prices
    array<float> data

//@function Returns a new `Prices` instance containing current `open`, `high`, `low`, and `close` prices.
newPrices() =>
    Prices.new(array.from(open, high, low, close))

//@variable An array of `Prices` requested from the `lowerTimeframe`.
array<Prices> requestedPrices = request.security_lower_tf(syminfo.tickerid, lowerTimeframe, newPrices())

//@variable The `Prices` ID from the `requestedPrices` array at the `intrabarIndex`, or `na` if not available.
Prices intrabarPrices = array.size(requestedPrices) > intrabarIndex ? array.get(requestedPrices, intrabarIndex) : na
//@variable The `data` array from the `intrabarPrices`, or an array of `na` values if `intrabarPrices` is `na`.
array<float> intrabarData = na(intrabarPrices) ? array.new<float>(4, na) : intrabarPrices.data

// Plot the `intrabarData` values as candles.
plotcandle(intrabarData.get(0), intrabarData.get(1), intrabarData.get(2), intrabarData.get(3))
- Note that:
- The
intrabarPricesvariable only references aPricesID if the size of therequestedPricesarray is greater than theintrabarIndex, as attempting to use array.get() to get an element that doesn’t exist will result in an out of bounds error. - The
intrabarDatavariable only references thedatafield fromintrabarPricesif a validPricesID exists since a script cannot reference fields of an na value. - The process used in this example is not necessary to achieve the intended result. We could instead avoid using
UDTs and pass an
[open, high, low, close]tuple to theexpressionparameter to retrieve a tuple of arrays for further operations, as explained in the previous section.
- The
Custom contexts
Pine Script™ includes multiple ticker.*() functions that allow scripts to construct custom ticker IDs
that specify additional settings for data requests when used as a symbol argument in
request.security()
and request.security_lower_tf():
- ticker.new() constructs a custom
ticker ID from a specified
prefixandtickerwith additionalsessionandadjustmentsettings. - ticker.modify() constructs a
modified form of a specified
tickeridwith additionalsessionandadjustmentsettings. - ticker.heikinashi(),
ticker.renko(),
ticker.pointfigure(),
ticker.kagi(), and
ticker.linebreak() construct
a modified form a
symbolwith non-standard chart settings. - ticker.inherit() constructs a
new ticker ID for a
symbolwith additional parameters inherited from thefrom_tickeridspecified in the function call, allowing scripts to request thesymboldata with the same modifiers as thefrom_tickerid, including session, dividend adjustment, currency conversion, non-standard chart type, back-adjustment, settlement-as-close, etc. - ticker.standard() constructs a
standard ticker ID representing the
symbolwithout additional modifiers.
Let’s explore some practical examples of applying ticker.*() functions to request data from custom contexts.
Suppose we want to include dividend adjustment in a stock symbol’s prices without enabling the “Adjust data for dividends”
option in the “Symbol” section of the chart’s settings. We can achieve this in a script by constructing a custom ticker ID
for the instrument using ticker.new()
or ticker.modify() with an adjustment
value of adjustment.dividends.
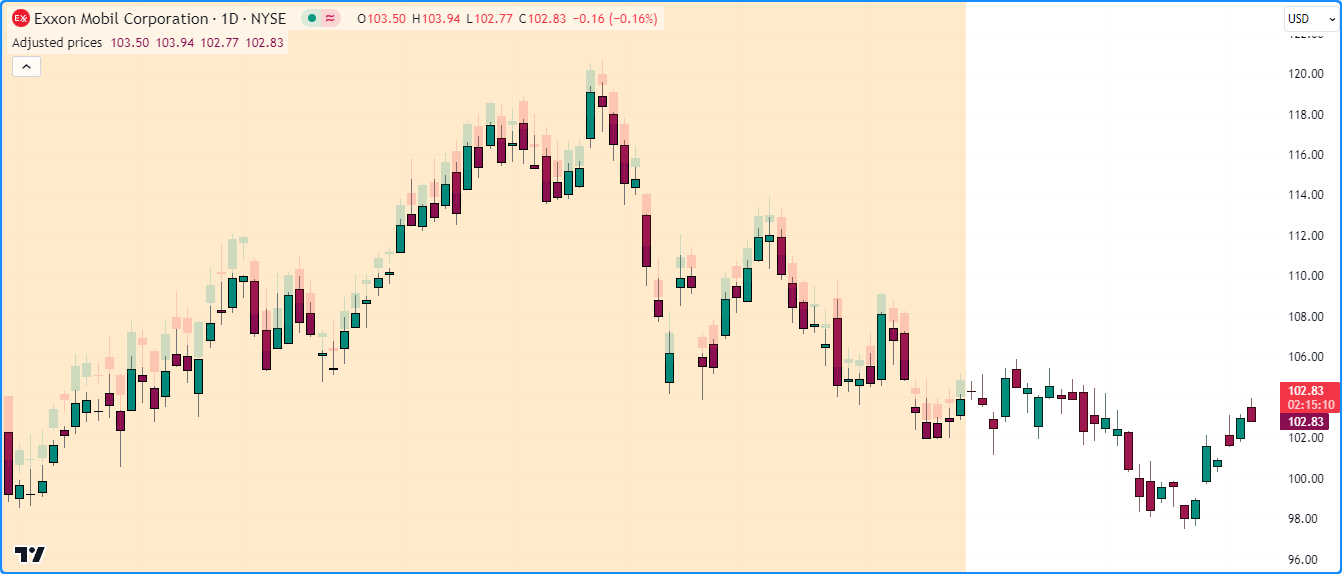
This script creates an adjustedTickerID using
ticker.modify(), uses that ticker ID
as the symbol in request.security()
to retrieve a tuple of adjusted price values,
then plots the result as candles on the chart.
It also highlights the background when the requested prices differ from the prices without dividend adjustment.
As we see on the “NYSE:XOM” chart below, enabling dividend adjustment results in different historical values before the date of the latest dividend:
//@version=5
indicator("Custom contexts demo 1", "Adjusted prices", true)

//@variable A custom ticker ID representing the chart's symbol with the dividend adjustment modifier.
string adjustedTickerID = ticker.modify(syminfo.tickerid, adjustment = adjustment.dividends)

// Request the adjusted prices for the chart's symbol.
[o, h, l, c] = request.security(adjustedTickerID, timeframe.period, [open, high, low, close])

//@variable The color of the candles on the chart.
color candleColor = c > o ? color.teal : color.maroon

// Plot the adjusted prices.
plotcandle(o, h, l, c, "Adjusted Prices", candleColor)
// Highlight the background when `c` is different from `close`.
bgcolor(c != close ? color.new(color.orange, 80) : na)
- Note that:
- If a modifier included in a constructed ticker ID does not apply to the symbol, the script will ignore that modifier when requesting data. For instance, this script will display the same values as the main chart on forex symbols such as “EURUSD”.
While the example above demonstrates a simple way to modify the chart’s symbol, a more frequent use case for ticker.*() functions
is applying custom modifiers to another symbol while requesting data. If a ticker ID referenced in a script already has the
modifiers one would like to apply (e.g., adjustment settings, session type, etc.), they can use
ticker.inherit() to quickly and efficiently add those
modifiers to another symbol.
In the example below, we’ve edited the previous script to request data for a symbolInput using modifiers inherited
from the adjustedTickerID. This script calls ticker.inherit()
to construct an inheritedTickerID and uses that ticker ID in a
request.security() call. It also requests data
for the symbolInput without additional modifiers and plots candles
for both ticker IDs in a separate chart pane to compare the difference.
As shown on the chart, the data requested using the inheritedTickerID includes dividend adjustment, whereas the data requested
using the symbolInput directly does not:
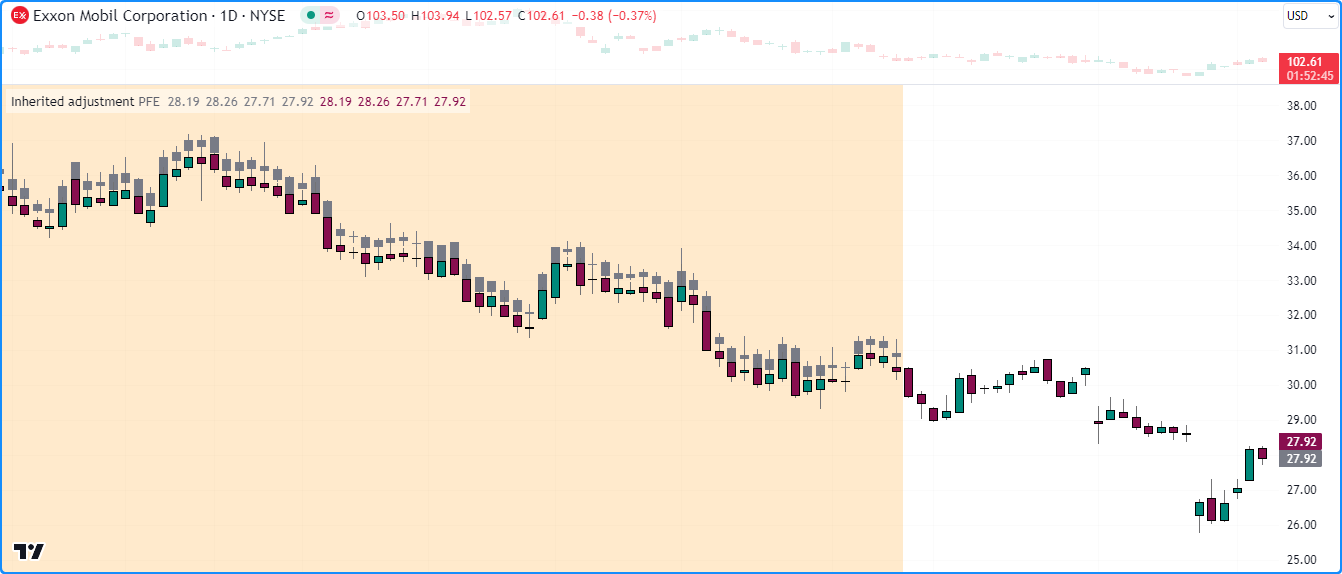
//@version=5
indicator("Custom contexts demo 2", "Inherited adjustment")

//@variable The symbol to request data from.
string symbolInput = input.symbol("NYSE:PFE", "Symbol")

//@variable A custom ticker ID representing the chart's symbol with the dividend adjustment modifier.
string adjustedTickerID = ticker.modify(syminfo.tickerid, adjustment = adjustment.dividends)
//@variable A custom ticker ID representing the `symbolInput` with modifiers inherited from the `adjustedTickerID`.
string inheritedTickerID = ticker.inherit(adjustedTickerID, symbolInput)

// Request prices using the `symbolInput`.
[o1, h1, l1, c1] = request.security(symbolInput, timeframe.period, [open, high, low, close])
// Request prices using the `inheritedTickerID`.
[o2, h2, l2, c2] = request.security(inheritedTickerID, timeframe.period, [open, high, low, close])

//@variable The color of the candles that use the `inheritedTickerID` prices.
color candleColor = c2 > o2 ? color.teal : color.maroon

// Plot the `symbol` prices.
plotcandle(o1, h1, l1, c1, "Symbol", color.gray, color.gray, bordercolor = color.gray)
// Plot the `inheritedTickerID` prices.
plotcandle(o2, h2, l2, c2, "Symbol With Modifiers", candleColor)
// Highlight the background when `c1` is different from `c2`.
bgcolor(c1 != c2 ? color.new(color.orange, 80) : na)
- Note that:
- Since the
adjustedTickerIDrepresents a modified form of the syminfo.tickerid, if we modify the chart’s context in other ways, such as changing the chart type or enabling extended trading hours in the chart’s settings, those modifiers will also apply to theadjustedTickerIDandinheritedTickerID. However, they will not apply to thesymbolInputsince it represents a standard ticker ID.
- Since the
Another frequent use case for requesting custom contexts is retrieving data that uses non-standard chart calculations. For example, suppose we want to use Renko price values to calculate trade signals in a strategy() script. If we simply change the chart type to “Renko” to get the prices, the strategy will also simulate its trades based on those synthetic prices, producing misleading results:
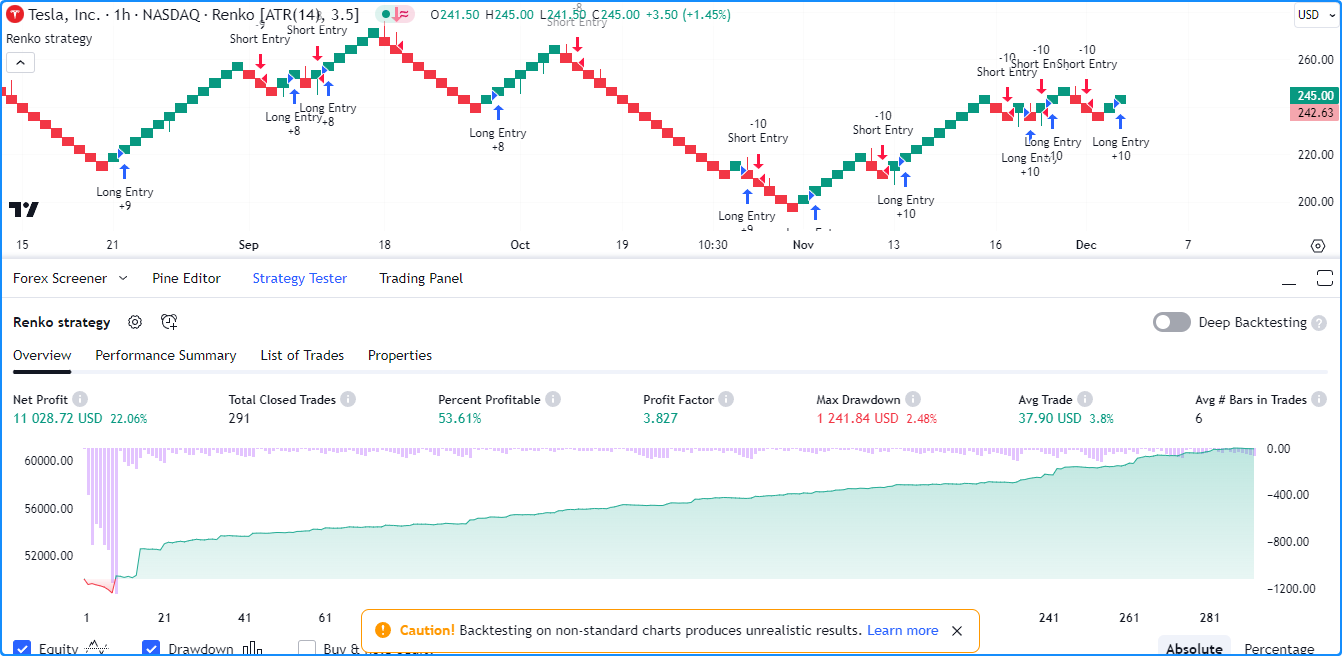
//@version=5
strategy(
     "Custom contexts demo 3", "Renko strategy", true, default_qty_type = strategy.percent_of_equity,
     default_qty_value = 2, initial_capital = 50000, slippage = 2,
     commission_type = strategy.commission.cash_per_contract, commission_value = 1, margin_long = 100,
     margin_short = 100
 )

//@variable When `true`, the strategy places a long market order.
bool longEntry = ta.crossover(close, open)
//@variable When `true`, the strategy places a short market order.
bool shortEntry = ta.crossunder(close, open)

if longEntry
    strategy.entry("Long Entry", strategy.long)
if shortEntry
    strategy.entry("Short Entry", strategy.short)
To ensure our strategy shows results based on actual prices, we can create a Renko ticker ID using ticker.renko() while keeping the chart on a standard type, allowing the script to request and use Renko prices to calculate its signals without calculating the strategy results on them:
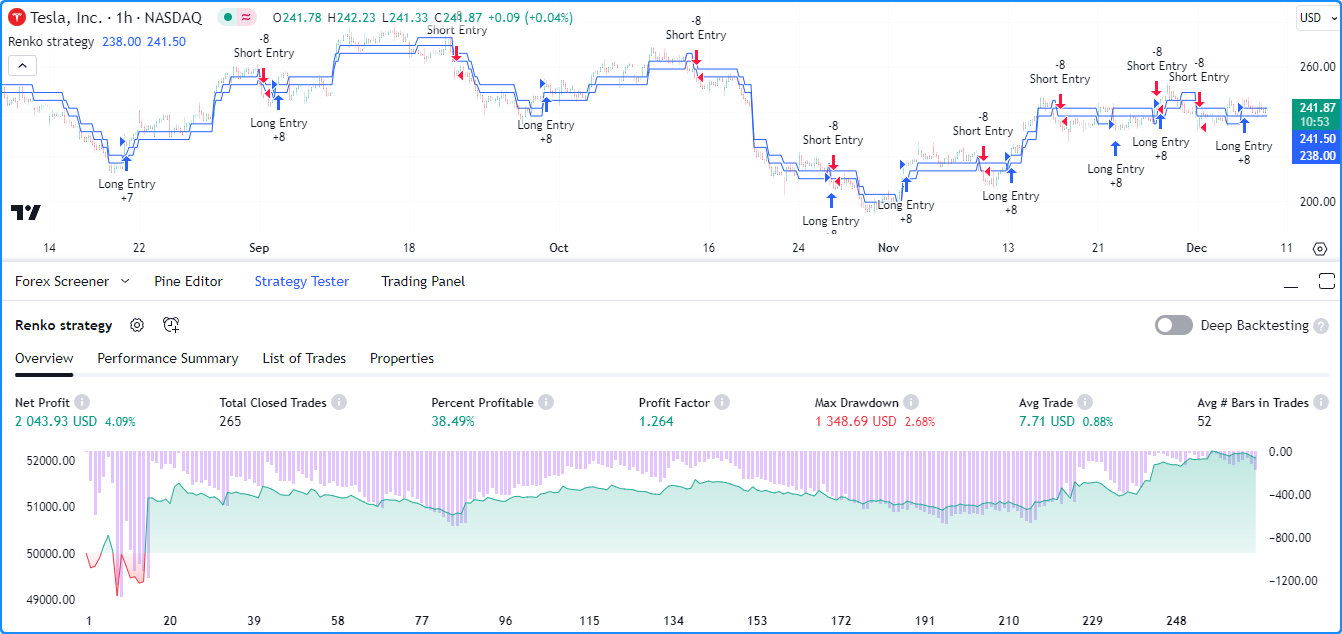
//@version=5
strategy(
     "Custom contexts demo 3", "Renko strategy", true, default_qty_type = strategy.percent_of_equity,
     default_qty_value = 2, initial_capital = 50000, slippage = 1,
     commission_type = strategy.commission.cash_per_contract, commission_value = 1, margin_long = 100,
     margin_short = 100
 )

//@variable A Renko ticker ID.
string renkoTickerID = ticker.renko(syminfo.tickerid, "ATR", 14)
// Request the `open` and `close` prices using the `renkoTickerID`.
[renkoOpen, renkoClose] = request.security(renkoTickerID, timeframe.period, [open, close])

//@variable When `true`, the strategy places a long market order.
bool longEntry = ta.crossover(renkoClose, renkoOpen)
//@variable When `true`, the strategy places a short market order.
bool shortEntry = ta.crossunder(renkoClose, renkoOpen)

if longEntry
    strategy.entry("Long Entry", strategy.long)
if shortEntry
    strategy.entry("Short Entry", strategy.short)

plot(renkoOpen)
plot(renkoClose)
Historical and realtime behavior
Functions in the request.*() namespace can behave differently on historical and realtime bars.
This behavior is closely related to Pine’s Execution model.
Consider how a script behaves within the main context. Throughout the chart’s history, the script calculates its required values once and commits them to that bar so their states are accessible later in the execution. On an unconfirmed bar, however, the script recalculates its values on each update to the bar’s data to align with realtime changes. Before recalculating the values on that bar, it reverts calculated values to their last committed states, otherwise known as rollback, and it only commits values to that bar once the bar closes.
Now consider the behavior of data requests from other contexts with request.security(). As when evaluating historical bars in the main context, request.security() only returns new historical values when it confirms a bar in its specified context. When executing on realtime bars, it returns recalculated values on each chart bar, similar to how a script recalculates values in the main context on the open chart bar.
However, the function only confirms the requested values when a bar from its context closes. When the script restarts its execution, what were previously considered realtime bars become historical bars. Therefore, request.security() will only return the values it confirmed on those bars. In essence, this behavior means that requested data may repaint when its values fluctuate on realtime bars without confirmation from the context.
Note
It’s often helpful to distinguish historical bars from realtime bars when working with request.*() functions.
Scripts can determine whether bars have historical or realtime states via the
barstate.ishistory and
barstate.isrealtime variables.
In most circumstances where a script requests data from a broader context, one will typically require confirmed, stable values that do not fluctuate on realtime bars. The section below explains how to achieve such a result and avoid repainting data requests.
Avoiding Repainting
Higher-timeframe data
When requesting values from a higher timeframe, they are subject to repainting since realtime bars can contain unconfirmed information from developing HTF bars, and the script may adjust the times that new values come in on historical bars. To avoid repainting HTF data, one must ensure that the function only returns confirmed values with consistent timing on all bars, regardless of bar state.
The most reliable approach to achieve non-repainting results is to use an expression argument that only
references past bars (e.g., close[1]) while using
barmerge.lookahead_on
as the lookahead value.
Using barmerge.lookahead_on
with non-offset HTF data requests is discouraged since it prompts
request.security() to “look ahead”
to the final values of an HTF bar, retrieving confirmed values before they’re actually available in the script’s
history. However, if the values used in the expression are offset by at least one bar, the “future” data the
function retrieves is no longer from the future. Instead, the data represents confirmed values from established,
available HTF bars. In other words, applying an offset to the expression effectively prevents the requested
data from repainting when the script restarts its execution and eliminates lookahead bias in the historical series.
The following example demonstrates a repainting HTF data request. The script uses request.security() without offset modifications or additional arguments to retrieve the results of a ta.wma() call from a higher timeframe. It also highlights the background to indicate which bars were in a realtime state during its calculations.
As shown on the chart below, the plot of the requested WMA only changes on historical bars when HTF bars close, whereas it fluctuates on all realtime bars since the data includes unconfirmed values from the higher timeframe:
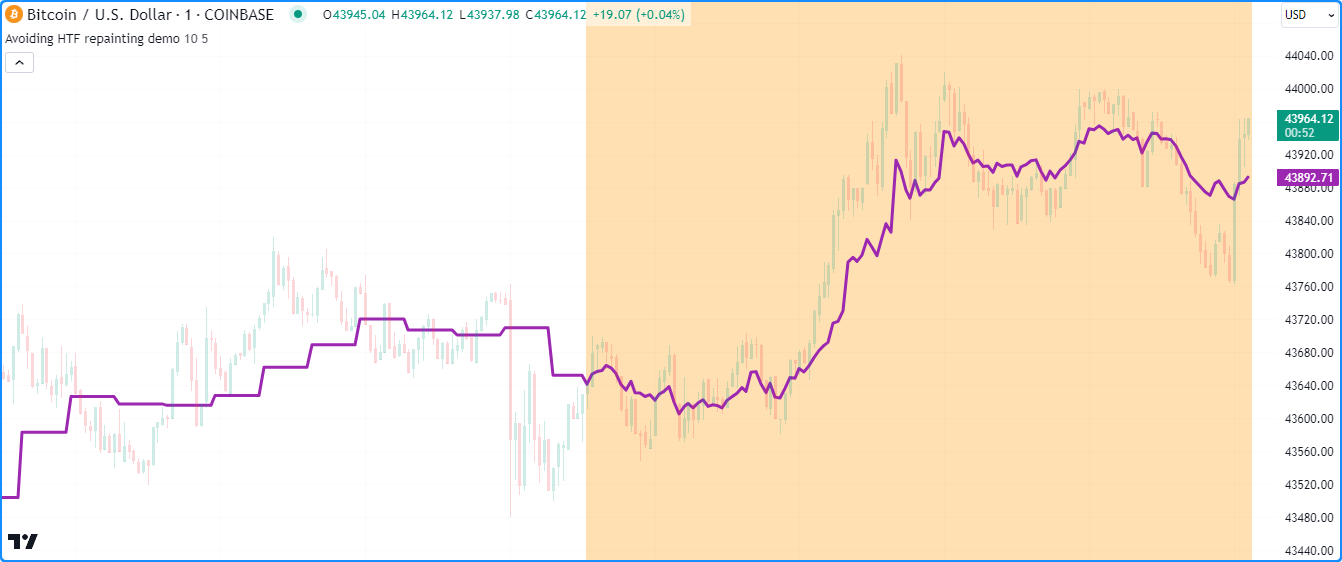
//@version=5
indicator("Avoiding HTF repainting demo", overlay = true)

//@variable The multiplier applied to the chart's timeframe.
int tfMultiplier = input.int(10, "Timeframe multiplier", 1)
//@variable The number of bars in the moving average.
int length = input.int(5, "WMA smoothing length")

//@variable The valid timeframe string closest to `tfMultiplier` times larger than the chart timeframe.
string timeframe = timeframe.from_seconds(timeframe.in_seconds() * tfMultiplier)

//@variable The weighted MA of `close` prices over `length` bars on the `timeframe`.
//          This request repaints because it includes unconfirmed HTF data on realtime bars and it may offset the
//          times of its historical results.
float requestedWMA = request.security(syminfo.tickerid, timeframe, ta.wma(close, length))

// Plot the requested series.
plot(requestedWMA, "HTF WMA", color.purple, 3)
// Highlight the background on realtime bars.
bgcolor(barstate.isrealtime ? color.new(color.orange, 70) : na, title = "Realtime bar highlight")
To avoid repainting in this script, we can add lookahead = barmerge.lookahead_on to the
request.security() call and
offset the call history of ta.wma() by
one bar with the history-referencing operator [],
ensuring the request always retrieves the last confirmed HTF bar’s WMA at the start of each new timeframe.
Unlike the previous script, this version has consistent behavior on historical and realtime bar states, as we see below:
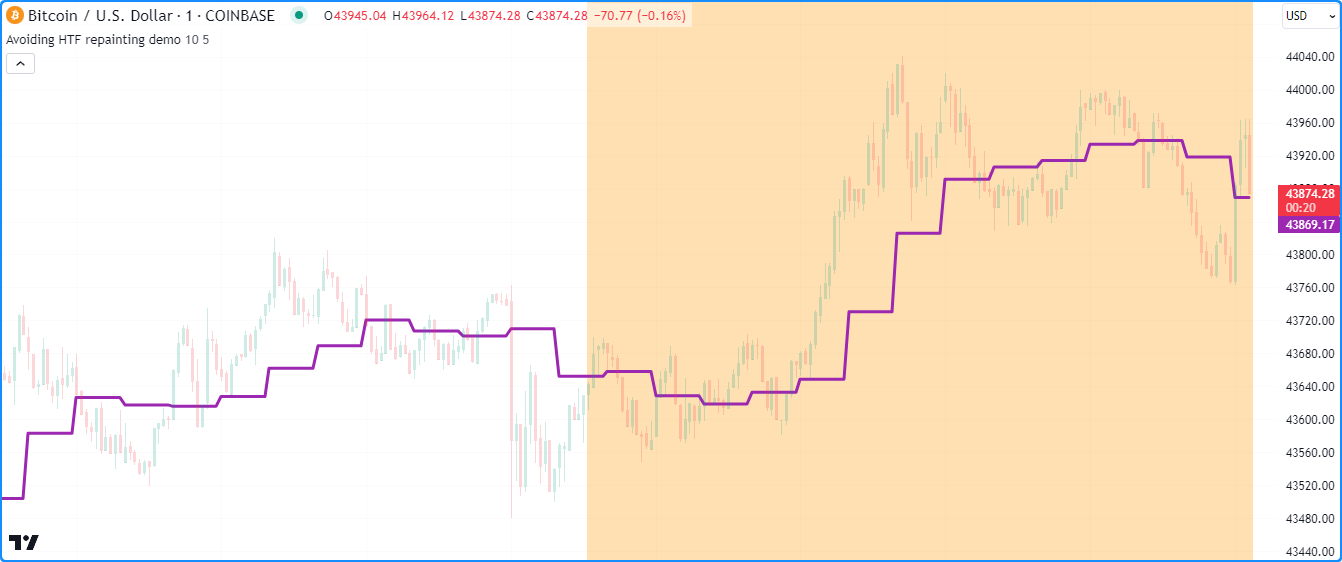
//@version=5
indicator("Avoiding HTF repainting demo", overlay = true)

//@variable The multiplier applied to the chart's timeframe.
int tfMultiplier = input.int(10, "Timeframe multiplier", 1)
//@variable The number of bars in the moving average.
int length = input.int(5, "WMA smoothing length")

//@variable The valid timeframe string closest to `tfMultiplier` times larger than the chart timeframe.
string timeframe = timeframe.from_seconds(timeframe.in_seconds() * tfMultiplier)

//@variable The weighted MA of `close` prices over `length` bars on the `timeframe`.
//          This request does not repaint, as it always references the last confirmed WMA value on all bars.
float requestedWMA = request.security(
     syminfo.tickerid, timeframe, ta.wma(close, length)[1], lookahead = barmerge.lookahead_on
 )

// Plot the requested value.
plot(requestedWMA, "HTF WMA", color.purple, 3)
// Highlight the background on realtime bars.
bgcolor(barstate.isrealtime ? color.new(color.orange, 70) : na, title = "Realtime bar highlight")
Lower-timeframe data
The request.security() and request.security_lower_tf() functions can retrieve data from lower-timeframe contexts. The request.security() function can only retrieve data from a single intrabar in each chart bar, and request.security_lower_tf() retrieves data from all available intrabars.
When using these functions to retrieve intrabar data, it’s important to note that such requests are not immune to repainting behavior. Historical and realtime series often rely on separate data feeds. Data providers may retroactively modify realtime data, and it’s possible for races to occur in realtime data feeds, as explained in the Data feeds section of this page. Either case may result in intrabar data retrieved on realtime bars repainting after the script restarts its execution.
Additionally, a particular case that will cause repainting LTF requests is using request.security() with barmerge.lookahead_on to retrieve data from the first intrabar in each chart bar. While it will generally work as expected on historical bars, it will track only the most recent intrabar on realtime bars, as request.security() does not retain all intrabar information, and the intrabars retrieved by the function on realtime bars are unsorted until restarting the script’s execution:

//@version=5
indicator("Avoiding LTF repainting demo", overlay = true)

//@variable The lower timeframe of the requested data.
string lowerTimeframe = input.timeframe("1", "Timeframe")

//@variable The first intrabar `close` requested from the `lowerTimeframe` on each bar.
//          Only works as intended on historical bars.
float requestedClose = request.security(syminfo.tickerid, lowerTimeframe, close, lookahead = barmerge.lookahead_on)

// Plot the `requestedClose`.
plot(requestedClose, "First intrabar close", linewidth = 3)
// Highlight the background on realtime bars.
bgcolor(barstate.isrealtime ? color.new(color.orange, 60) : na, title = "Realtime bar Highlight")
One can mitigate this behavior and track the values from the first intrabar, or any available intrabar in the chart bar, by using request.security_lower_tf() since it maintains an array of intrabar values ordered by the times they come in. Here, we call array.first() on a requested array of intrabar data to retrieve the close price from the first available intrabar in each chart bar:
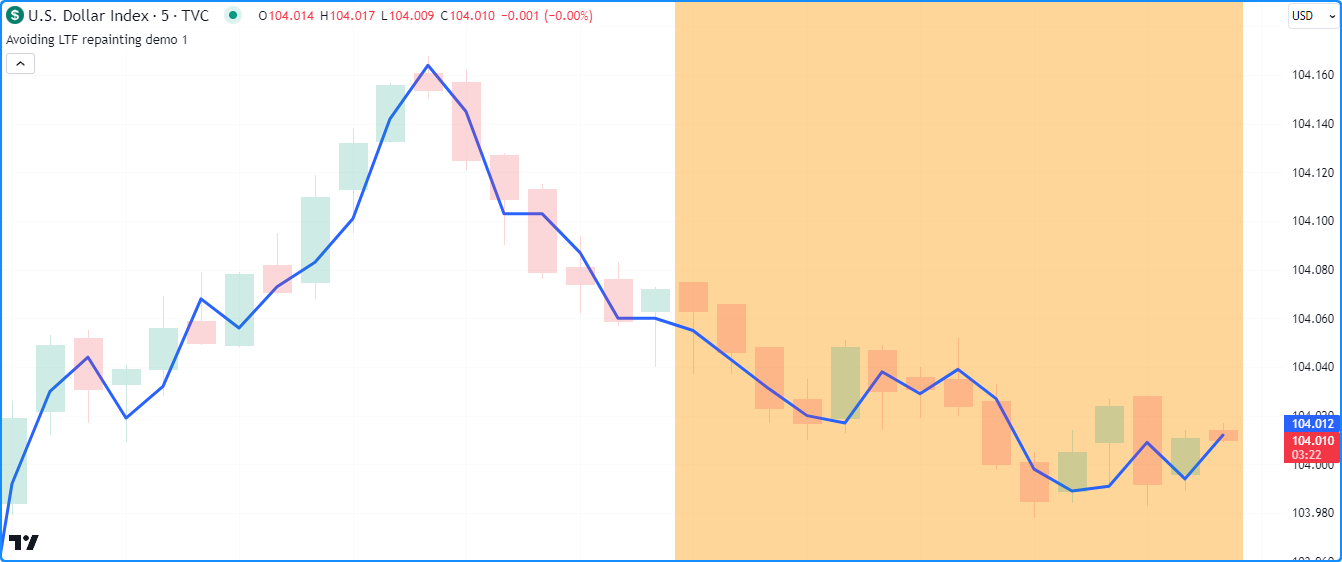
//@version=5
indicator("Avoiding LTF repainting demo", overlay = true)

//@variable The lower timeframe of the requested data.
string lowerTimeframe = input.timeframe("1", "Timeframe")

//@variable An array of intrabar `close` values requested from the `lowerTimeframe` on each bar.
array<float> requestedCloses = request.security_lower_tf(syminfo.tickerid, lowerTimeframe, close)

//@variable The first intrabar `close` on each bar with available data.
float firstClose = requestedCloses.size() > 0 ? requestedCloses.first() : na

// Plot the `firstClose`.
plot(firstClose, "First intrabar close", linewidth = 3)
// Highlight the background on realtime bars.
bgcolor(barstate.isrealtime ? color.new(color.orange, 60) : na, title = "Realtime bar Highlight")
- Note that:
- While request.security_lower_tf() is more optimized for handling historical and realtime intrabars, it’s still possible in some cases for minor repainting to occur due to data differences from the provider, as outlined above.
- This code may not show intrabar data on all available chart bars, depending on how many intrabars each chart bar contains,
as
request.*()functions can retrieve up to 100,000 intrabars from an LTF context. See this section of the Limitations page for more information.
`request.currency_rate()`
When a script needs to convert values expressed in one currency to another, one can use request.currency_rate(). This function requests a daily rate for currency conversion calculations based on “FX_IDC” data, providing a simpler alternative to fetching specific pairs or spreads with request.security().
While one can use request.security() to retrieve daily currency rates, its use case is more involved than request.currency_rate(), as one needs to supply a valid ticker ID for a currency pair or spread to request the rate. Additionally, a historical offset and barmerge.lookahead_on are necessary to prevent the results from repainting, as explained in this section.
The request.currency_rate() function, on the other hand, only requires currency codes. No ticker ID is needed when requesting rates with this function, and it ensures non-repainting results without requiring additional specification.
The function’s signature is as follows:
request.currency_rate(from, to, ignore_invalid_currency) → series float
The from parameter specifies the currency to convert, and the to parameter specifies the target currency. Both parameters
accept “string” values in the ISO 4217 format (e.g., “USD”) or any built-in
currency.* variable (e.g., currency.USD).
When the function cannot calculate a valid conversion rate between the from and to currencies supplied in the call, one can
decide whether it will raise a runtime error or return na via the
ignore_invalid_currency parameter. The default value is false, meaning the function will raise a runtime error and halt the
script’s execution.
The following example demonstrates a simple use case for request.currency_rate(). Suppose we want to convert values expressed in Turkish lira (currency.TRY) to South Korean won (currency.KRW) using a daily conversion rate. If we use request.security() to retrieve the rate, we must supply a valid ticker ID and request the last confirmed close from the previous day.
In this case, no “FX_IDC” symbol exists that would allow us to retrieve a conversion rate directly with
request.security(). Therefore, we first need a ticker ID
for a spread that converts TRY to an intermediate currency, such as USD,
then converts the intermediate currency to KRW. We can then use that ticker ID within
request.security() with close[1] as the expression
and barmerge.lookahead_on as the lookahead value
to request a non-repainting daily rate.
Alternatively, we can achieve the same result more simply by calling
request.currency_rate(). This function does all the
heavy lifting for us, only requiring from and to currency arguments to perform its calculation.
As we see below, both approaches return the same daily rate:
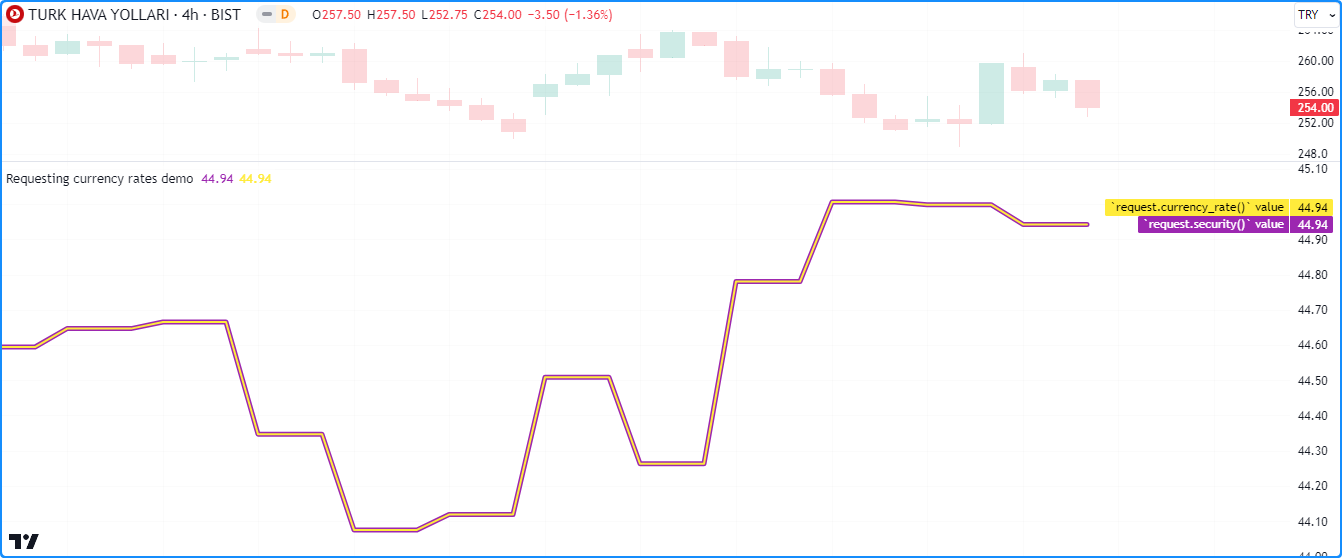
//@version=5
indicator("Requesting currency rates demo")

//@variable The currency to convert.
simple string fromCurrency = currency.TRY
//@variable The resulting currency.
simple string toCurrency = currency.KRW

//@variable The spread symbol to request. Required in `request.security()` since no direct "FX_IDC" rate exists.
simple string spreadSymbol = str.format("FX_IDC:{0}{2} * FX_IDC:{2}{1}", fromCurrency, toCurrency, currency.USD)

//@variable The non-repainting conversion rate from `request.security()` using the `spreadSymbol`.
float securityRequestedRate = request.security(spreadSymbol, "1D", close[1], lookahead = barmerge.lookahead_on)
//@variable The non-repainting conversion rate from `request.currency_rate()`.
float nonSecurityRequestedRate = request.currency_rate(fromCurrency, toCurrency)

// Plot the requested rates. We can multiply TRY values by these rates to convert them to KRW.
plot(securityRequestedRate, "`request.security()` value", color.purple, 5)
plot(nonSecurityRequestedRate, "`request.currency_rate()` value", color.yellow, 2)
`request.dividends()`, `request.splits()`, and `request.earnings()`
Analyzing a stock’s earnings data and corporate actions provides helpful insights into its underlying financial strength. Pine Script™ provides the ability to retrieve essential information about applicable stocks via request.dividends(), request.splits(), and request.earnings().
These are the functions’ signatures:
request.dividends(ticker, field, gaps, lookahead, ignore_invalid_symbol, currency) → series float

request.splits(ticker, field, gaps, lookahead, ignore_invalid_symbol) → series float

request.earnings(ticker, field, gaps, lookahead, ignore_invalid_symbol, currency) → series float
Each function has the same parameters in its signature, with the exception of
request.splits(), which doesn’t have a
currency paramter.
Note that unlike the symbol parameter in other request.*() functions, the ticker parameter in these functions
only accepts an “Exchange:Symbol” pair, such as “NASDAQ:AAPL”. The built-in
syminfo.ticker variable does not work with
these functions since it does not contain exchange information. Instead, one must use
syminfo.tickerid for such cases.
The field parameter determines the data the function will retrieve. Each of these functions accepts different built-in
variables as the field argument since each requests different information about a stock:
- The request.dividends() function retrieves current
dividend information for a stock, i.e., the amount per share the issuing company paid out to investors who purchased shares before
the ex-dividend date. Passing the built-in dividends.gross
or dividends.net variables to the
fieldparameter specifies whether the returned value represents dividends before or after factoring in expenses the company deducts from its payouts. - The request.splits() function retrieves current split
and reverse split information for a stock. A split occurs when a company increases its outstanding shares to promote liquidity. A reverse
split occurs when a company consolidates its shares and offers them at a higher price to attract specific investors or maintain their
listing on a market that has a minimum per-share price. Companies express their split information as ratios. For example, a 5:1 split
means the company issued additional shares to its shareholders so that they have five times the number of shares they had before the split,
and the raw price of each share becomes one-fifth of the previous price. Passing
splits.numerator or
splits.denominator to the
fieldparameter of request.splits() determines whether it returns the numerator or denominator of the split ratio. - The request.earnings() function retrieves the earnings per
share (EPS) information for a stock
ticker’s issuing company. The EPS value is the ratio of a company’s net income to the number of outstanding stock shares, which investors consider an indicator of the company’s profitability. Passing earnings.actual, earnings.estimate, or earnings.standardized as thefieldargument in request.earnings() respectively determines whether the function requests the actual, estimated, or standardized EPS value.
For a detailed explanation of the gaps, lookahead, and ignore_invalid_symbol parameters of these functions, see the
Common characteristics section at the top of this page.
It’s important to note that the values returned by these functions reflect the data available as it comes in. This behavior differs from financial data originating from a request.financial() call in that the underlying data from such calls becomes available according to a company’s fiscal reporting period.
Note
Scripts can also retrieve information about upcoming earnings and dividends for an instrument via the
earnings.future_* and dividends.future_* built-in variables.
Here, we’ve included an example that displays a handy table containing
the most recent dividend, split, and EPS data. The script calls the request.*() functions discussed in this section to retrieve the data,
then converts the values to “strings” with str.*() functions and displays the results in the infoTable with
table.cell():
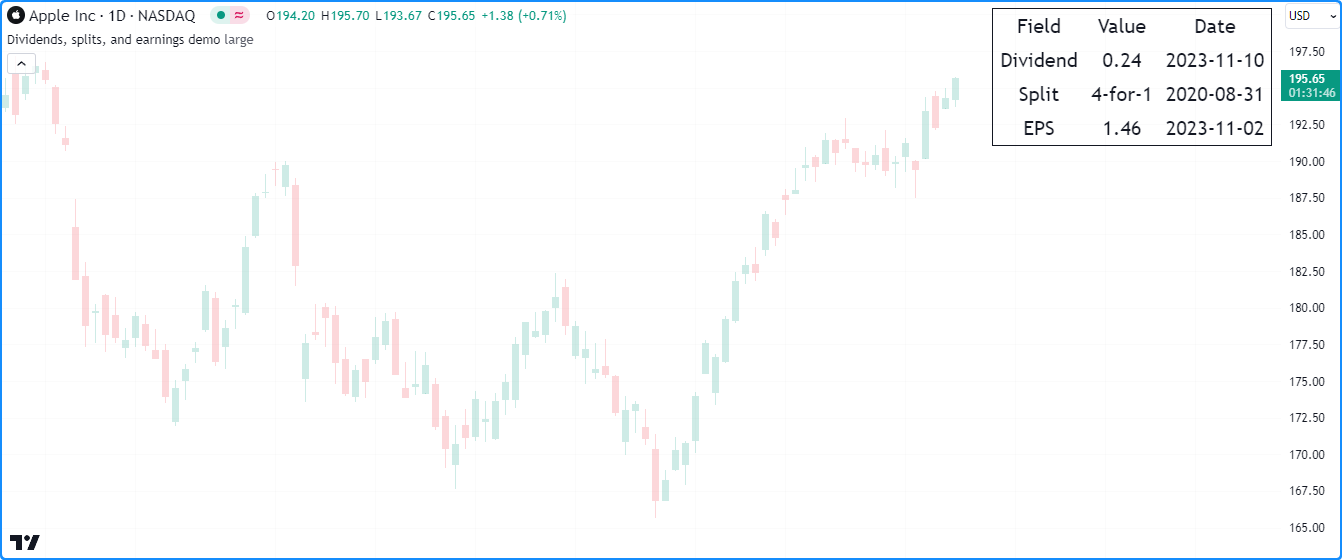
//@version=5
indicator("Dividends, splits, and earnings demo", overlay = true)

//@variable The size of the table's text.
string tableSize = input.string(
     size.large, "Table size", [size.auto, size.tiny, size.small, size.normal, size.large, size.huge]
 )

//@variable The color of the table's text and frame.
var color tableColor = chart.fg_color
//@variable A `table` displaying the latest dividend, split, and EPS information.
var table infoTable = table.new(position.top_right, 3, 4, frame_color = tableColor, frame_width = 1)

// Add header cells on the first bar.
if barstate.isfirst
    table.cell(infoTable, 0, 0, "Field", text_color = tableColor, text_size = tableSize)
    table.cell(infoTable, 1, 0, "Value", text_color = tableColor, text_size = tableSize)
    table.cell(infoTable, 2, 0, "Date", text_color = tableColor, text_size = tableSize)
    table.cell(infoTable, 0, 1, "Dividend", text_color = tableColor, text_size = tableSize)
    table.cell(infoTable, 0, 2, "Split", text_color = tableColor, text_size = tableSize)
    table.cell(infoTable, 0, 3, "EPS", text_color = tableColor, text_size = tableSize)

//@variable The amount of the last reported dividend as of the current bar.
float latestDividend = request.dividends(syminfo.tickerid, dividends.gross, barmerge.gaps_on)
//@variable The numerator of that last reported split ratio as of the current bar.
float latestSplitNum = request.splits(syminfo.tickerid, splits.numerator, barmerge.gaps_on)
//@variable The denominator of the last reported split ratio as of the current bar.
float latestSplitDen = request.splits(syminfo.tickerid, splits.denominator, barmerge.gaps_on)
//@variable The last reported earnings per share as of the current bar.
float latestEPS = request.earnings(syminfo.tickerid, earnings.actual, barmerge.gaps_on)

// Update the "Value" and "Date" columns when new values come in.
if not na(latestDividend)
    table.cell(
         infoTable, 1, 1, str.tostring(math.round(latestDividend, 3)), text_color = tableColor, text_size = tableSize
     )
    table.cell(infoTable, 2, 1, str.format_time(time, "yyyy-MM-dd"), text_color = tableColor, text_size = tableSize)
if not na(latestSplitNum)
    table.cell(
         infoTable, 1, 2, str.format("{0}-for-{1}", latestSplitNum, latestSplitDen), text_color = tableColor,
         text_size = tableSize
     )
    table.cell(infoTable, 2, 2, str.format_time(time, "yyyy-MM-dd"), text_color = tableColor, text_size = tableSize)
if not na(latestEPS)
    table.cell(infoTable, 1, 3, str.tostring(latestEPS), text_color = tableColor, text_size = tableSize)
    table.cell(infoTable, 2, 3, str.format_time(time, "yyyy-MM-dd"), text_color = tableColor, text_size = tableSize)
- Note that:
- We’ve included barmerge.gaps_on in the
request.*()calls, so they only return values when new data is available. Otherwise, they return na. - The script assigns a table ID to the
infoTablevariable on the first chart bar. On subsequent bars, it updates necessary cells with new information whenever data is available. - If no information is available from any of the
request.*()calls throughout the chart’s history (e.g., if thetickerhas no dividend information), the script does not initialize the corresponding cells since it’s unnecessary.
- We’ve included barmerge.gaps_on in the
`request.quandl()`
TradingView forms partnerships with many fintech companies to provide users access to extensive information on financial instruments, economic data, and more. One of our many partners is Nasdaq Data Link (formerly Quandl), which provides multiple external data feeds that scripts can access via the request.quandl() function.
Here is the function’s signature:
request.quandl(ticker, gaps, index, ignore_invalid_symbol) → series float
The ticker parameter accepts a “simple string” representing the ID of the database published on Nasdaq Data Link and its
time series code, separated by the “/” delimiter. For example, the code “FRED/DFF” represents the “Effective Federal Funds Rate”
time series from the “Federal Reserve Economic Data” database.
The index parameter accepts a “simple int” representing the column index of the requested data, where 0 is the first
available column. Consult the database’s documentaion on Nasdaq Data Link’s website to see available columns.
For details on the gaps and ignore_invalid_symbol parameters, see the
Common characteristics section of this page.
Note
The request.quandl() function can only request free data from Nasdaq Data Link. No data that requires a paid subscription to their services is accessible with this function. Nasdaq Data Link may change the data it provides over time, and they may not update available datasets regularly. Therefore, it’s up to programmers to research the supported data available for request and review the documentation provided for each dataset. You can search for free data here.
This script requests Bitcoin hash rate (“HRATE”) information from the “Bitcoin Data Insights” (“BCHAIN”) database and plots the retrieved time series data on the chart. It uses color.from_gradient() to color the area plot based on the distance from the current hash rate to its all-time high:
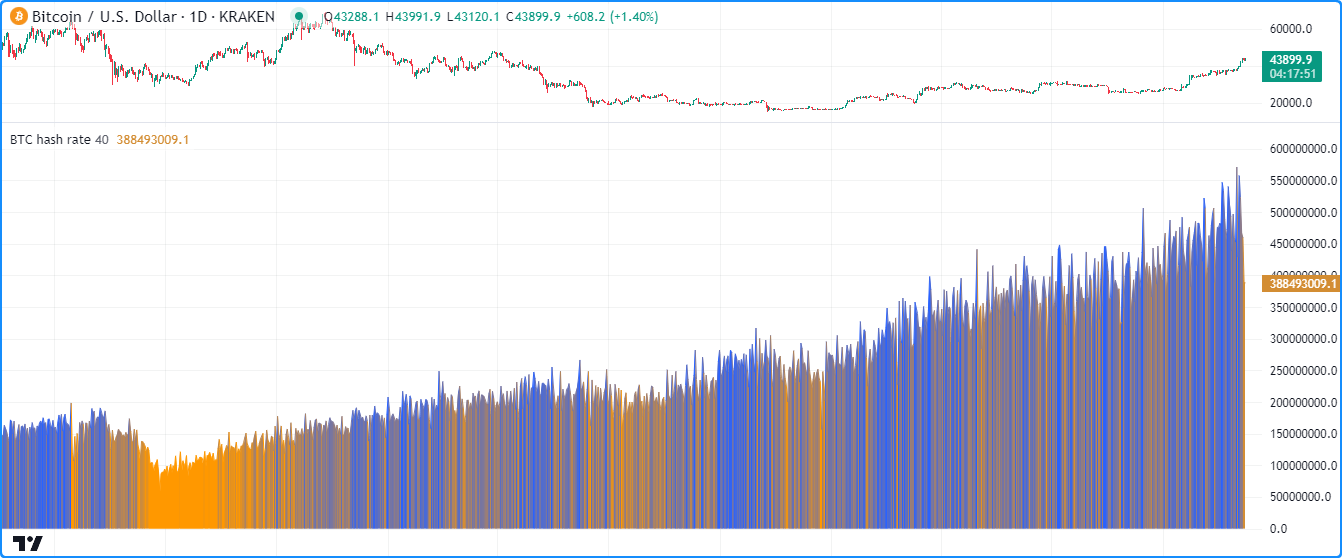
//@version=5
indicator("Quandl demo", "BTC hash rate")

//@variable The estimated hash rate for the Bitcoin network.
float hashRate = request.quandl("BCHAIN/HRATE", barmerge.gaps_off, 0)
//@variable The percentage threshold from the all-time highest `hashRate`.
float dropThreshold = input.int(40, "Drop threshold", 0, 100)

//@variable The all-time highest `hashRate`.
float maxHashRate = ta.max(hashRate)
//@variable The value `dropThreshold` percent below the `maxHashRate`.
float minHashRate = maxHashRate * (100 - dropThreshold) / 100
//@variable The color of the plot based on the `minHashRate` and `maxHashRate`.
color plotColor = color.from_gradient(hashRate, minHashRate, maxHashRate, color.orange, color.blue)

// Plot the `hashRate`.
plot(hashRate, "Hash Rate Estimate", plotColor, style = plot.style_area)
`request.financial()`
Financial metrics provide investors with insights about a company’s economic and financial health that are not tangible from solely analyzing its stock prices. TradingView offers a wide variety of financial metrics from FactSet that traders can access via the “Financials” tab in the “Indicators” menu of the chart. Scripts can access available metrics for an instrument directly via the request.financial() function.
This is the function’s signature:
request.financial(symbol, financial_id, period, gaps, ignore_invalid_symbol, currency) → series float
As with the first parameter in request.dividends(),
request.splits(), and
request.earnings(), the symbol parameter in
request.financial() requires an “Exchange:Symbol” pair.
To request financial information for the chart’s ticker ID, use
syminfo.tickerid, as
syminfo.ticker will not work.
The financial_id parameter accepts a “simple string” representing the ID of the requested financial metric. TradingView has
numerous financial metrics to choose from. See the Financial IDs
section below for an overview of all accessible metrics and their “string” identifiers.
The period parameter specifies the fiscal period for which new requested data comes in. It accepts one of the following arguments:
“FQ” (quarterly), “FH” (semiannual), “FY” (annual), or “TTM” (trailing twelve months). Not all fiscal periods are available for
all metrics or instruments. To confirm which periods are available for specific metrics, see the second column of the tables in the
Financial IDs section.
See this page’s Common characteristics section for a detailed explanation of
this function’s gaps, ignore_invalid_symbol, and currency parameters.
It’s important to note that the data retrieved from this function comes in at a fixed frequency, independent of the precise date on which the data is made available within a fiscal period. For a company’s dividends, splits, and earnings per share (EPS) information, one can request data reported on exact dates via request.dividends(), request.splits(), and request.earnings().
This script uses request.financial() to retrieve information
about the income and expenses of a stock’s issuing company and visualize the profitability of its typical business operations. It requests the
“OPER_INCOME”, “TOTAL_REVENUE”, and “TOTAL_OPER_EXPENSE” financial IDs for
the syminfo.tickerid over the latest fiscalPeriod, then
plots the results on the chart:
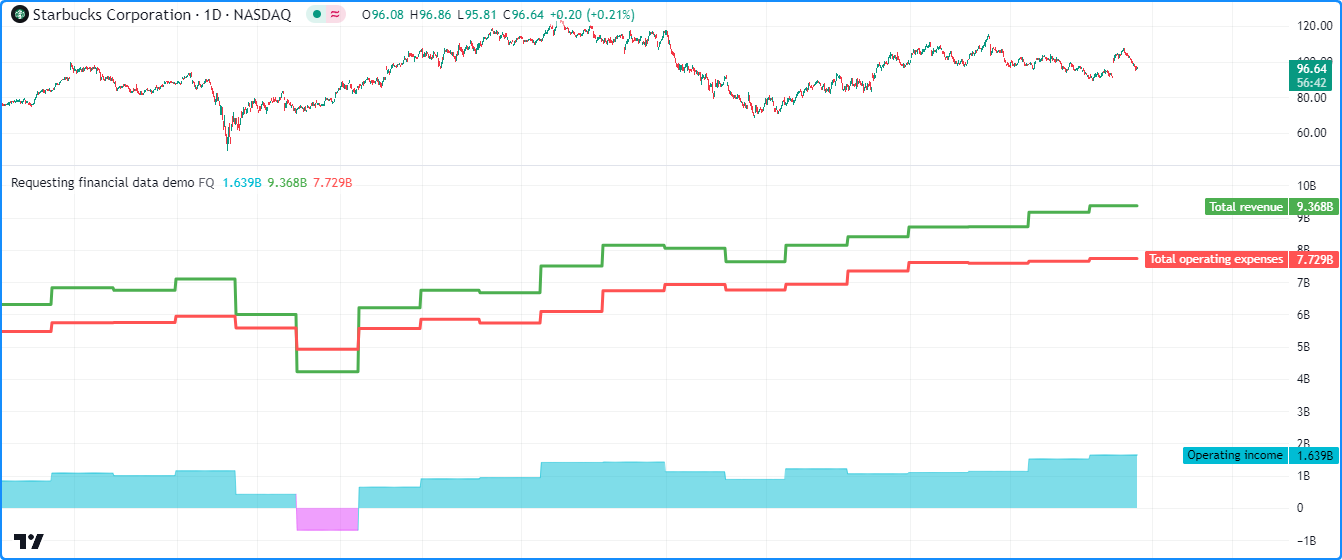
//@version=5
indicator("Requesting financial data demo", format = format.volume)

//@variable The size of the fiscal reporting period. Some options may not be available, depending on the instrument.
string fiscalPeriod = input.string("FQ", "Period", ["FQ", "FH", "FY", "TTM"])

//@variable The operating income after expenses reported for the stock's issuing company.
float operatingIncome = request.financial(syminfo.tickerid, "OPER_INCOME", fiscalPeriod)
//@variable The total revenue reported for the stock's issuing company.
float totalRevenue = request.financial(syminfo.tickerid, "TOTAL_REVENUE", fiscalPeriod)
//@variable The total operating expenses reported for the stock's issuing company.
float totalExpenses = request.financial(syminfo.tickerid, "TOTAL_OPER_EXPENSE", fiscalPeriod)

//@variable Is aqua when the `totalRevenue` exceeds the `totalExpenses`, fuchsia otherwise.
color incomeColor = operatingIncome > 0 ? color.new(color.aqua, 50) : color.new(color.fuchsia, 50)

// Display the requested data.
plot(operatingIncome, "Operating income", incomeColor, 1, plot.style_area)
plot(totalRevenue, "Total revenue", color.green, 3)
plot(totalExpenses, "Total operating expenses", color.red, 3)
- Note that:
- Not all
fiscalPeriodoptions are available for every ticker ID. For example, companies in the US typically publish quarterly reports, whereas many European companies publish semiannual reports. See this page in our Help Center for more information.
- Not all
Calculating financial metrics
The request.financial() function can provide scripts with numerous useful financial metrics that don’t require additional calculations. However, some commonly used financial estimates require combining an instrument’s current market price with requested financial data. Such is the case for:
- Market Capitalization (market price * total shares outstanding)
- Earnings Yield (12-month EPS / market price)
- Price-to-Book Ratio (market price / BVPS)
- Price-to-Earnings Ratio (market price / EPS)
- Price-to-Sales Ratio (market cap / 12-month total revenue)
The following script contains user-defined functions that calculate the above financial metrics
for the syminfo.tickerid. We’ve created these
functions so users can easily copy them into their scripts. This example uses them within a
str.format() call to construct a tooltipText,
which it displays in tooltips on the chart using labels. Hovering over any bar’s
label will expose the tooltip containing the metrics
calculated on that bar:
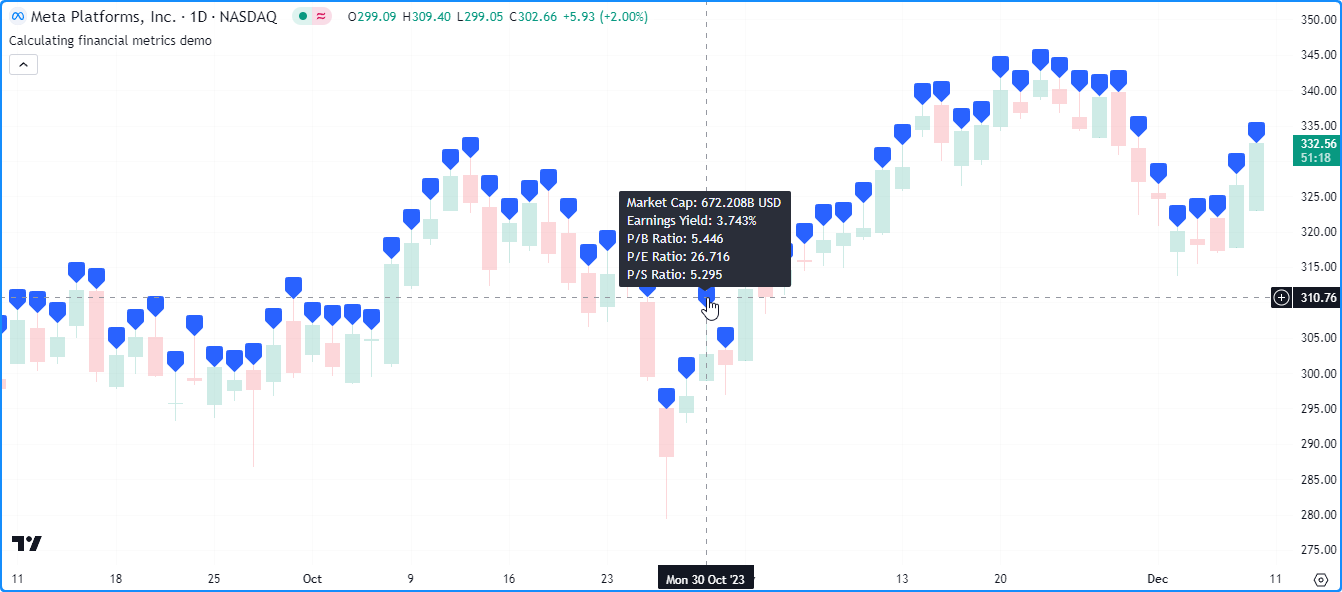
//@version=5
indicator("Calculating financial metrics demo", overlay = true, max_labels_count = 500)

//@function Calculates the market capitalization (market cap) for the chart's symbol.
marketCap() =>
    //@variable The most recent number of outstanding shares reported for the symbol.
    float totalSharesOutstanding = request.financial(syminfo.tickerid, "TOTAL_SHARES_OUTSTANDING", "FQ")
    // Return the market cap value.
    totalSharesOutstanding * close

//@function Calculates the Earnings Yield for the chart's symbol.
earningsYield() =>
    //@variable The most recent 12-month earnings per share reported for the symbol.
    float eps = request.financial(syminfo.tickerid, "EARNINGS_PER_SHARE", "TTM")
    //Return the Earnings Yield percentage.
    100.0 * eps / close

//@function Calculates the Price-to-Book (P/B) ratio for the chart's symbol.
priceBookRatio() =>
    //@variable The most recent Book Value Per Share (BVPS) reported for the symbol.
    float bookValuePerShare = request.financial(syminfo.tickerid, "BOOK_VALUE_PER_SHARE", "FQ")
    // Return the P/B ratio.
    close / bookValuePerShare

//@function Calculates the Price-to-Earnings (P/E) ratio for the chart's symbol.
priceEarningsRatio() =>
    //@variable The most recent 12-month earnings per share reported for the symbol.
    float eps = request.financial(syminfo.tickerid, "EARNINGS_PER_SHARE", "TTM")
    // Return the P/E ratio.
    close / eps

//@function Calculates the Price-to-Sales (P/S) ratio for the chart's symbol.
priceSalesRatio() =>
    //@variable The most recent number of outstanding shares reported for the symbol.
    float totalSharesOutstanding = request.financial(syminfo.tickerid, "TOTAL_SHARES_OUTSTANDING", "FQ")
    //@variable The most recent 12-month total revenue reported for the symbol.
    float totalRevenue = request.financial(syminfo.tickerid, "TOTAL_REVENUE", "TTM")
    // Return the P/S ratio.
    totalSharesOutstanding * close / totalRevenue

//@variable The text to display in label tooltips.
string tooltipText = str.format(
     "Market Cap: {0} {1}\nEarnings Yield: {2}%\nP/B Ratio: {3}\nP/E Ratio: {4}\nP/S Ratio: {5}",
     str.tostring(marketCap(), format.volume), syminfo.currency, earningsYield(), priceBookRatio(),
     priceEarningsRatio(), priceSalesRatio()
 )

//@variable Displays a blank label with a tooltip containing the `tooltipText`.
label info = label.new(chart.point.now(high), tooltip = tooltipText)
- Note that:
- Since not all companies publish quarterly financial reports, one may need to change the “FQ” in these functions to match the minimum reporting period for a specific company, as the request.financial() calls will return na when “FQ” data isn’t available.
Financial IDs
Below is an overview of all financial metrics one can request via request.financial(), along with the periods in which reports may be available. We’ve divided this information into four tables corresponding to the categories displayed in the “Financials” section of the “Indicators” menu:
Each table has the following three columns:
- The first column contains descriptions of each metric with links to Help Center pages for additional information.
- The second column lists the possible
periodarguments allowed for the metric. Note that all available values may not be compatible with specific ticker IDs, e.g., while “FQ” may be a possible argument, it will not work if the issuing company does not publish quarterly data. - The third column lists the “string” IDs for the
financial_idargument in request.financial().
Note
The tables in these sections are quite lengthy, as there are many financial_id arguments available.
Use the “Click to show/hide” option above each table to toggle its visibility.
Income statements
This table lists the available metrics that provide information about a company’s income, costs, profits and losses.
Click to show/hide
| Financial | period |
financial_id |
|---|---|---|
| After tax other income/expense | FQ, FH, FY, TTM | AFTER_TAX_OTHER_INCOME |
| Average basic shares outstanding | FQ, FH, FY | BASIC_SHARES_OUTSTANDING |
| Basic earnings per share (Basic EPS) | FQ, FH, FY, TTM | EARNINGS_PER_SHARE_BASIC |
| Cost of goods sold | FQ, FH, FY, TTM | COST_OF_GOODS |
| Deprecation and amortization | FQ, FH, FY, TTM | DEP_AMORT_EXP_INCOME_S |
| Diluted earnings per share (Diluted EPS) | FQ, FH, FY, TTM | EARNINGS_PER_SHARE_DILUTED |
| Diluted net income available to common stockholders | FQ, FH, FY, TTM | DILUTED_NET_INCOME |
| Diluted shares outstanding | FQ, FH, FY | DILUTED_SHARES_OUTSTANDING |
| Dilution adjustment | FQ, FH, FY, TTM | DILUTION_ADJUSTMENT |
| Discontinued operations | FQ, FH, FY, TTM | DISCONTINUED_OPERATIONS |
| EBIT | FQ, FH, FY, TTM | EBIT |
| EBITDA | FQ, FH, FY, TTM | EBITDA |
| Equity in earnings | FQ, FH, FY, TTM | EQUITY_IN_EARNINGS |
| Gross profit | FQ, FH, FY, TTM | GROSS_PROFIT |
| Interest capitalized | FQ, FH, FY, TTM | INTEREST_CAPITALIZED |
| Interest expense on debt | FQ, FH, FY, TTM | INTEREST_EXPENSE_ON_DEBT |
| Interest expense, net of interest capitalized | FQ, FH, FY, TTM | NON_OPER_INTEREST_EXP |
| Miscellaneous non-operating expense | FQ, FH, FY, TTM | OTHER_INCOME |
| Net income | FQ, FH, FY, TTM | NET_INCOME |
| Net income before discontinued operations | FQ, FH, FY, TTM | NET_INCOME_BEF_DISC_OPER |
| Non-controlling/minority interest | FQ, FH, FY, TTM | MINORITY_INTEREST_EXP |
| Non-operating income, excl. interest expenses | FQ, FH, FY, TTM | NON_OPER_INCOME |
| Non-operating income, total | FQ, FH, FY, TTM | TOTAL_NON_OPER_INCOME |
| Non-operating interest income | FQ, FH, FY, TTM | NON_OPER_INTEREST_INCOME |
| Operating expenses (excl. COGS) | FQ, FH, FY, TTM | OPERATING_EXPENSES |
| Operating income | FQ, FH, FY, TTM | OPER_INCOME |
| Other cost of goods sold | FQ, FH, FY, TTM | COST_OF_GOODS_EXCL_DEP_AMORT |
| Other operating expenses, total | FQ, FH, FY, TTM | OTHER_OPER_EXPENSE_TOTAL |
| Preferred dividends | FQ, FH, FY, TTM | PREFERRED_DIVIDENDS |
| Pretax equity in earnings | FQ, FH, FY, TTM | PRETAX_EQUITY_IN_EARNINGS |
| Pretax income | FQ, FH, FY, TTM | PRETAX_INCOME |
| Research & development | FQ, FH, FY, TTM | RESEARCH_AND_DEV |
| Selling/general/admin expenses, other | FQ, FH, FY, TTM | SELL_GEN_ADMIN_EXP_OTHER |
| Selling/general/admin expenses, total | FQ, FH, FY, TTM | SELL_GEN_ADMIN_EXP_TOTAL |
| Taxes | FQ, FH, FY, TTM | INCOME_TAX |
| Total operating expenses | FQ, FH, FY, TTM | TOTAL_OPER_EXPENSE |
| Total revenue | FQ, FH, FY, TTM | TOTAL_REVENUE |
| Unusual income/expense | FQ, FH, FY, TTM | UNUSUAL_EXPENSE_INC |
Balance sheet
This table lists the metrics that provide information about a company’s capital structure.
Click to show/hide
| Financial | period |
financial_id |
|---|---|---|
| Accounts payable | FQ, FH, FY | ACCOUNTS_PAYABLE |
| Accounts receivable - trade, net | FQ, FH, FY | ACCOUNTS_RECEIVABLES_NET |
| Accrued payroll | FQ, FH, FY | ACCRUED_PAYROLL |
| Accumulated depreciation, total | FQ, FH, FY | ACCUM_DEPREC_TOTAL |
| Additional paid-in capital/Capital surplus | FQ, FH, FY | ADDITIONAL_PAID_IN_CAPITAL |
| Book value per share | FQ, FH, FY | BOOK_VALUE_PER_SHARE |
| Capital and operating lease obligations | FQ, FH, FY | CAPITAL_OPERATING_LEASE_OBLIGATIONS |
| Capitalized lease obligations | FQ, FH, FY | CAPITAL_LEASE_OBLIGATIONS |
| Cash & equivalents | FQ, FH, FY | CASH_N_EQUIVALENTS |
| Cash and short term investments | FQ, FH, FY | CASH_N_SHORT_TERM_INVEST |
| Common equity, total | FQ, FH, FY | COMMON_EQUITY_TOTAL |
| Common stock par/Carrying value | FQ, FH, FY | COMMON_STOCK_PAR |
| Current portion of LT debt and capital leases | FQ, FH, FY | CURRENT_PORT_DEBT_CAPITAL_LEASES |
| Deferred income, current | FQ, FH, FY | DEFERRED_INCOME_CURRENT |
| Deferred income, non-current | FQ, FH, FY | DEFERRED_INCOME_NON_CURRENT |
| Deferred tax assets | FQ, FH, FY | DEFERRED_TAX_ASSESTS |
| Deferred tax liabilities | FQ, FH, FY | DEFERRED_TAX_LIABILITIES |
| Dividends payable | FY | DIVIDENDS_PAYABLE |
| Goodwill, net | FQ, FH, FY | GOODWILL |
| Gross property/plant/equipment | FQ, FH, FY | PPE_TOTAL_GROSS |
| Income tax payable | FQ, FH, FY | INCOME_TAX_PAYABLE |
| Inventories - finished goods | FQ, FH, FY | INVENTORY_FINISHED_GOODS |
| Inventories - progress payments & other | FQ, FH, FY | INVENTORY_PROGRESS_PAYMENTS |
| Inventories - raw materials | FQ, FH, FY | INVENTORY_RAW_MATERIALS |
| Inventories - work in progress | FQ, FH, FY | INVENTORY_WORK_IN_PROGRESS |
| Investments in unconsolidated subsidiaries | FQ, FH, FY | INVESTMENTS_IN_UNCONCSOLIDATE |
| Long term debt | FQ, FH, FY | LONG_TERM_DEBT |
| Long term debt excl. lease liabilities | FQ, FH, FY | LONG_TERM_DEBT_EXCL_CAPITAL_LEASE |
| Long term investments | FQ, FH, FY | LONG_TERM_INVESTMENTS |
| Minority interest | FQ, FH, FY | MINORITY_INTEREST |
| Net debt | FQ, FH, FY | NET_DEBT |
| Net intangible assets | FQ, FH, FY | INTANGIBLES_NET |
| Net property/plant/equipment | FQ, FH, FY | PPE_TOTAL_NET |
| Note receivable - long term | FQ, FH, FY | LONG_TERM_NOTE_RECEIVABLE |
| Notes payable | FY | NOTES_PAYABLE_SHORT_TERM_DEBT |
| Operating lease liabilities | FQ, FH, FY | OPERATING_LEASE_LIABILITIES |
| Other common equity | FQ, FH, FY | OTHER_COMMON_EQUITY |
| Other current assets, total | FQ, FH, FY | OTHER_CURRENT_ASSETS_TOTAL |
| Other current liabilities | FQ, FH, FY | OTHER_CURRENT_LIABILITIES |
| Other intangibles, net | FQ, FH, FY | OTHER_INTANGIBLES_NET |
| Other investments | FQ, FH, FY | OTHER_INVESTMENTS |
| Other long term assets, total | FQ, FH, FY | LONG_TERM_OTHER_ASSETS_TOTAL |
| Other non-current liabilities, total | FQ, FH, FY | OTHER_LIABILITIES_TOTAL |
| Other receivables | FQ, FH, FY | OTHER_RECEIVABLES |
| Other short term debt | FY | OTHER_SHORT_TERM_DEBT |
| Paid in capital | FQ, FH, FY | PAID_IN_CAPITAL |
| Preferred stock, carrying value | FQ, FH, FY | PREFERRED_STOCK_CARRYING_VALUE |
| Prepaid expenses | FQ, FH, FY | PREPAID_EXPENSES |
| Provision for risks & charge | FQ, FH, FY | PROVISION_F_RISKS |
| Retained earnings | FQ, FH, FY | RETAINED_EARNINGS |
| Shareholders’ equity | FQ, FH, FY | SHRHLDRS_EQUITY |
| Short term debt | FQ, FH, FY | SHORT_TERM_DEBT |
| Short term debt excl. current portion of LT debt | FQ, FH, FY | SHORT_TERM_DEBT_EXCL_CURRENT_PORT |
| Short term investments | FQ, FH, FY | SHORT_TERM_INVEST |
| Tangible book value per share | FQ, FH, FY | BOOK_TANGIBLE_PER_SHARE |
| Total assets | FQ, FH, FY | TOTAL_ASSETS |
| Total current assets | FQ, FH, FY | TOTAL_CURRENT_ASSETS |
| Total current liabilities | FQ, FH, FY | TOTAL_CURRENT_LIABILITIES |
| Total debt | FQ, FH, FY | TOTAL_DEBT |
| Total equity | FQ, FH, FY | TOTAL_EQUITY |
| Total inventory | FQ, FH, FY | TOTAL_INVENTORY |
| Total liabilities | FQ, FH, FY | TOTAL_LIABILITIES |
| Total liabilities & shareholders’ equities | FQ, FH, FY | TOTAL_LIABILITIES_SHRHLDRS_EQUITY |
| Total non-current assets | FQ, FH, FY | TOTAL_NON_CURRENT_ASSETS |
| Total non-current liabilities | FQ, FH, FY | TOTAL_NON_CURRENT_LIABILITIES |
| Total receivables, net | FQ, FH, FY | TOTAL_RECEIVABLES_NET |
| Treasury stock - common | FQ, FH, FY | TREASURY_STOCK_COMMON |
Cash flow
This table lists the available metrics that provide information about how cash flows through a company.
Click to show/hide
| Financial | period |
financial_id |
|---|---|---|
| Amortization | FQ, FH, FY, TTM | AMORTIZATION |
| Capital expenditures | FQ, FH, FY, TTM | CAPITAL_EXPENDITURES |
| Capital expenditures - fixed assets | FQ, FH, FY, TTM | CAPITAL_EXPENDITURES_FIXED_ASSETS |
| Capital expenditures - other assets | FQ, FH, FY, TTM | CAPITAL_EXPENDITURES_OTHER_ASSETS |
| Cash from financing activities | FQ, FH, FY, TTM | CASH_F_FINANCING_ACTIVITIES |
| Cash from investing activities | FQ, FH, FY, TTM | CASH_F_INVESTING_ACTIVITIES |
| Cash from operating activities | FQ, FH, FY, TTM | CASH_F_OPERATING_ACTIVITIES |
| Change in accounts payable | FQ, FH, FY, TTM | CHANGE_IN_ACCOUNTS_PAYABLE |
| Change in accounts receivable | FQ, FH, FY, TTM | CHANGE_IN_ACCOUNTS_RECEIVABLE |
| Change in accrued expenses | FQ, FH, FY, TTM | CHANGE_IN_ACCRUED_EXPENSES |
| Change in inventories | FQ, FH, FY, TTM | CHANGE_IN_INVENTORIES |
| Change in other assets/liabilities | FQ, FH, FY, TTM | CHANGE_IN_OTHER_ASSETS |
| Change in taxes payable | FQ, FH, FY, TTM | CHANGE_IN_TAXES_PAYABLE |
| Changes in working capital | FQ, FH, FY, TTM | CHANGES_IN_WORKING_CAPITAL |
| Common dividends paid | FQ, FH, FY, TTM | COMMON_DIVIDENDS_CASH_FLOW |
| Deferred taxes (cash flow) | FQ, FH, FY, TTM | CASH_FLOW_DEFERRED_TAXES |
| Depreciation & amortization (cash flow) | FQ, FH, FY, TTM | CASH_FLOW_DEPRECATION_N_AMORTIZATION |
| Depreciation/depletion | FQ, FH, FY, TTM | DEPRECIATION_DEPLETION |
| Financing activities - other sources | FQ, FH, FY, TTM | OTHER_FINANCING_CASH_FLOW_SOURCES |
| Financing activities - other uses | FQ, FH, FY, TTM | OTHER_FINANCING_CASH_FLOW_USES |
| Free cash flow | FQ, FH, FY, TTM | FREE_CASH_FLOW |
| Funds from operations | FQ, FH, FY, TTM | FUNDS_F_OPERATIONS |
| Investing activities - other sources | FQ, FH, FY, TTM | OTHER_INVESTING_CASH_FLOW_SOURCES |
| Investing activities - other uses | FQ, FH, FY | OTHER_INVESTING_CASH_FLOW_USES |
| Issuance of long term debt | FQ, FH, FY, TTM | SUPPLYING_OF_LONG_TERM_DEBT |
| Issuance/retirement of debt, net | FQ, FH, FY, TTM | ISSUANCE_OF_DEBT_NET |
| Issuance/retirement of long term debt | FQ, FH, FY, TTM | ISSUANCE_OF_LONG_TERM_DEBT |
| Issuance/retirement of other debt | FQ, FH, FY, TTM | ISSUANCE_OF_OTHER_DEBT |
| Issuance/retirement of short term debt | FQ, FH, FY, TTM | ISSUANCE_OF_SHORT_TERM_DEBT |
| Issuance/retirement of stock, net | FQ, FH, FY, TTM | ISSUANCE_OF_STOCK_NET |
| Net income (cash flow) | FQ, FH, FY, TTM | NET_INCOME_STARTING_LINE |
| Non-cash items | FQ, FH, FY, TTM | NON_CASH_ITEMS |
| Other financing cash flow items, total | FQ, FH, FY, TTM | OTHER_FINANCING_CASH_FLOW_ITEMS_TOTAL |
| Other investing cash flow items, total | FQ, FH, FY | OTHER_INVESTING_CASH_FLOW_ITEMS_TOTAL |
| Preferred dividends paid | FQ, FH, FY | PREFERRED_DIVIDENDS_CASH_FLOW |
| Purchase of investments | FQ, FH, FY, TTM | PURCHASE_OF_INVESTMENTS |
| Purchase/acquisition of business | FQ, FH, FY, TTM | PURCHASE_OF_BUSINESS |
| Purchase/sale of business, net | FQ, FH, FY | PURCHASE_SALE_BUSINESS |
| Purchase/sale of investments, net | FQ, FH, FY, TTM | PURCHASE_SALE_INVESTMENTS |
| Reduction of long term debt | FQ, FH, FY, TTM | REDUCTION_OF_LONG_TERM_DEBT |
| Repurchase of common & preferred stock | FQ, FH, FY, TTM | PURCHASE_OF_STOCK |
| Sale of common & preferred stock | FQ, FH, FY, TTM | SALE_OF_STOCK |
| Sale of fixed assets & businesses | FQ, FH, FY, TTM | SALES_OF_BUSINESS |
| Sale/maturity of investments | FQ, FH, FY | SALES_OF_INVESTMENTS |
| Total cash dividends paid | FQ, FH, FY, TTM | TOTAL_CASH_DIVIDENDS_PAID |
Statistics
This table contains a variety of statistical metrics, including commonly used financial ratios.
Click to show/hide
| Financial | period |
financial_id |
|---|---|---|
| Accruals | FQ, FH, FY | ACCRUALS_RATIO |
| Altman Z-score | FQ, FH, FY | ALTMAN_Z_SCORE |
| Asset turnover | FQ, FH, FY | ASSET_TURNOVER |
| Beneish M-score | FQ, FH, FY | BENEISH_M_SCORE |
| Buyback yield % | FQ, FH, FY | BUYBACK_YIELD |
| COGS to revenue ratio | FQ, FH, FY | COGS_TO_REVENUE |
| Cash conversion cycle | FQ, FY | CASH_CONVERSION_CYCLE |
| Cash to debt ratio | FQ, FH, FY | CASH_TO_DEBT |
| Current ratio | FQ, FH, FY | CURRENT_RATIO |
| Days inventory | FQ, FY | DAYS_INVENT |
| Days payable | FQ, FY | DAYS_PAY |
| Days sales outstanding | FQ, FY | DAY_SALES_OUT |
| Debt to EBITDA ratio | FQ, FH, FY | DEBT_TO_EBITDA |
| Debt to assets ratio | FQ, FH, FY | DEBT_TO_ASSET |
| Debt to equity ratio | FQ, FH, FY | DEBT_TO_EQUITY |
| Debt to revenue ratio | FQ, FH, FY | DEBT_TO_REVENUE |
| Dividend payout ratio % | FQ, FH, FY, TTM | DIVIDEND_PAYOUT_RATIO |
| Dividend yield % | FQ, FH, FY | DIVIDENDS_YIELD |
| Dividends per share - common stock primary issue | FQ, FH, FY, TTM | DPS_COMMON_STOCK_PRIM_ISSUE |
| EBITDA margin % | FQ, FH, FY, TTM | EBITDA_MARGIN |
| EPS basic one year growth | FQ, FH, FY, TTM | EARNINGS_PER_SHARE_BASIC_ONE_YEAR_GROWTH |
| EPS diluted one year growth | FQ, FH, FY | EARNINGS_PER_SHARE_DILUTED_ONE_YEAR_GROWTH |
| EPS estimates | FQ, FH, FY | EARNINGS_ESTIMATE |
| Effective interest rate on debt % | FQ, FH, FY | EFFECTIVE_INTEREST_RATE_ON_DEBT |
| Enterprise value | FQ, FH, FY | ENTERPRISE_VALUE |
| Enterprise value to EBIT ratio | FQ, FH, FY | EV_EBIT |
| Enterprise value to EBITDA ratio | FQ, FH, FY | ENTERPRISE_VALUE_EBITDA |
| Enterprise value to revenue ratio | FQ, FH, FY | EV_REVENUE |
| Equity to assets ratio | FQ, FH, FY | EQUITY_TO_ASSET |
| Float shares outstanding | FY | FLOAT_SHARES_OUTSTANDING |
| Free cash flow margin % | FQ, FH, FY | FREE_CASH_FLOW_MARGIN |
| Fulmer H factor | FQ, FY | FULMER_H_FACTOR |
| Goodwill to assets ratio | FQ, FH, FY | GOODWILL_TO_ASSET |
| Graham’s number | FQ, FY | GRAHAM_NUMBERS |
| Gross margin % | FQ, FH, FY, TTM | GROSS_MARGIN |
| Gross profit to assets ratio | FQ, FY | GROSS_PROFIT_TO_ASSET |
| Interest coverage | FQ, FH, FY | INTERST_COVER |
| Inventory to revenue ratio | FQ, FH, FY | INVENT_TO_REVENUE |
| Inventory turnover | FQ, FH, FY | INVENT_TURNOVER |
| KZ index | FY | KZ_INDEX |
| Long term debt to total assets ratio | FQ, FH, FY | LONG_TERM_DEBT_TO_ASSETS |
| Net current asset value per share | FQ, FY | NCAVPS_RATIO |
| Net income per employee | FY | NET_INCOME_PER_EMPLOYEE |
| Net margin % | FQ, FH, FY, TTM | NET_MARGIN |
| Number of employees | FY | NUMBER_OF_EMPLOYEES |
| Operating earnings yield % | FQ, FH, FY | OPERATING_EARNINGS_YIELD |
| Operating margin % | FQ, FH, FY | OPERATING_MARGIN |
| PEG ratio | FQ, FY | PEG_RATIO |
| Piotroski F-score | FQ, FH, FY | PIOTROSKI_F_SCORE |
| Price earnings ratio forward | FQ, FY | PRICE_EARNINGS_FORWARD |
| Price sales ratio forward | FQ, FY | PRICE_SALES_FORWARD |
| Quality ratio | FQ, FH, FY | QUALITY_RATIO |
| Quick ratio | FQ, FH, FY | QUICK_RATIO |
| Research & development to revenue ratio | FQ, FH, FY | RESEARCH_AND_DEVELOP_TO_REVENUE |
| Return on assets % | FQ, FH, FY | RETURN_ON_ASSETS |
| Return on common equity % | FQ, FH, FY | RETURN_ON_COMMON_EQUITY |
| Return on equity % | FQ, FH, FY | RETURN_ON_EQUITY |
| Return on equity adjusted to book value % | FQ, FH, FY | RETURN_ON_EQUITY_ADJUST_TO_BOOK |
| Return on invested capital % | FQ, FH, FY | RETURN_ON_INVESTED_CAPITAL |
| Return on tangible assets % | FQ, FH, FY | RETURN_ON_TANG_ASSETS |
| Return on tangible equity % | FQ, FH, FY | RETURN_ON_TANG_EQUITY |
| Revenue estimates | FQ, FH, FY | SALES_ESTIMATES |
| Revenue one year growth | FQ, FH, FY, TTM | REVENUE_ONE_YEAR_GROWTH |
| Revenue per employee | FY | REVENUE_PER_EMPLOYEE |
| Shares buyback ratio % | FQ, FH, FY | SHARE_BUYBACK_RATIO |
| Sloan ratio % | FQ, FH, FY | SLOAN_RATIO |
| Springate score | FQ, FY | SPRINGATE_SCORE |
| Sustainable growth rate | FQ, FY | SUSTAINABLE_GROWTH_RATE |
| Tangible common equity ratio | FQ, FH, FY | TANGIBLE_COMMON_EQUITY_RATIO |
| Tobin’s Q (approximate) | FQ, FH, FY | TOBIN_Q_RATIO |
| Total common shares outstanding | FQ, FH, FY | TOTAL_SHARES_OUTSTANDING |
| Zmijewski score | FQ, FY | ZMIJEWSKI_SCORE |
`request.economic()`
The request.economic() function provides scripts with the ability to retrieve economic data for a specified country or region, including information about the state of the economy (GDP, inflation rate, etc.) or of a particular industry (steel production, ICU beds, etc.).
Below is the signature for this function:
request.economic(country_code, field, gaps, ignore_invalid_symbol) → series float
The country_code parameter accepts a “simple string” representing the identifier of the country or region to request economic
data for (e.g., “US”, “EU”, etc.). See the Country/region codes
section for a complete list of codes this function supports. Note that the economic metrics available depend on the country or region
specified in the function call.
The field parameter specifies the metric the function will request. The Field codes
section covers all accessible metrics and the countries/regions they’re available for.
For a detailed explanation on the last two parameters of this function, see the Common characteristics section at the top of this page.
This simple example requests the growth rate of the Gross Domestic Product (“GDPQQ”) for the United States (“US”) using request.economic(), then plots its value on the chart with a gradient color:
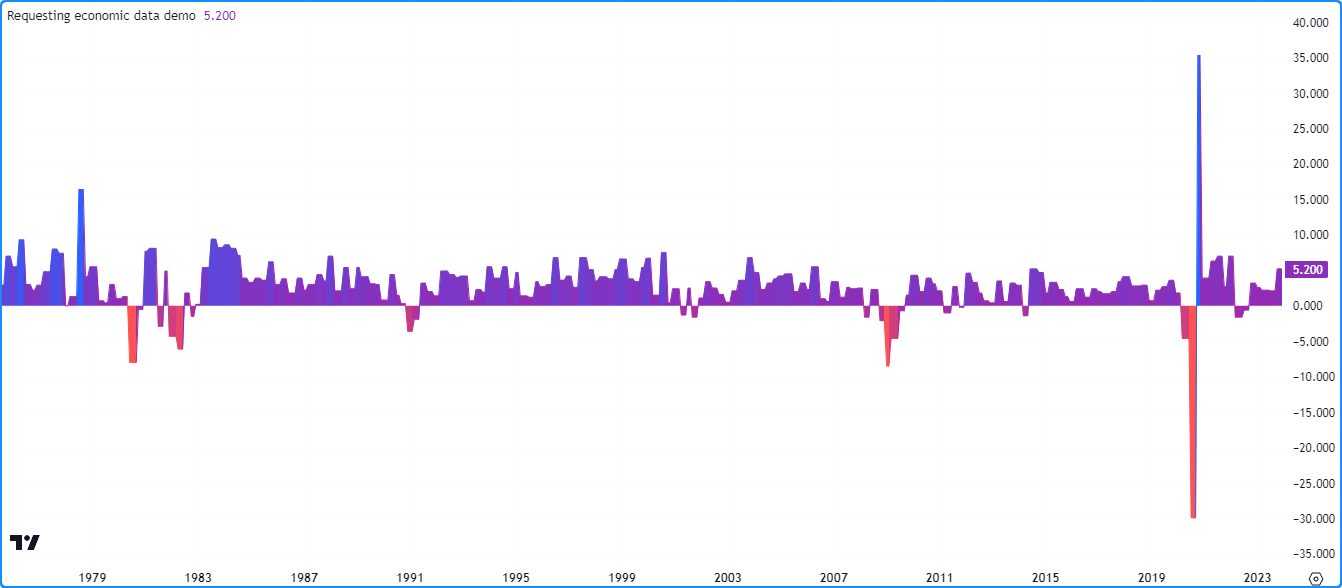
//@version=5
indicator("Requesting economic data demo")

//@variable The GDP growth rate for the US economy.
float gdpqq = request.economic("US", "GDPQQ")

//@variable The all-time maximum growth rate.
float maxRate = ta.max(gdpqq)
//@variable The all-time minimum growth rate.
float minRate = ta.min(gdpqq)

//@variable The color of the `gdpqq` plot.
color rateColor = switch
    gdpqq >= 0 => color.from_gradient(gdpqq, 0, maxRate, color.purple, color.blue)
    =>            color.from_gradient(gdpqq, minRate, 0, color.red, color.purple)

// Plot the results.
plot(gdpqq, "US GDP Growth Rate", rateColor, style = plot.style_area)
- Note that:
- This example does not include a
gapsargument in the request.economic() call, so the function uses the default barmerge.gaps_off. In other words, it returns the last retrieved value when new data isn’t yet available.
- This example does not include a
Note
The tables in the sections below are rather large, as there are numerous country_code and field arguments available.
Use the “Click to show/hide” option above each table to toggle its visibility.
Country/region codes
The table in this section lists all country/region codes available for use with request.economic(). The first column of the table contains the “string” values that represent the country or region code, and the second column contains the corresponding country/region names.
It’s important to note that the value used as the country_code argument determines which
field codes are accessible to the function.
Click to show/hide
country_code |
Country/region name |
|---|---|
| AF | Afghanistan |
| AL | Albania |
| DZ | Algeria |
| AD | Andorra |
| AO | Angola |
| AG | Antigua and Barbuda |
| AR | Argentina |
| AM | Armenia |
| AW | Aruba |
| AU | Australia |
| AT | Austria |
| AZ | Azerbaijan |
| BS | Bahamas |
| BH | Bahrain |
| BD | Bangladesh |
| BB | Barbados |
| BY | Belarus |
| BE | Belgium |
| BZ | Belize |
| BJ | Benin |
| BM | Bermuda |
| BT | Bhutan |
| BO | Bolivia |
| BA | Bosnia and Herzegovina |
| BW | Botswana |
| BR | Brazil |
| BN | Brunei |
| BG | Bulgaria |
| BF | Burkina Faso |
| BI | Burundi |
| KH | Cambodia |
| CM | Cameroon |
| CA | Canada |
| CV | Cape Verde |
| KY | Cayman Islands |
| CF | Central African Republic |
| TD | Chad |
| CL | Chile |
| CN | China |
| CO | Colombia |
| KM | Comoros |
| CG | Congo |
| CR | Costa Rica |
| HR | Croatia |
| CU | Cuba |
| CY | Cyprus |
| CZ | Czech Republic |
| DK | Denmark |
| DJ | Djibouti |
| DM | Dominica |
| DO | Dominican Republic |
| TL | East Timor |
| EC | Ecuador |
| EG | Egypt |
| SV | El Salvador |
| GQ | Equatorial Guinea |
| ER | Eritrea |
| EE | Estonia |
| ET | Ethiopia |
| EU | Euro area |
| FO | Faroe Islands |
| FJ | Fiji |
| FI | Finland |
| FR | France |
| GA | Gabon |
| GM | Gambia |
| GE | Georgia |
| DE | Germany |
| GH | Ghana |
| GR | Greece |
| GL | Greenland |
| GD | Grenada |
| GT | Guatemala |
| GN | Guinea |
| GW | Guinea Bissau |
| GY | Guyana |
| HT | Haiti |
| HN | Honduras |
| HK | Hong Kong |
| HU | Hungary |
| IS | Iceland |
| IN | India |
| ID | Indonesia |
| IR | Iran |
| IQ | Iraq |
| IE | Ireland |
| IM | Isle of Man |
| IL | Israel |
| IT | Italy |
| CI | Ivory Coast |
| JM | Jamaica |
| JP | Japan |
| JO | Jordan |
| KZ | Kazakhstan |
| KE | Kenya |
| KI | Kiribati |
| XK | Kosovo |
| KW | Kuwait |
| KG | Kyrgyzstan |
| LA | Laos |
| LV | Latvia |
| LB | Lebanon |
| LS | Lesotho |
| LR | Liberia |
| LY | Libya |
| LI | Liechtenstein |
| LT | Lithuania |
| LU | Luxembourg |
| MO | Macau |
| MK | Macedonia |
| MG | Madagascar |
| MW | Malawi |
| MY | Malaysia |
| MV | Maldives |
| ML | Mali |
| MT | Malta |
| MR | Mauritania |
| MU | Mauritius |
| MX | Mexico |
| MD | Moldova |
| MC | Monaco |
| MN | Mongolia |
| ME | Montenegro |
| MA | Morocco |
| MZ | Mozambique |
| MM | Myanmar |
| NA | Namibia |
| NP | Nepal |
| NL | Netherlands |
| NC | New Caledonia |
| NZ | New Zealand |
| NI | Nicaragua |
| NE | Niger |
| NG | Nigeria |
| KP | North Korea |
| NO | Norway |
| OM | Oman |
| PK | Pakistan |
| PS | Palestine |
| PA | Panama |
| PG | Papua New Guinea |
| PY | Paraguay |
| PE | Peru |
| PH | Philippines |
| PL | Poland |
| PT | Portugal |
| PR | Puerto Rico |
| QA | Qatar |
| CD | Republic of the Congo |
| RO | Romania |
| RU | Russia |
| RW | Rwanda |
| WS | Samoa |
| SM | San Marino |
| ST | Sao Tome and Principe |
| SA | Saudi Arabia |
| SN | Senegal |
| RS | Serbia |
| SC | Seychelles |
| SL | Sierra Leone |
| SG | Singapore |
| SK | Slovakia |
| SI | Slovenia |
| SB | Solomon Islands |
| SO | Somalia |
| ZA | South Africa |
| KR | South Korea |
| SS | South Sudan |
| ES | Spain |
| LK | Sri Lanka |
| LC | St Lucia |
| VC | St Vincent and the Grenadines |
| SD | Sudan |
| SR | Suriname |
| SZ | Swaziland |
| SE | Sweden |
| CH | Switzerland |
| SY | Syria |
| TW | Taiwan |
| TJ | Tajikistan |
| TZ | Tanzania |
| TH | Thailand |
| TG | Togo |
| TO | Tonga |
| TT | Trinidad and Tobago |
| TN | Tunisia |
| TR | Turkey |
| TM | Turkmenistan |
| UG | Uganda |
| UA | Ukraine |
| AE | United Arab Emirates |
| GB | United Kingdom |
| US | United States |
| UY | Uruguay |
| UZ | Uzbekistan |
| VU | Vanuatu |
| VE | Venezuela |
| VN | Vietnam |
| YE | Yemen |
| ZM | Zambia |
| ZW | Zimbabwe |
Field codes
The table in this section lists the field codes available for use with
request.economic(). The first column
contains the “string” values used as the field argument, and the second column contains names of each metric and
links to our Help Center with additional information, including the countries/regions they’re available for.
Click to show/hide
`request.seed()`
TradingView aggregates a vast amount of data from its many providers, including price and volume information on tradable instruments, financials, economic data, and more, which users can retrieve in Pine Script™ using the functions discussed in the sections above, as well as multiple built-in variables.
To further expand the horizons of possible data one can analyze on TradingView, we have Pine Seeds, which allows users to supply custom user-maintained EOD data feeds via GitHub for use on TradingView charts and within Pine Script™ code.
Note
This section contains only a brief overview of Pine Seeds. For in-depth information about Pine Seeds functionality, setting up a repo, data formats, and more, consult the documentation here.
To retrieve data from a Pine Seeds data feed within a script, one can use the request.seed() function.
Below is the function’s signature:
request.seed(source, symbol, expression, ignore_invalid_symbol) → series <type>
The source parameter specifies the unique name of the user-maintained GitHub repository that contains the data feed. For details on
creating a repo, see this page.
The symbol parameter represents the file name from the “data/” directory of the source repository, excluding the “.csv” file
extension. See this page for information about the structure
of the data stored in repositories.
The expression parameter is the series to evaluate using data extracted from the requested context. It is similar to the equivalent
in request.security() and
request.security_lower_tf(). Data feeds stored
in user-maintained repos contain time,
open, high,
low, close,
and volume information, meaning expressions used as the expression
argument can use the corresponding built-in variables, including variables derived from them (e.g.,
bar_index, ohlc4,
etc.) to request their values from the context of the custom data.
Note
As with request.security() and
request.security_lower_tf(),
request.seed() duplicates the scopes necessary to
evaluate its expression in another context, which contributes toward compilation limits and script memory demands. See the
Limitations page’s section on scope count limits
for more information.
The script below visualizes sample data from the seed_crypto_santiment demo repo. It uses two calls to request.seed() to retrieve the close values from the repo’s BTC_SENTIMENT_POSITIVE_TOTAL and BTC_SENTIMENT_NEGATIVE_TOTAL data feeds and plots the results on the chart as step lines:
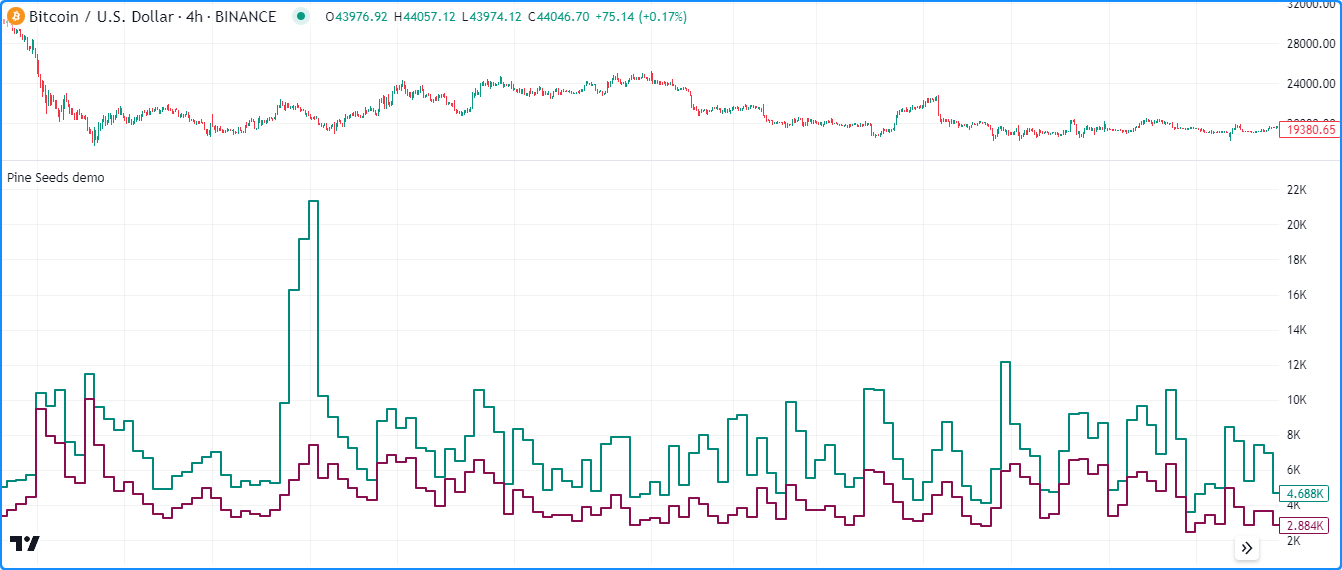
//@version=5
indicator("Pine Seeds demo", format=format.volume)

//@variable The total positive sentiment for BTC extracted from the "seed_crypto_santiment" repository.
float positiveTotal = request.seed("seed_crypto_santiment", "BTC_SENTIMENT_POSITIVE_TOTAL", close)
//@variable The total negative sentiment for BTC extracted from the "seed_crypto_santiment" repository.
float negativeTotal = request.seed("seed_crypto_santiment", "BTC_SENTIMENT_NEGATIVE_TOTAL", close)

// Plot the data.
plot(positiveTotal, "Positive sentiment", color.teal, 2, plot.style_stepline)
plot(negativeTotal, "Negative sentiment", color.maroon, 2, plot.style_stepline)
- Note that:
- This example requests data from the repo highlighted in the Pine Seeds documentation. It exists solely for example purposes, and its data does not update on a regular basis.
- Unlike most other
request.*()functions, request.seed() does not have agapsparameter. It will always return na values when no new data exists. - Pine Seeds data is searchable from the chart’s symbol search bar. To load a data feed on the chart, enter the “Repo:File” pair, similar to searching for an “Exchange:Symbol” pair.