DXY nearing key rising channel trend lineIntraday Update: The DXY rising trend line comes in at 104.20, it is key channel support for bulls near term.
Market indices

China A50 UpsideYou can wait for the consumer confidence to come out in the US session for a more conservative play but we have a technical entry and upside potential for China who is leading the upside in the last 3 months.

NIFTY PROBABLE SELL Recovery of full Candle Expected as Buyers will lose confidence and Look for Next Demand.

US30 Short positionHigher timeframes are showing a bearish momentum. the 2H timeframe has been n consolidation.


S&P 500 Tests 5,300 as Inflation Eases, Fed Policy in FocusThe market remains cautiously optimistic as the S&P 500 tests the 5300 resistance level. The deceleration in inflation is promising, yet the Federal Reserve's future monetary policy remains uncertain. Investors should stay vigilant, monitoring economic data and Fed communications to navigate potential volatility and capitalize on market opportunities.
* S&P 500 at Resistance: The index tests 5,300 amid recent inflation data.
* Inflation Slowdown: Core CPI rose just 0.3% in April, the slowest pace in 3 years. This boosted stocks, with the S&P 500 reaching a new high.
* Fed Policy: The Fed may hold steady on rates in the near term, but a September cut is increasingly likely if inflation continues to moderate.
* Key Upcoming Data: The PCE price index (will released this week) and future inflation reports will be crucial for gauging the Fed's policy stance.
* Market Outlook: Cautious optimism prevails as investors weigh the inflation slowdown and potential Fed actions.

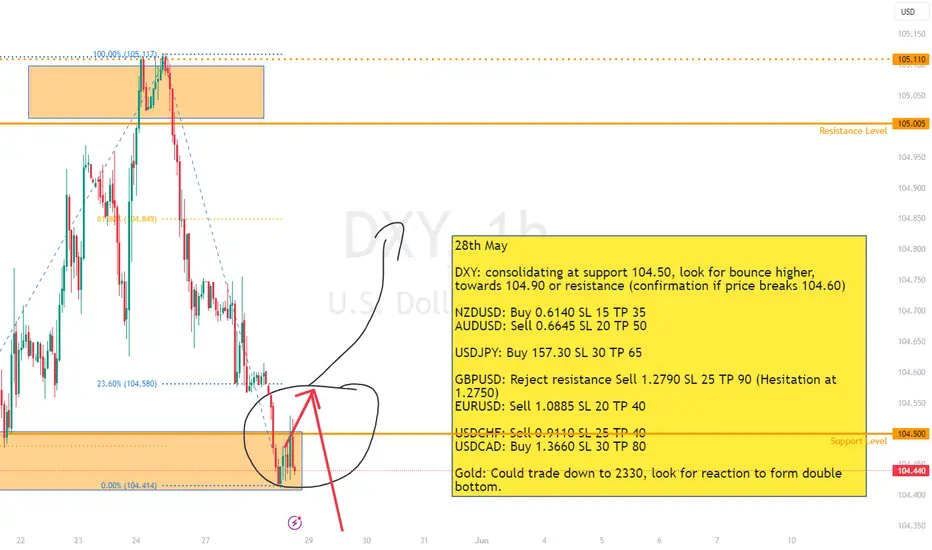
Levels discussed during livestream 28th May28th May
DXY: consolidating at support 104.50, look for bounce higher, towards 104.90 or resistance (confirmation if price breaks 104.60)
NZDUSD: Buy 0.6140 SL 15 TP 35
AUDUSD: Sell 0.6645 SL 20 TP 50
USDJPY: Buy 157.30 SL 30 TP 65
GBPUSD: Reject resistance Sell 1.2790 SL 25 TP 90 (Hesitation at 1.2750)
EURUSD: Sell 1.0885 SL 20 TP 40
USDCHF: Sell 0.9110 SL 25 TP 40
USDCAD: Buy 1.3660 SL 30 TP 80
Gold: Could trade down to 2330, look for reaction to form double bottom.
NASDAQ Pair : US100 - Nasdaq
Description :
Completed " 12345 " Impulsive Waves
Break of Structure
RSI - Divergence
Exp FIAT as an Corrective Pattern in Short Time Frame
Fibonacci Level - 261.8%

EGX30 : between relative weight and geopolitical tensionsThe EGX30 index, a benchmark for the Egyptian stock market, faces a critical challenge: the concentration of its weight among a few large companies. As of May 28, 2024, the top three constituents – Commercial International Bank (CIB), Talaat Moustafa Group, and Sweden Electronics – account for a staggering 50% of the index's weight. This excessive concentration raises serious concerns about the index's overall stability and its ability to accurately reflect the broader market performance.
Addressing Weight Imbalance: A Call for Action
To address this pressing weight concentration issue, the Egyptian government must take proactive measures to encourage diversification among index constituents. This could involve supporting mergers and acquisitions among smaller companies, actively promoting the listing of new companies, and potentially adjusting the index methodology to reduce the outsized influence of individual stocks.
Political Tensions: A Lingering Shadow
Political tensions in Egypt continue to cast a long shadow over the stock market, creating an environment of uncertainty and risk. The lack of a clear resolution to these tensions weighs heavily on investor sentiment, hindering long-term investment decisions and dampening market growth prospects.
Technical Analysis: Gauging Market Direction
From a technical analysis perspective, the EGX30 index is currently facing resistance at the 27,650 level and support at the 24,235 level. This suggests that the index is likely to experience horizontal movement in the near term, with potential for breakouts in either direction depending on the resolution of the underlying factors affecting the market.

DXY - Are You Ready?📈Hello TradingView Family / Fellow Traders. This is Richard, also known as theSignalyst.
📉 DXY has been overall bullish trading within the rising channel marked in red.
Currently, it is undergoing a correction phase, and approaching the lower bound of the channel.
Moreover, it is retesting a strong demand zone highlighted in orange.
🏹 Thus, the highlighted blue circle is a strong area to look for buy setups as it is the intersection of the orange demand and lower red trendline.
📚 As per my trading style:
As #DXY is hovering around the blue circle zone, I will be looking for bullish reversal setups (like a double bottom pattern, trendline break , and so on...)
📚 Always follow your trading plan regarding entry, risk management, and trade management.
Good luck!
All Strategies Are Good; If Managed Properly!
~Rich

FTSE(UK100As I see it, as long as we stay above 7600-7700 a pump to 8k is a lot more likely as there's evidently buyers in the market keeping the FTSE floating, where as a break below will send this south (7400 or lower).

Risky short before NY sessionI expect little short from lower high before NY session for 50 pips. Lets see...RRR 2/5, CMOOON.


Fascinating junction for DXYWe can see DXY has again rejected off the falling daily trendline (green), last week we formed a bear candle and have broken out below, currently printing a third bear candle in a row (daily).
Even though US Data and narrative suggest higher for longer (and maybe even a hike, although I doubt that) the USD has not responded in kind.
We're approaching a couple of critical areas:
1. 104.3 - intersection of the rising weekly trendline (red)
2. 104.1 - supply zone
With the local trend bearish, more positivity coming out of Europe I think we could see DXY break through these barriers and ultimately retest the longer running monthly falling trendline (white).
We have a negative MACD and not yet oversold (Daily).
Of course, the US Economy is looking strong and the FED thinks they can afford to keep rates higher for longer, so any kind of a push up from here will see the daily fall line (green) broken and a new HH.
Will this be allowed to happen?
As always, I never trade DXY but it is critical to watch as dictates so many of the crosses next moves.

✅DAX BULLISH SETUP|LONG🚀
✅DAX is going up now
While trading in an uptrend
And our bullish bias is
Reinforced buy the recent
Confirmed breakout of the
Key horizontal level of 18,500
Which was then retested and
Became a support therefore
We will be expecting a
Further move up
LONG🚀
✅Like and subscribe to never miss a new idea!✅

Next Target is the Trendline Top. Expect Breakout Wedge PatternRising Wedge Pattern has formed and Next Target is the Trendline Top. If Breakout Rising Wedge Pattern, then the 2nd Target is 44000 (+135 %).
I want to help people to Make Profit all over the World.

US30 shortsWeekly;
Price has closed with a very bearish candlestick
The next liquidity zone is 38750
I expect price to head there, but there has to be some orders collected before price goes to the designated region
Daily;
Price has closed below a daily region and retested it on Friday
Price is heading towards 38750 but orders have to be collected first in the new weekly cycle
4 hour;
I believe that price will collect orders at the previous region and then sell off.
Waiting for sell confirmation


Dollar Index (DXY): Bearish Pressure Remains 💵
Looks like Dollar Index completed the correctional movement
and ready to go down again.
I see a bearish flag pattern with a confirmed violation of its support on 4H.
The market may reach 104.2 soon.
❤️Please, support my work with like, thank you!❤️

DOLLAR INDEX - BEARISH SCENARIO 📉Hello Traders !
On Wednesday 22 May, The Dollar Index reached a resistance level (105.123 - 104.915) and failed to break it!
Let's expect the bearish scenario:
If the price breaks and closes below the higher low
We will see a bearish move📉
-------------
TARGET: 104.210🎯

DXY will go down BTC pump expected ALL trading ideas have entry point + stop loss + take profit + Risk level.
hello Traders, here is the full analysis for this pair, let me know in the comment section below if you have any questions, the entry will be taken only if all rules of the strategies will be satisfied. I suggest you keep this pair on your watchlist and see if the rules of your strategy are satisfied. Please also refer to the Important Risk Notice linked below.
Disclaimer

DXY Will Go Down! Short!
Please, check our technical outlook for DXY.
Time Frame: 9h
Current Trend: Bearish
Sentiment: Overbought (based on 7-period RSI)
Forecast: Bearish
The market is approaching a significant resistance area 104.719.
Due to the fact that we see a positive bearish reaction from the underlined area, I strongly believe that sellers will manage to push the price all the way down to 104.038 level.
P.S
The term oversold refers to a condition where an asset has traded lower in price and has the potential for a price bounce.
Overbought refers to market scenarios where the instrument is traded considerably higher than its fair value. Overvaluation is caused by market sentiments when there is positive news.
Like and subscribe and comment my ideas if you enjoy them!

DXY bearish, has SHS patternDXY will bearish, has SHS pattern dan already retest.
Lets See
Happy Trading
Disclaimer On
