SPX - Inflection Point, Bearish OrientationFailure to break through shows that the upward movement in the index is exhausted and should correct. Fibo clouds at lower levels confirm a significant increase in the probability of a reversal in the progression of the candles.
Market indices

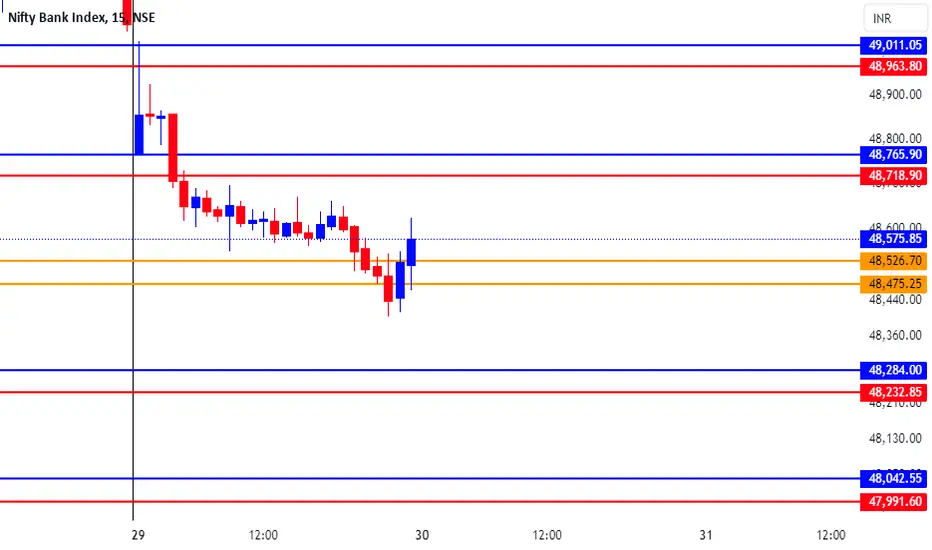
Trade plan for today BNAKNIFTY important/Intraday levels.Trade plan for today. BNAKNIFTY important/Intraday levels.
No Price Action
No Support and Resistance
No Indicators
No Moving Averages
Not Gann levels These levels are purely based on mathematics.
If it is useful please give your comment.

BANK-NIFTY TRADING LEVELS FOR 30-05-2024Explanation:
This is a very useful trading system. This means that you should not take a trade blindly, but rather that there is another confirmation to take the trade you can use this for perfect entry and perfect exit
This trading opportunity is based on volume, previous price, and price range , are included
Entry/Exit point's:
- It has very easy entry and exit points
- In this pair of lines with two colors are given (RED AND BLUE)
- In this the blue line is used to take long entry and the red line is used to take short entry (But it is all based on a more conformation from your trading plan)
Stop Loss/Take Profit:
Stop Loss
- According to this, if you take a long trade, its stop loss will be the red line just below ( A trade can exit either when the price crosses the red line or the 5 minute candlestick crosses the red line. (This can be done according to your preference) )
- A short entry should use the opposite rules to a long entry
Take Profit
-When you take a long entry according to the profit to be booked is on the next red line above. ( Or if there are other reasons, it can be a safe exit )
- Opposite rules for booking profit on long entry are to book profit on short trade. ( The blue line above is the stop loss of short entry )
Timeframe:
According to this, the time frame you should use while taking trades is 5 minutes time frames . (5 minute time frame works well in this)
Risk Disclaimer:
Trading carries significant risk and is not suitable for all traders. You may lose some or all of your capital in a matter of minutes or hours. Market conditions can change rapidly, and prices can move against you quickly. You may not always be able to exit at a favorable price, and you may be required to hold a position overnight, exposing yourself to additional risk. Day trading involves high risk, high leverage, and high stakes, and you should only trade with funds you can afford to lose. Please carefully consider your financial situation, risk tolerance, and trading objectives before engaging in day trading.
Engagement:
Share your insights, ask questions, and learn from others in the community. Whether you're a seasoned pro or just starting out, we're all in this together.
What's your take on the current market conditions? Which trading strategies are working for you? Let's discuss and help each other grow as traders!
Comment below and let's get the conversation started!
Original Content:
This trading setup is the result of my own innovation and expertise, and is not based on any publicly available information or third-party systems. It is a reflection of my dedication to developing a competitive edge in the markets.
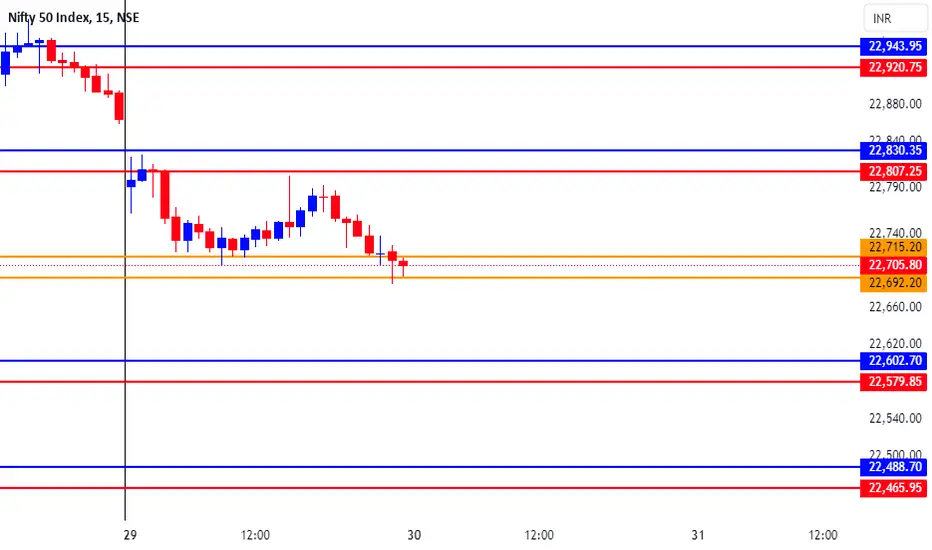
NIFTY TRADING LEVELS FOR 30-05-2024Explanation:
This is a very useful trading system. This means that you should not take a trade blindly, but rather that there is another confirmation to take the trade you can use this for perfect entry and perfect exit
This trading opportunity is based on volume, previous price, and price range , are included
Entry/Exit point's:
- It has very easy entry and exit points
- In this pair of lines with two colors are given (RED AND BLUE)
- In this the blue line is used to take long entry and the red line is used to take short entry (But it is all based on a more conformation from your trading plan)
Stop Loss/Take Profit:
Stop Loss
- According to this, if you take a long trade, its stop loss will be the red line just below ( A trade can exit either when the price crosses the red line or the 5 minute candlestick crosses the red line. (This can be done according to your preference) )
- A short entry should use the opposite rules to a long entry
Take Profit
-When you take a long entry according to the profit to be booked is on the next red line above. ( Or if there are other reasons, it can be a safe exit )
- Opposite rules for booking profit on long entry are to book profit on short trade. ( The blue line above is the stop loss of short entry )
Timeframe:
According to this, the time frame you should use while taking trades is 5 minutes time frames . (5 minute time frame works well in this)
Risk Disclaimer:
Trading carries significant risk and is not suitable for all traders. You may lose some or all of your capital in a matter of minutes or hours. Market conditions can change rapidly, and prices can move against you quickly. You may not always be able to exit at a favorable price, and you may be required to hold a position overnight, exposing yourself to additional risk. Day trading involves high risk, high leverage, and high stakes, and you should only trade with funds you can afford to lose. Please carefully consider your financial situation, risk tolerance, and trading objectives before engaging in day trading.
Engagement:
Share your insights, ask questions, and learn from others in the community. Whether you're a seasoned pro or just starting out, we're all in this together.
What's your take on the current market conditions? Which trading strategies are working for you? Let's discuss and help each other grow as traders!
Comment below and let's get the conversation started!
Original Content:
This trading setup is the result of my own innovation and expertise, and is not based on any publicly available information or third-party systems. It is a reflection of my dedication to developing a competitive edge in the markets.
Dow Jones is suffering between two levelsThere are about 500 pips left to reach the suffering floor, from there you can take a bite for the suffering ceiling

US100 BUYNasdaq is at final buy zone worthy position use sl ...
If break the point never look for buy
Trail sl every 35 pips

NIFTYBANK: Above Water, below Dar Clouds!The best does the move in leading the worst, that tells the story or sums up the story. While optically, we are near where we should not have been in the first place.
The rise past 49200. a classical trap to the bulls than to the bears the trap of 48350 break. Thus, the bulls will be hoping to hold that base, previously the top.
With Global Cues, weak, fast faded RBI Dividend story, we all know, come past the elections, prices will move higher, US dollar higher, US yields unfortunately higher than one could have wished for.
A close today below 48200 warns deeper move down, (hopefully month end expiry can hold), despite the expiry yesterday, this one fell near the lows.
Europe inflation flat, our Money Supply numbers not much of iteration, US Richmond Manufacturing rise, the chorus of no rate cut gets louder, and the whispers of rate hike mount!
US GDP later in the day, and we have our own EXIT Polls in the week-end and bigger event ahead.
Mangeble size is always less stressed aspect, and this time is no different. Choose what fits your style.
Supports 48450-48350-48250
Supply 48780-48980-49150

Nifty Analysis 30 may expiry Huge calls are added above and at 23000
puts are added but are less in compared to calls suggesting downtrend but in intraday puts might get added as market moved significantly lower
so market might jump a little and may short again
It would be good to sell call once price moves up or short strangle 23000 and 22500 with strict SL of 1.5% of capital or as per your risk appetite

NIFTY: Exit - Door!Markets are a maze, but those who can infer the patterns and path, it can be mesmerising. True, sometimes you have hits sometimes you have misses, never the miss in the direction.
Pull any chart of any sector, they look heavy and calling for help.
We pulled some, one is here, doing it the PREPP TO POLLS later in the day.
The top left-hand corner is the bi-weekly frame,
1. Up move did not move towards the top end of the supply channel, flag 1
2. Evening Star pattern printed flag 2
3. Close below 22780 flag 3.
Now come to the right-hand corner of the graph, this is the pattern that unfolding just before the 2004 election, history repeats or rhymes? so much similar. Is this sufficient, or does one need more proof aka hope?
Suffice to say, the waves are volatile, the tide is tough, money saved is money made. Global cues weak, US yield spooking the market, third auction meets the tail wind.
Sell in May and go-way comes to our shores? who knows, if we have heat like that of Middle East, why not sentiment like the West?
For the bulls the body is still green, large lower wicks, the fall is opportunity to buy than sell here. Long term is all rosy, but short term is opportunity. Ask those who lived in those times, did they do what they are supposed to do, or will you do what you are supposed to do.
Suffice to say 22930 caps while 22500 stares. Month End Expiry in motion.
Supports 22630-22580-22530
Supply 22780-22830-22880-22930

Where does NAS seem to go in next two months? (Macro Analysis)Fellas, lets talk about NAS Forecast and try to see what can we expect in the coming two months, JUN and JUL 2024.
The Bullish trend that started from JAN 2023 continues and NAS makes an All Time High at a level of 18951.
As per Chart patterns, we notice a very solid ABCD pattern for which the D point projection is at the level of 19300.
As per Time Cycles, the bullish rally continued last time for 86 bars on 1w timeframe (602 days) and this time, so the trend should last for a similar time. This tells us that the current Bullish trend should continue till JUL 2024.
If we talk about Seasonal behavior of NAS, the Index is bullish 5/10 times in JUN, 9/10 times in JUL and 5/10 times in AUG.
Overall, if we combine the above three findings, we conclude that NAS may go sideways in JUN as it went Sideways in MAR-APR this year, but the Bullish trend must continue. The likelihood of NAS going sideways in JUN higher than it going Bearish (falling below 17000).
Its currently at ~18668 and the next major Support levels to watch are 18389, 17858 and 16985
Let's see how it goes, and Plan your trades accordingly.

NIFTY 1DAY price may take a support at green line
we can observe a huge ammount
of volume candle's are making
strong support zone
that i have mark with arrows.
.
.
.
.
.
I Am Not SEBI Registered Analyst. All Post and Levels Posting is only for educational and knowledge purpose. I Am not responsible for your any kind of loss or profit.
No Claim, All Rights Reserved.‼️

Nasdaq Bear Markethave sight of a parallel descending channel on nasdaq. Buckle up! Additions on the top of the channel. Profit taking on the break from channel up. I hypothesize it runs like this for days, but have to keep watchin'

US100 WEEKLY ANALYSISHello, traders here is an analysis of US100 as you can see the price has been in a bullish form for the past weeks so I have conducted support and resistance setup to predict the price direction in the next coming days/weeks, as you can see the price have just broken a resistance zone and now I will look for a pullback to that zone then look for long opportunities.

Dow Jones and SP500The Dow Jones and SP500 CME_MINI:ES1! support our thesis, with the Dow closing below the 50 EMA yesterday. For both indices, the 2021 ATH is a critical short-term target, offering a chance to catch our breath before the final push. Meanwhile, the VIX, though currently low, made an intriguing upward move yesterday, indicating a potential shift in market sentiment shortly.

CHART BREAKDOWN NASDAQ: Key Levels, Targets and Thoughts!Trade Update: GBP/USD
We have some great news on our recent GBP/USD trade! 💲
After analyzing the market conditions and identifying a solid setup, our trade has successfully Hit Take Profit 1 (TP1). This made sure that the majority of our positions have been secured and cashed out some of our gains, allowing us to lock in profits and reduce risk.
Following this, we moved our stop loss to breakeven to ensure no loss on the remaining position. This strategy not only protects our capital but also gives us the opportunity to capture further potential gains with zero risk on the table and cashing out on TP2s and TP3s.
Stay tuned for more updates and happy trading! 🚀


SPX Big Short 2Two years after my last big short on SPX, the price has once again reached the top of the ascending channel. Based on this scenario , the expectation is that SPX will peak within the next two months , around early May 2024.
Initial target 4,800, stretch 4,400
Incidentally, Bitcoin appears poised to surpass its 2021 all-time high, during which Bitcoin peaked two months prior to the SPX 2022 high.
Coincidence? Possibly
Best, Hard Forky

NASDAQ, S&P 500 Trying to Rebound From Q2 LowsOn Wednesday, volatility surged back into the market, with the CBOE Volatility Index (VIX) spiking 9% after hitting nearly three-year lows last week. The yield on the 30-year Treasury note, a crucial benchmark for mortgage rates nationwide, soared to 4.74%, rising more than 15 basis points over two sessions and nearing its highest close since May 2. As yields climbed, bond prices dropped, with the iShares 20+ Year Treasury Bond ETF falling 1.3%. Investors fear that the Fed will not cut interest rates more than once by the end of the year and not before November, as suggested by current Fed futures pricing.
All major U.S. equity indices and all eleven sectors traded in the red, with the U.S. dollar effectively playing its safe haven role. The Invesco DB USD Index Bullish Fund ETF rose 0.5%, marking its strongest day in a month. Rising yields and a stronger dollar pressured commodities, with gold prices down 1%, oil down 1.3%, and natural gas down 5%.
Semiconductor giant NVIDIA Corporation has been surging in value and could soon be the most valuable company in the world. The strong gains for Nvidia and other Magnificent 7 stocks have helped boost several major stock indexes, but also show significant weighting for a small basket of stocks. The top five holdings in the S&P 500, which is tracked by the SPDR S&P 500 ETF Trust, are Microsoft, Nvidia, Apple, and Amazon.com Inc., which are all Magnificent 7 stocks.
Analysts predict Nvidia shares will trade higher in the coming months with strong optimism for new products and continued artificial intelligence growth opportunities. However, the concern for investors could be the high weighting the seven companies have on a composite index that is supposed to represent the overall U.S. stock market. With 500 stocks represented in the SPDR S&P 500 ETF Trust, the fact that the top seven companies make up 31%, means that 493 stocks make up around 69% of the weighting.

US100 - Bearish US 100 is exhausted on the 4 hour and 1 hour chart and making its low momentum successful.
There is a very strong divergence on the 4 hour and 1 charts and 2 significant lower lows and lower highs. What do you guys think of this idea. Lets hope for good. Thanks

DXY: an indicator to forecast Bitcoin’s directionJust like USDT Dominance, US Dollar Index (DXY) has a somewhat inverse correlation with Bitcoin's direction. If we look at the DXY historically, whenever the DXY was in a downtrend or sideways movement, Bitcoin was in an uptrend. Also, whenever the DXY was in an uptrend, Bitcoin was in a downtrend. Simply put, if the DXY goes up, that means the U.S. dollar is gaining strength or value when compared to other assets and currencies. So, people/traders tend to hold the U.S. dollar instead of, say, Bitcoin. And when DXY goes down, that means the U.S. dollar is depreciating in value, so people/traders tend to hold other assets like Bitcoin or Gold.

Hellena | DJI (4H): Short to the area of 38566.67.Dear colleagues, I believe that the impulse of the senior wave “1” is not yet over.
I assume that the correction is now in priority, so 2 variants of events are possible:
1) formation of lower wave “4” and “5” (39863.75), then correction with the aim to reach the area of 38566.67;
2) The correction will start soon without a new high, but in this case we will have to reconsider the waves.
Manage your capital correctly and competently! Only enter trades based on reliable patterns!

US30 (5.29.24) V1 Buy Opportunity Hello All - sorry for the absence I will continue to be absent until mid to end of June due to travel and moving. Possible buy opportunity coming up in a few minutes. if the 30min closes bullish look at the percentage(buying pressure over 50 percent). take the buy and and manage the trade accordingly.

US30 WE ARE DONE, WHAT'S NEXT!Hello Traders and everyone, I am Hadi Karaali, Known as SNIPERS_FX
If you like the idea, do not forget to support with a like and follow.
US30 WE ARE DONE, WHAT'S NEXT! 📚
👉As we mentioned in our previous analysis attached on the chart, Price rejected our massive rejection zone 40k and supply as well. Specially after breaking below the marked swing low.
👉Moreover, price is approaching a nice-looking support zone, lining up with our previous swing highs and lows, where we will be looking for new longs on lower time frame to confirm a new bullish movement, as the price is still overall bullish from a medium term perspective.
Unless price managed to break below our marked zone, then a movement lower would be expected, till the next demand zone, Where we will be again looking for new longs as well. 📚
If you like this kind of analysis don't forget to like and follow
and as usual follow your trading plan and manage your risk.
Be patient and good luck!
