GER30 Weekly Idea 5.28.24My Usual Setup that I didn't publish... still has some interesting levels to play out.
Market indices

AU Weekly Idea 5.28.24My Usual Setup that I didn't publish... still has some interesting levels to play out.

NAS Weekly Idea 5.28.24My Usual Setup that I didn't publish... still has some interesting levels to play out.


SPX - Bearish TrendSPX is in Bearish Trend as there is little divergence and its making Harmonic Pattern which shows it will make reversal.


Nifty closing this week looks like Calm before the storm.FII, DII and Retail investors are all awaiting Exit Polls and Actual results of election to follow thereafter. We have already discussed the best and the worst case scenarios. The candle formed today is Doji exhibiting indecisiveness. The support at which Nifty is standing is Mid channel. The other support which has been taken is 50 days EMA. Right now everything looks in balance. Lot of overpriced stocks corrected. Lot of underpriced stocks which gave good results exceled. Many more underpriced Banking and IT stocks are looking like value buys. Many overvalued Psu stocks look like them might again run further in case of expected results. Everything looks like it is on a tipping point. + or - 5 to 10% move depending on results is a definite possibility. DIIs have been buying all the way. FIIs have been selling all the way. Perfect recipe for a thriller to unfold next week. Everything is on a standstill. This weekend might be a calm before the storm.
Nifty Supports: 22392, 22057, 21827, 21712 and 21221. (Worst case scenario 17597 in case the expected results are not seen in election).
Nifty Resistances: 22672, 22829, 23140, 23226 and 23398. (Best case scenario between 23500-23600).

DXYToday's market is focused on the April PCE inflation report, which could influence future Fed rate cuts. Better-than-expected CPI data earlier this month has lifted investor hopes for a favorable PCE outcome. Major indices show mixed movements, with gains in technology and communication services sectors

DXY - Are we going up? Probabilities that DXY is going is high.
Technicals DXY
→ We came into support and are heading up.
→ We do have a zone here which can act as resistance, but I expect that we will breach it.
→ We broke out of trendline and retested it and gone up.
→ We respected the up sloping channel.
Your trading friend,
Simba Trades

Banknifty in buy zone49400 above green candle close means and
then if break that green candle high
.banknifty target is 50790

VIX under 10 area VIX is rebounding but in my view it will target under 10 in july before retesting 30

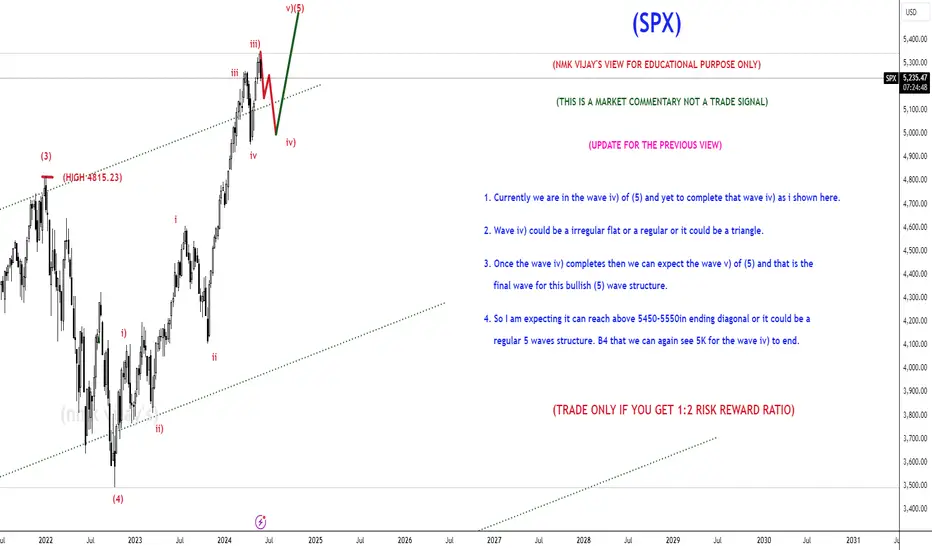
SPX; 5k to reach for wave iv) and v) of (5) to 5550?DISCLAIMER : All labelling and wave counts done by me by manually and i will keep change according to the LIVE MARKET PRICE ACTION. So don't bias, hope on my trade plans...try to learn and make your own strategy...Following is not that much easy...I AM NOT RESPONSIBLE FOR ANY LOSSES IF U TOOK THE TRADE ACCORDING TO MY TRADE PLANS....THANKS LOT..CHEERS
USNAS100 (Futures Slip Amid Rate-Cut Uncertainty)Futures Slip Amid Rate-Cut Uncertainty
Uncertainty over how long the Federal Reserve will maintain elevated interest rates weighed on U.S. stock index futures on Thursday. Investors remained cautious ahead of crucial economic data that could provide insights into the state of the economy.
Technical Analysis:
As mentioned in the previous analysis, the price dropped. Today, we anticipate the GDP report, which is expected to be bullish for the indices, with a projected growth of 1.2%. However, if the GDP exceeds 1.2%, it could lead to a decline towards 18,550 as the first bearish target.
Conversely, a bullish scenario will be activated if the price stabilizes above 18,820, targeting 18,940.
Pivot Line: 18735
Resistance Levels: 18820, 18940, 19100
Support Levels: 18550, 18440, 18250
Today's range is expected to be between the support at 18440 and the resistance at 19,100.
previous idea:

$NIFTY50 -- season finalestill holding the 200 ema but below the blue line for now
white thick line has not been tested yet so we could gap down and go test there
am leaning bullish for a gap up with the ltf rounded bottom
even if it all goes tits up we are less than 4% away from the origin of this move
targeting ath from here , would be a pity if all those shorts piling in got squeezed

EGX30 Possible Scenarios EGX30 Possible Scenarios :
1. Bullish scenario following the blue lines.
2. bearish scenario following the black lines.


Down Trend start, Next Target is the Channel Bottom.Nifty 50 coming down side, because Trendline breakout is the one of the Confirmation and also did not closing above the Channel Pattern.
I want to help people to Make Profit all over the World.
Refer this link :

review for SPXOn smal
With Magic_xD indicator
Gann level for downwards correction
It came true for 2 angles
End of 2nd cycle to 5158.58
Goodluck

Nasdaq buy setup institutional tactics hello traders this is my nas100 buy setup
risk reward 1:10
the system: institutional tactics
if you like this deal hit the like button follow comment subscribe and show some love ❤️
wish you good luck and good trading
i would like to have conversation and share our ideas and know you good people
remember the flow state is important
Flow , Glow and know and never blow

31 May Friday Banknifty leval intraday (15min)Red selling zone and green buying zone level learning and education purpose only
Like share comment and follow
Note:-
DISCLAIMER
"Stock market investment/trading is subject to market risk do not trade or investment without proper knowledge or without help of your financial advisor.
Any information shared on this platform is purely for educational and information purpose. We are not responsible for your gain or losses."

USNAS100 (Falling Pressure...)Technical Analysis
The price dropped by approximately 1.30%, as mentioned in the previous analysis.
Currently, the price will trade between 18,435 and 18,550 until a breakout occurs.
Bearish Scenario: Stability below 18,435 will likely lead to a drop towards 18,250.
Bullish Scenario: The price must break above 18,550 and stabilize to reach 18,650 and 18,735.
The Nasdaq continues to experience bearish pressure.
Pivot Line: 18500
Resistance Levels: 18650, 18735, 18820
Support Levels: 18340, 18250, 18110
Today's range is expected to be between the support at 18230 and the resistance at 18650.
previous idea:

Nifty Daily Chart Support and resistance
Support @ 21492 as previous day low
Thriced attemp and cover now closed near low
Resistance @ 21834 as all time high
option chain data support 21500 / 21400 / 21300 / 21000 (weekly expiry)

