I think $BTC is going lower and this $BITI chart looks bullishLet me know your thoughts on this trade =)
Personally I would like to scoop up some BTC at low 50s.
ETF market

Expired SPY Weekly outlook. 2nd WK MAY 2024Expired SPY Weekly outlook. 2nd WK MAY 2024
> NEUTRAL 📊 CORRECT
Closed Price: 511.29
Target Price: 512.94 | Strike Price: 518.48 MAY7 24'
Upper Range: 518.96
Lower Range: 506.92

Silver will fall 10% - AGQ will fall 20% for retracementA 70% chance that silver provides a retracement next week, as the attacks on Israel by Iran are not coming out - and the West is getting desperate (I smell a false flag if Iran doesn't bite).
Asia (ChIndia - China & India) are hodling silver and gold and will provide the impetus for the forward price of precious metals.
TTM squeezes normally see price bounce off the opposite end as a fakeout before its continuation. I see that on multiple smaller TF's and a retracement to the middle BB on higher TF's.
I see a huge boost of silver miners coming up shortly, but for now I see a consolidation happening. Options for AMEX:AGQ was .05 for $36 June, so I see this going up to $1 or 20x if all goes as planned.
Then time to reload for metals blasting off!

SPY - SHORTSPY SHORT, If we top here, Ive entered into puts this afternoon, looking to touch 50% horizontal retracement at LEAST. Will take most profit at the PoC just incase.

SMH rising wedge and gap fill at $212 levelChart is pretty clear. There is a big gap at $212 and a number of points of confluence. The lower trend line on rising wedge aligns with the gap, and other key levels. I'm using SOXS for the gap fill.

ASX - VAS: 8 May, 2024© Master of Elliott Wave Analysis: Hua (Shane) Cuong, CEWA-M
Details: The short-term outlook suggests that the recent completion of the 1-red wave and the initiation of the 2-red wave are underway, and it appears that the latter has just concluded. Maintaining price above the support level at 92.93 would be an initial advantage for this perspective. However, there is a need for a swift and strong price increase above the 97.63 level to clarify this perspective.
Invalidation point: 83.45
Confirmation point: 97.63

bullish continuation to ATH's or HNS REVERSAL?Rally after FOMC gives some life back to the bulls. Tuesday's failure to close outside of Mondays range (failed break out) is signaling a possible retracement to the Low of the week (LOW). if we get that pullback a nice gap down on Thursday could signal a bear trap, if we gap up on Friday. Personally, looking for that set up to start the advance to ATH's
On the flip side there is a potential for a head and shoulders type pattern that could signal a reversal and continue down. Let see what story price will tell! #Ifthis,Thenthis

$SPY May 8 ,2024AMEX:SPY May 8 ,2024
15 Minutes.
As expected, AMEX:SPY was in sideways.
Forming a HH, HL pattern.
For the last rise from 514.89 to 518.87 it retraced 61.8% yesterday around 516.5 levels.
So, for the day I will buy above 518.6 and sell below 515.6 for a target 513.5 to 514.
I expect a move only above 520 at the moment. Need to cross the 519-520 resistance.
We are having an oscillator divergence; price is making higher while oscillator making lows.
Yesterday gap open was not sustained and the gap was closed.

SPY $ 580 Stagflation1. **Supply shocks**: Sudden increase in the cost of essential raw materials, such as oil or metals.
2. **Restrictive economic policies**: Excessive regulations or policies that distort the labor and goods markets.
3. **Engrained inflationary expectations**: Upward wage and price adjustments in anticipation of future inflation.
4. **Structural unemployment caused by AI and automation**: Loss of jobs due to the replacement of workers with advanced technologies.
5. **Expansive fiscal policies**: Excessive public spending that exceeds the productive capacity of the economy.
6. **Weakness in productivity**: Insufficient investments in technology or human capital that limit economic growth.
7. **Imported inflationary pressures**: Importation of inflation through foreign goods and services or currency depreciation.
8. **Increase in labor costs**: Increases in labor costs that are not aligned with improvements in productivity.
9. **Trade barriers and protectionism**: Tariffs and quotas that increase import costs and decrease global economic efficiency.

SPY Long SPY is looking quite bullish for now, just broke above a bear flag it had been forming and filled a gap near $517 today, I'm expecting a push up to the $520 area if this and VX weakness continues. I'll be looking for it to retest that bear flag for an entry.

SPY - here comes the dumpLittle dead cat bounce is just about over, as you can see AMEX:SPY bouncing off the upper Bollinger band. The stochastic indicates profit taking too.

QQQ Bear Flag (Potential Correct Start)Classic trend reversal retracement
-Bear flag directly into one of the last imbalances (on 30m timeframe)
- Breakdown to 393 area very possible in the next month or two
- ~10% drop from current levels, would put QQQ squarely in correction territory
- Upside is that 393 area looks to be a very strong (and fresh) support

SPY short SPY created a weekly sell model, we targeting the low. Ideal area is going to be $460-480. All we did was a bearish retest and filled the -FVG and nuke.

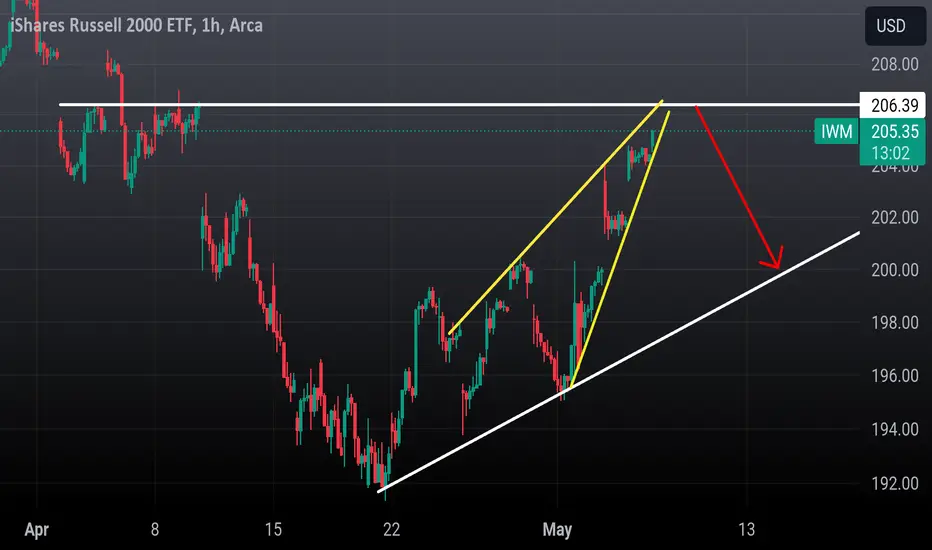
IWM Bearish at the end of a double bottom
Short target here is 200 gap close..
Has a final gap at 206.30 to close so thats where i will enter..
Stop loss 207.50
Target 200
QQQ Scalping Zones 5/7Upside Targets:
* 442.24/443.81/445.56
Downside Targets:
*440.79/439.3/437.26
Daily Trend Tracker -
*QQQ+ *DXY- *VIX- *US10Y+

Long bonds USA TLT. Long for longer. I never really traded this before. But from the chart perspective and all talk about lowering rates. This one sure seems interesting on the weekly chart.
Volume and RSI divergence, plus OBV balances higher up.
Even oversold on monthly RSI.
Last two weeks candels has also been bullish.
Maybe?
Will hold this for some time. I think.

Resistance And RSI This picture indicates that if the candlestick can stand on support level 1 at the price of 205.05, it can generate profits in the upward direction, and it can take profits at resistance level 2 at the price of 211.03. Additionally, you can check the RSI indicator to confirm the trend further; if the RSI stands above the 70 line, it indicates a bullish trend.

Momentum waningLooking at the daily chart, it seems like the short term momentum is waning a little.
PPM1 is on its way down and has just crossed its first derivative, suggesting we have at least temporarily topped. The 10 SMA is also showing downside movement.
The PPMs 2 and 3 are still holding on it seems. So are the upward slopes of their respective SMAs. So we could get support at the 21 or the 40 SMAs.
Moving on the the weekly chart, things look a little more negative. Looking at the PPM1, momentum is shifting downwards. However it is still at 0.61 - very much in trend. So while it may still hold for a week or 2 to find the top, it seems like the bulk of the move up is done.
PPM2 is also looking to head downwards. The trajectory of the 21 SMA is starting to flatten out as well, meaning if price gets there, it is not likely to hold support.


Weak Jobs Report -> Treasury RallyTLT long term bond ETF ripe for a swing trade to $92 coming off the
1. Hard landing concerns -> Treasury Bond Rally (TLT)
2. Faster Fed Rate cuts -> Treasury Bond Rally (TLT)
3. Inflation Dropping -> Treasury Bond Rally (TLT)

CQQQ May 7th TTR UpdateTheTradersRoom is very long #CQQQ from much lower levels and looking to hold this one till at least we see 2-3x gains on it.
We have entered it first days of Feb and very happy with the result.
China is recovering and Im expecting a perfect inversion alignment to QQQ here into the end of the next year.
It was a clear breakout from the downtrend channel last week. If the broken channel gets tested from above, it will be a perfect opportunity to add into our long position.

$SPY May 7,2024AMEX:SPY May 7,2024
15 Minutes.
AMEX:SPY managed to stay above 510 levels.
Now we have 100 and 200 also near 510 levels.
Now holding 513 levels uptrend intact.
513 is the 61.8 % retracement for the fall 524.61 to 493.86.
510 is important because it is 38.2% retracement for the rise 599.55 to 516.61.
For the day holding 514 levels i have a target 518-519 levels. This is the number from April 11, we saw AMEX:SPY going all the way down 493 levels.
So, I expect some resistance around 519-520 levels.
I am going long around 515-515.6 levels for 519 SL 513 - 512.5.
The retracement to 515 - 515.6 is due to oscillator divergence in 15 minutes.
For two days we had a gap up we need to sort out the divergence.

CAN THE MARKET SURVIVE AN 80% CRASH, WHAT ABOUT ONLY 40%?So, for anyone who likes to watch certain movements.
A big one is about to occur.
A rejection from this break is the covid drop. about 30% and some.
However, the end of the cycle, if you believe in those kind of things, would be a 100% retrace of the impulse with a little extra on the downside, which closes all gaps, I believe.
That takes us down below 200.
It would have to be quick.
Next cycle then starts and pulls us up to $600.
I tried to mark it in orange.
This chart isn't an idea as in (I REALLY THINK WE'RE DROPPING 80% in less than 1 year).
This is more to show that trend break from the past and the trend break showing.
518 to 530. CAREFUL ZONE!!!
Market is showing a lot of crazy movements and numbers. I think something has to be "up" such as China and Taiwan considering what we're seeing with semiconductors.
