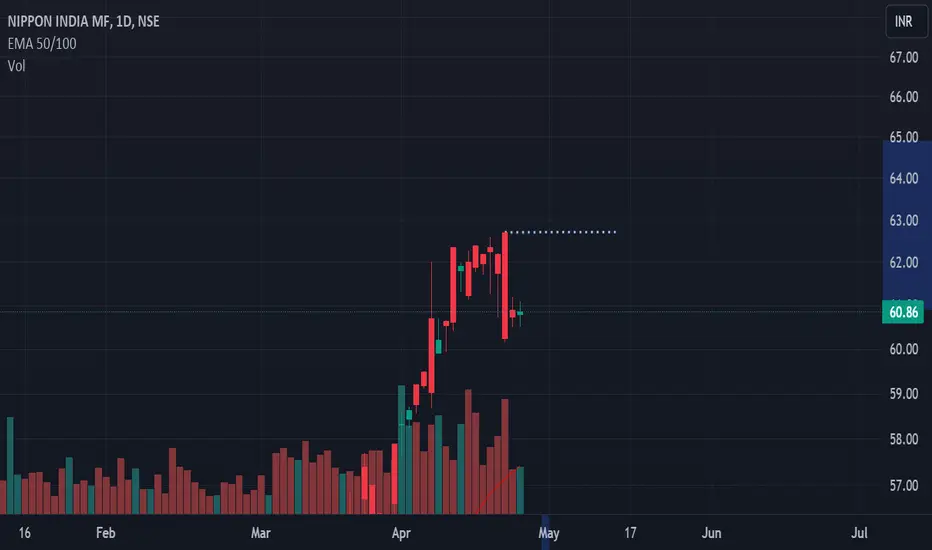
Time to catch Gold beesGold bees corrected and its at buying level
buy around 60, 61
small SL 60 or 59.50
Target 63, 65
Very low risk trade
Go for it guys
Educational purpose only
ETF market
$SPY May 27, 2024AMEX:SPY May 27, 2024
15 Minutes
For the day my range is fixed between 532 - 524.
All moving averages have converged in 15 minutes.
For the sharp fall from 533.07 to 524.73 AMEX:SPY resisted around 618% retracement being 530 levels.
If a consider the rise 524.73 to 530.27, holding 526.5 today i have a target 530 - 532.
If AMEX:SPY closed below 526.5 in 15 minutes bar with close near low of bar i expect 523- 524 to be resisted first.
No trade day for me today.

Shorting the Japan ETFPersonally, I would not advise using the leverage, 2x or even 3x Bear ETFs unless you are super confident and knows and can accept the RISKS involved. U win 2 or 3 x but also loses 2 or 3x, can you really accept it ? The question you should always ask no matter what indicators or gurus telling you, what if you are wrong ?
Answer this question and not avoid it means you know what you are doing, has calculated the risk/reward ratio and this is a small % of your capital allocated to speculate. That is fine. And if you are RIGHT, you do not increase your position size NOT because you do not want to make more money BUT to tame your greed for future bets. Stick to the same position size with appropriate stop loss and if the table turns against you, you can still sleep well. Maybe, a conservative method but it works for me, how about you ?

✅SPY WILL KEEP GROWING|LONG🚀
✅SPY is making a rebound
From the horizontal support
Of 524$ and as we are bullish
Biased we will be expecting
A further move up
LONG🚀
✅Like and subscribe to never miss a new idea!✅

Real Estate Crash $IYRReal estate has completed an abc correction to the first down leg of 2022 and will be followed by a C leg down for resolution through the end of 2024.

SPY: Forecast & Trading Plan
The price of SPY will most likely collapse soon enough, due to the supply beginning to exceed demand which we can see by looking at the chart of the pair.
❤️ Please, support our work with like & comment! ❤️

SPY BEARISH BIAS RIGHT NOW| SHORT
Hello,Friends!
SPY pair is in the uptrend because previous week’s candle is green, while the price is clearly rising on the 1D timeframe. And after the retest of the resistance line above I believe we will see a move down towards the target below at 491.67 because the pair overbought due to its proximity to the upper BB band and a bearish correction is likely.
✅LIKE AND COMMENT MY IDEAS✅

SQQQ is rising today LONG
SQQQ trended down the last two days of last week and especially Friday as the technology stocks surged
Yesterday had price consolidation and generally less trading volumes. I believe that
SQQQ will bounce at this level. It is supported by a cross above the POC line of the volume
profile. Under that line is the stop loss while the target is 17.95 at last week's pivot high
The relative volume void above 17.3 suggests that price may have great movement once
getting over that level. A confirmatory MACD line cross sets the reversal .

$10 by June 2024It's 2024, 3 years since people received free money from our government, people already started draining their savings accounts. Everything got much more expensive. Rising auto loan, credit card, mortgage delinquencies. We already had crypto pumps begging this year and these pumps were much smaller than 2021. I don't think people have money to pump anything anymore. The recent GME and AMC pumps were also small compared to 2021 pumps.
I think time is about to come for the entire crypto industry.
Let's be honest, it's a pure game.
I'm long BITI.
Current position: 5000 BITI shares.

$SPY BREAKING Death DOJILast month I gave yall over 250% on Inside Week breakout into NEW ATH
However BECAREFUL now for Potential BULL TRAP Into GREED many FVG BELOW!
I am looking to short using LAST WEEKS LOW as the trigger

$SPY HyperInflation returns AMEX:SPY return of hyper inflation will we see AMEX:SPY my high target of $640.30 or will it die off around $540.70 give or take after we reach those highs we will see pullback back down to $395 if buyers fail to step up to show support we'll be testing 2008 lows back around $285 eventually down to $200 then $86 then $24 (WW3 scenario / end of world scenario/ near default)
As bears we've done our job to short squeeze it to highs as news hit about Trump wall st bought up the rumors let's see how long we'll extend the rally.
Thinking we got a bit more to go before we short completely after the rate cuts come around fall time you'll see a mass sell off as banks shut down.

SPY Under Pressure! SELL!
My dear subscribers,
EUR/USD looks like it will make a good move, and here are the details:
The market is trading on 529.51 pivot level.
Bias - Bearish
My Stop Loss -536.17
Technical Indicators: Both Super Trend & Pivot HL indicate a highly probable Bearish continuation.
Target - 519.29
About Used Indicators:
The average true range ATR plays an important role in 'Supertrend' as the indicator uses ATR to calculate its value. The ATR indicator signals the degree of price volatility.
———————————
WISH YOU ALL LUCK

QQQ: Short Trading Opportunity
QQQ
- Classic bearish formation
- Our team expects pullback
SUGGESTED TRADE:
Swing Trade
Short QQQ
Entry - 458.03
Sl - 468.73
Tp - 438.87
Our Risk - 1%
Start protection of your profits from lower levels
❤️ Please, support our work with like & comment! ❤️

Cap weighted vs Equal Weight SPY at ExtremesAre the times when the cap wtd S&P500 is crushing the EW AMEX:SPY also the times when AMEX:SPY is most vulnerable? At present, you would have to go back to Q1 2009 to find a simliar ratio to today (using AMEX:RSP as the EW SPY in comparison to AMEX:SPY ). Another period when this extreme was reached was 2020.

GDX break out Have been tracking Gold and the Gold miners ETF GDX... It has been a while and it appears that Gold and GDX are at least in sync again.
GDX appears to have closed the week above the long term range and just broke out, if not about to...
MACD and VolDiv have not yet crossed over but indications show. The TD Setup is still showing primary bullish and a new Setup is forming, with a target to close above 36.26 within the next two months.

Doji on the $SPY weekly and RSI DivergenceSPY printed an inside day on the daily and a DOJI on the weekly, we're going to get some movement next week for sure. I have protective puts in place.

ERXEducational purpose, not a recommendation.
Expect a 5% move $59 ~ $60 within a couple of weeks with a close stop-loss of 2%.

Resistance of QQQ broke on Weekly ChartI plan to trade call options because the qqq broke its resistance on the weekly chart. I will buy it when it rested or pull back for 1 red calendar with volume dry up

$SPY S&P 500 Quarterly lookA historical look at AMEX:SPY since inception.
By just looking at this chart you can remember the historical events
2008 Financial crisis where buyers stepped in
Covid lows, etc
Chart is broken down in 3 month candles to represent each quarter in the market year

Clean Energy ETF $ICLNResistances and Support
3 month candles
Possible bottom looks like it could be in with rising volume


Opened (IRA): BITO July 19th 24 Short Put... for a 1.44 credit.
Comments: High IV at 59.6%.
Looking to pick up shares at or below my covered call's current break even of 27.10.
Metrics:
Buying Power Effect/Break Even: 22.56
Max Profit: 1.44 ($144)
ROC at Max: 6.38%
ROC at 50% Max: 3.19%

S&P bulls are unstoppable; market reaches new highMarket closed strongly last week after reaching a new historical high. There was some sluggish consolidation on Thursday-Friday but near end of Friday trading hours, bulls put end to it by setting hourly higher low. Friday closed within Thursday’s range after a failed break-out, which is a very bullish signal.
Currently, we have full alignment on all major timeframe: price is in uptrend on weekly, daily and hourly timeframes. There are absolutely no warning signs that would speak for bears.
Both short- and long-term outlooks are bullish. If you're already in a long position, you're fortunate and can rest easy. If you're considering entering the market, you can either wait for another pullback or enter now with a reasonable stop-loss.
FOMC minutes are coming out on Wednesday, which could cause some unexpected volatility. However, if there are no major surprises, the bullish thesis remains unchanged.
Disclaimer
I don't give trading or investing advice, just sharing my thoughts.
