xlu
#xlu AMEX:XLU Utilities are starting to rotate, moving opposite to AMEX:SPY #spy #trader #investor #stockmarket
ETF market

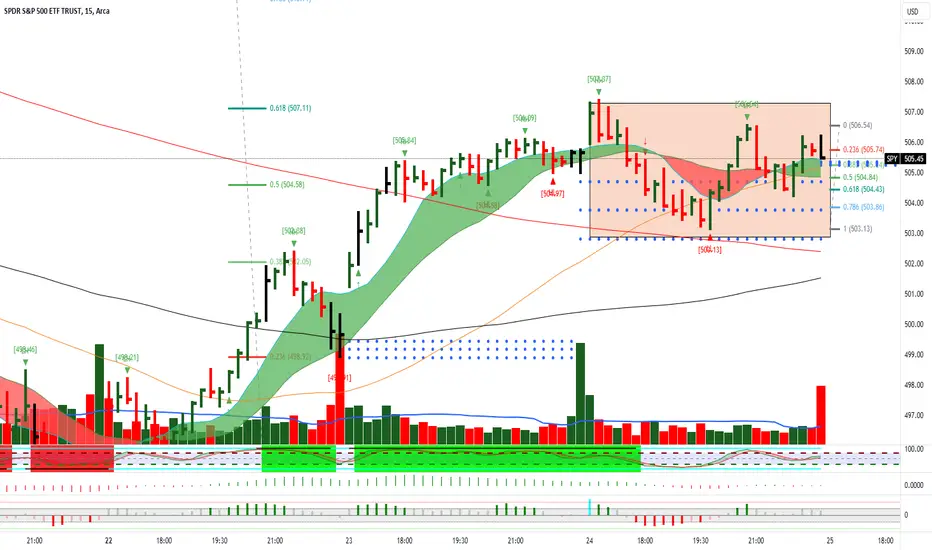
$SPY April 25, 2024AMEX:SPY April 25, 2024
15 Minutes.
As expected, AMEX:SPY managed to hold 502 levels.
Foe the day holding 504 levels I expect 507 to cross towards 510 levels as initial target.
If 504 is broken on downside I expect 501-502 as target. So, I feel not much worth shorting today.
Based on opening 15 minutes today should be a trending day one sided.
Moving averages have converged.
How ever I will go long only above 514-515 levels.
SMH: Ain't over till its overThis is a follow-up on my Mar 9 post on NASDAQ:NVDA and I feel using the NASDAQ:SMH would explain overall market picture better. I struggled with how to frame this post as it is a combination of zooming into lower fractals and zooming out to higher fractals and hope this weekly chart helps.
In the immediate short-term, markets are oversold and you can spot the ABCD down completions in the 30M fractal. This is likely to be a short-term bounce into week end, month end to test 30M overhead neckline resistance.
In the weekly and daily chart, the overhead neckline resistance can be seen as the white dotted overhead resistance (representing extreme price volume action). Big picture wise, there are multiple ABCD completions for the SMH and its key component stocks which implies we should look at the Nov'21 to Oct'22 downturn guide the downside projection.
This would imply a downside projection to c.$164 with the $224 level as an invalidation level.

$TLT - Trade of the decade. NASDAQ:TLT runs inverse to the 10YTreassury note. The gap just below $85 should be filled when the 10Y goes back to 4.9%. When the gap closes and yields come back down, NASDAQ:TLT will be the place to park your money... NFA.

Ok, time to draw some pretty picturesWhy can't we just go higher from here? Everybody seems so negative -- and indeed I'm more neutral than bullish right now but $480 is just as possible as $530 and we really just have to wait out earnings season to see which way we get smacked first. I was bullish (then netflix happened) then bearish (then explosions over the weekend) then bullish (then people seem to be selling on any good news) so now bearish leaning again (in the short term). But the fact remains that there were rumors we were going to get another rate hike and so any rallying last thurs/fri faded downward, but though things haven't been great this week, I think it's fair to say most people aren't worried we'll get a rate hike in July anymore.
It's pretty terrible long term though -- we could actually succeed in a soft landing. But we could also crash. And equally likely but unknown until recently, we could just have stagflation for a while. Things are kind of weird right now and wall st seems nervous to get excited about anything. But I think for the common man, recession is off the table.
A lot of caution, please.

$KWEB - Breaking out!AMEX:KWEB A convincing descending wedge breakout on KWEB. This will lift NYSE:BABA NASDAQ:JD NASDAQ:PDD $BIDU.
Targets:
$32
$36
Risk:
$24

QQQ Forecast!QQQ has made the similar pattern to 2023, and 2021 which increases the risk of more correction!
Which scenario is more likely to happen???

Double Top?Double top or can this turn into a double bottom?
I have the strange feeling that the DEA may not reschedule due to lack
of data or some other bs lame reason. If this happens, I can see this double
top playing out and stock dropping back down to the $4-$5 area.
If the DEA does reschedule marijuana - I can see a double bottom playing out
from neckline and stock going to $16-$20
If stock drops close to the neckline in the next week or two, I'm going to buy a
options straddle into July and possibly Sept. ATM long straddle, perhaps even OTM too.
This is a news driven stock, so what ever the DEA does is going to create a shit
ton of volatilty.
I own shares at around $6.5 average.

Bullish movement on $FXI after multi-year lowsHere we can see AMEX:FXI potentially breaking out of a multi-year downtrend after a 2021 top. The stock formed an inverse head and shoulders pattern while touching support and bottoming at about $20.84. A large cap ETF such as this could be a very low risk trade heading towards the latter half of the year. Personally, I will be waiting to buy after it starts trading above the 50SMA. You can see it is currently above the 20, and now it is working its way to be above the 50 with significant volume this week.

QQQ Scalping Zones 4/24Upside Targets:
*429.57 - 430.82 - 431.16
Downside Targets: Jan gap fill reject?
*427.20 - 426.35 - 425.61
Daily Trend Tracker
*DXY - Bullish - *VIX - Bullish - *US10Y - Bullish

Early unconfirmed long position.In $SPYThe confluence at the lower lever and the 1 hour chart reacting at that level has me buy a very small low risk call option trade.

THIS IS A DUMB IDEASmall swing trade
(I am currently not trading futures, have in the past. Only due to my time zone - Market opens quite late for me like 1:30am).
*I am not in this trade but I think this is a likely outcome in this moment but it depends*
Purely fundamental

(FBY): Technical Analysis.As we approach the market open on April 23, 2024, FBY exhibits key technical signals that warrant a detailed speculative analysis.
Ichimoku Cloud
The recent price action of FBY has dipped below the Ichimoku cloud, signaling bearish momentum. The conversion line (blue) at $21.58 is currently below the baseline (red) at $22.14, which traditionally suggests the potential continuation of a downtrend. However, the lagging span intersecting the price bars from 26 periods ago offers a neutral signal, thus presenting a complex scenario.
Fibonacci Retracement
A critical observation is the breach of the 0.618 Fibonacci retracement level at $21.04, indicating significant support-turned-resistance. The stock found momentary footing at the 1.618 extension near $19.48 but has since rebounded.
RSI and MACD
The Relative Strength Index (RSI) is hovering around 43.69, suggesting that FBY is neither oversold nor overbought. This neutral RSI reading does not provide a strong directional bias. Concurrently, the Moving Average Convergence Divergence (MACD) exhibits a bearish crossover with both the MACD line and the signal line trending downward, confirming the selling pressure.
On Balance Volume (OBV)
The OBV indicates a downward trend, suggesting that selling volume is overpowering buying volume, aligning with the current bearish sentiment.
Volume
The current volume is below the 30-day average, which may indicate a lack of conviction in the recent price movements, leaving room for volatility.
Price Prediction and Speculation
Considering the confluence of technical indicators, a speculative price target on the downside could be set near the 1.618 Fibonacci extension level at $19.48, should the bearish momentum continue. An upward correction would face resistance near the $22.60 level, which aligns with the Ichimoku cloud base.
Entry and Exit Points
Potential Entry Point: Traders may look for buying opportunities at the $19.48 level if the price action suggests a strong reversal pattern with corresponding volume.
Potential Exit Point (Short-Term Bullish Scenario): A conservative sell target can be placed around the $21.86 level, which would test the cloud from below.
Potential Exit Point (Bearish Continuation): Should the downtrend continue, a tight stop-loss is recommended above the most recent high at $22.96 to mitigate risk.
In summary, FBY's technicals indicate a bearish trend with potential for short-term bullish pullbacks. Traders should employ caution, with vigilant stop-losses due to the uncertain nature of the market's direction. The analysis by AxiomEx Trade Solutions suggests vigilant market watching in the coming days for confirmation of these speculative insights. Always consider market news and fundamental analysis before executing trades.

$SPY April 24, 2024AMEX:SPY April 24, 2024
15 Minutes.
SPY has managed to hold 493 levels.
50-day average in daily.
in 15 minutes forming HH HL pattern.
Moving averages are getting sorted out.
For the day holding 501-502 levels, for the rise 498.91 to 506.09 uptrend in intact.
So, on downside 500 is a crucial level to hold.
On upside resistance is around 509-510 levels as it is 61.8 retracement for the fall 519.47 to 493 levels.
As of now long only above 514-515 levels with target towards ATH.

Continued upward momentumUpward momentum continues to look stable. when looking at the charts for the next few days. The daily chart still shows stable momentum in PPM1 even as PPM2 and PPM3 are still struggling along. This may mean that the upward momentum will carry on for some time but is prone to suddenly dropping off. Note that PPM1 is only at 0.1928, not exactly a very strong trend.
Looking over to the weekly, momentum still points upward for now with PPM1 and PPM2 in uptrend. PPM1 still looks to have more upside and PPM2 looks to be stabilising at this area. So at least for the next 2 weeks or so, generally expect some more upside. Price is already close to hitting the first high fib target of 3.308. If it hits the target this week, we could see a push to the second fib target of 3.384 before momentum runs out of steam.
Currently, momentum is projected to run out of steam on the week of 6 May. From there price may top out and look to come back down.

$SPY trend retest into monthly resistance? AMEX:SPY 4 hr looking strong.
NASDAQ:MSFT , NASDAQ:GOOG , NASDAQ:GOOGL , NASDAQ:META all report this week (W-T)
Trend line converges with monthly resistance. We'll see.

Massive H&S for Sugar? Right shoulder forming?Is this a massive Head and Shoulders pattern for Sugar? The head and left shoulder are complete but will the right shoulder form and head to the mid 7s?
Time will tell and we'll know by early 2025.
This all started in June 2014.


Gold bull flag reviewI posted this chart in march on a bull flag that was starting to form with a projection to the dashed green. This is a great example of a longer term setup that rewards the patient. Of then these flags or wedges like to break out on strong volume and then dump for a retest, only to continue to project towards the target. If you had entered 6month to one year out calls on this setup youd be up 400-700%. I did not play this setup this time around but have played GLD bull flags in the past and like to use them as a way to get standard investment exposure to the asset with higher upside, this is also more capitally efficient.
-For example a June 21st 2024 call was 300-450$ in that timeframe in March, these are now worth 1320$
-This was my same strategy for OXY longer-term calls

SOXL Next Best Trade (Bullish Potential)Weekly FVG Close at 41. Daily Close at 38. Waiting for reversal pattern.

SOXL LONG ENTRY setup soxl is goooooood pull back now.
it;s time to buy like no tomorrow!!
but still posssible down to $25
my bull entry with no stop loss...
^^

XLREReal Estate Sector SPDR Fund!
DOWN, DOWN, DOWN
As soon as it break horizontal line we see Target by Arrow!

Gold Gold Gold, Trending up Strong!Gold has been up undisputably. Investor are kept pumping in Cash!
US $ will get weaker but Gold will be Up and Up. more Value than Paper money.
Strong trend that shows bullish in All MAs after years of consolidation.
Where it ends , I don't know but keep riding the waves are smarter choice.
Keep going QAU !
1) Target $21
