ETF market

SPY: Last week of AprilSeems like its going to be a short.
HA setup for a move to 500 inclusive of extended hours, with an equal bearish setup to 501 with extended hours toggled off.
Interestingly enough 500 is also PL2 on the prospective levels (in the chart above).
Sentiment for Monday is neutral to bearish. I have included some old tricks and models since this past week relying on one alone really gave me a run for my money haha.
Pinescript similar day analysis: Neutral (equal bullish and bearish days);
R Similar day analysis: Bearish
R Logistic Regression model: Bearish
R Z-Score Model: Bearish
So let's hope that its going to be bearish on Monday haha.
For the Week, half the models were unsure, the other half were questionable based on the cases. So let's leave it as neutral.
It doesn't matter too too much because there is a really nice HA setup which gives a TP of PL2 on the week. We also have a bearish reference target at around 507. Remember with those, we open above, we will generally circle back down and if we open below we will generally circle back up.
Let's hope SPY gives it up.
If we do snag these low targets, the question becomes, when do we reverse back up. The answer likely being at the low targets. Market is bullishly bearish with constant over-exaggerated bounces everywhere. You really can't do wrong longing unless you over-stay.
Those are my thoughts. Adopt a bullish bias if we end up snagging the reference target and holding it as support (because its right on the bearish condition). If that happens and we head back up, its looking like a bullish thesis is more correct.
Let's see what we get!

Soybeans and Corn are ready to goAMEX:SOYB and AMEX:CORN seem to be heading for big moves.
Not the most glamarous commodities but if one has leverage they can get a great risk to reward ratio.
Does anyone know how I can buy these commodities ?

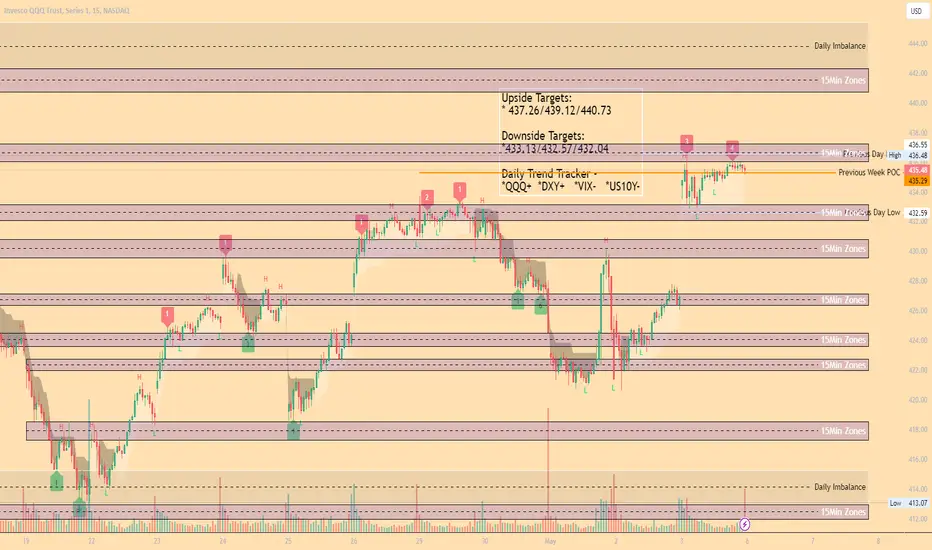
QQQ Scalping Zones 5/6Upside Targets:
* 437.26/439.12/440.73
Downside Targets:
*433.13/432.57/432.04
Daily Trend Tracker -
*QQQ+ *DXY+ *VIX- *US10Y-
BEAR FLAG FORMATION FOR SMALL CAPS 🐻🚩 PRICE TARGETS SETThere is bear flag formation for small caps 🐻🚩 AMEX:IWM
We have pointed FIB price targets for both the upside and downside.
We expect the retracement to go as between the range as low as $169 to $176
Will you be shorting?👀

SPY Under Pressure! SELL!
My dear friends,
My technical analysis for SPY is below:
The market is trading on 511.28 pivot level.
Bias - Bearish
Technical Indicators: Both Super Trend & Pivot HL indicate a highly probable V continuation.
Target - 507.15
About Used Indicators:
A pivot point is a technical analysis indicator, or calculations, used to determine the overall trend of the market over different time frames.
———————————
WISH YOU ALL LUCK

SPY Trading Opportunity! SELL!
My dear subscribers,
This is my opinion on the SPY next move:
The instrument tests an important psychological level 508.23
Bias - Bearish
Technical Indicators: Supper Trend gives a precise Bearish signal, while Pivot Point HL predicts price changes and potential reversals in the market.
Target - 504.66
About Used Indicators:
On the subsequent day, trading above the pivot point is thought to indicate ongoing bullish sentiment, while trading below the pivot point indicates bearish sentiment.
———————————
WISH YOU ALL LUCK

QQQ: Bearish Continuation is Highly Probable! Here is Why:
The charts are full of distraction, disturbance and are a graveyard of fear and greed which shall not cloud our judgement on the current state of affairs in the QQQ pair price action which suggests a high likelihood of a coming move down.
❤️ Please, support our work with like & comment! ❤️

Bullish on Chinese equities - breaking outBreaking out of long term decline - however might pullback shortly before moving higher

SPYjust idea for my self for spy , if broke will might go for 596 or 600 , other why we will see pull back around 476 and go up
that what i hop and i'm not sure :)
thank you for vist

$SPY daily trend breakoutAMEX:SPY has broken above the April trendline as it sits below monthly support/resistance levels.
Note : there is a new gap to fill below from fridays significant gap up at open.
Question : Can someone tell me if that is a bullish doji star?

Expired GLD Weekly outlook. 1st WK MAY 2024Expired GLD Weekly outlook. 1st WK MAY 2024
> NEUTRAL 📊 CORRECT
Closed Price: 216.62
Target Price: 214.14 | Strike Price: 211.50 APR30 24'
Upper Range: 217.38
Lower Range: 210.90

IWMShowing good signs of strength at yearly pivot earlier this year. And then a recent bounce at the 200EMA. Not convinced this down leg is finished, therefore what we see here may be a bull trap.

Nice Opportunity in Clean Energy!There seems to be an Ending Diagonal completed or very near completion, and this should mean a decent return over the next several months.

QQQ Buyers In Panic! SELL!
My dear friends,
Please, find my technical outlook for QQQ below:
The instrument tests an important psychological level 435.48
Bias - Bearish
Technical Indicators: Supper Trend gives a precise Bearish signal, while Pivot Point HL predicts price changes and potential reversals in the market.
Target - 429.45
About Used Indicators:
Super-trend indicator is more useful in trending markets where there are clear uptrends and downtrends in price.
———————————
WISH YOU ALL LUCK

QQQ Under Pressure! SELL!
My dear subscribers,
My technical analysis for QQQ is below:
The price is coiling around a solid key level - 431.06
Bias - Bearish
Technical Indicators: Pivot Points Low anticipates a potential price reversal.
Super trend shows a clear sell, giving a perfect indicators' convergence.
Goal - 423.50
About Used Indicators:
By the very nature of the supertrend indicator, it offers firm support and resistance levels for traders to enter and exit trades. Additionally, it also provides signals for setting stop losses
———————————
WISH YOU ALL LUCK

SPY: Bears Will Push
The recent price action on the SPY pair was keeping me on the fence, however, my bias is slowly but surely changing into the bearish one and I think we will see the price go down.
❤️ Please, support our work with like & comment! ❤️

QQQ pull back done or another leg down?QQQ had a bad week last week after trying since February to break long term resistance of the Blue trading channel. There was a lot of momentum but ultimately after being squeezed between resistance of the blue channel and support from black channel midline, it was time to take profit for the big guys. Clearly, inflation readings and uncertainty about interest rate cuts were the main factors.
A hard sell off last week to establish a clear down channel with the biggest selling on Friday. Using the channel from August to November last year and with some minor tweaks, you can see that it ended Friday right on the support line.
Another thing I was looking at were several of the most recent pullbacks over the last few years. You can see them overlayed on the peak of March 21st. Going by them, QQQ has already come close to extent of the smaller pullbacks.
In my limited experience, these two indicators are usually a good sign for a rebound this week. The RSI is also in the oversold range and in line with other bottoms. The rebound could just be a short-term rally in the down channel like back in Aug and Sept last year with another leg down in the coming month or so. Or we could see a new attempt to break out of the blue channel.
Either way, I was brave enough to open a few positions Friday before the close. Hopefully I don't regret that.

A terrible covered call strategy bond etfDisaster when interest rates drop or new hotness, you decide!

QQQ coming into huge resistance🍿Price target near 424NASDAQ:QQQ coming into huge resistance🍿
Price target near 424
Would you be shorting into resistance?
Will it get reject at resistance or breakout?

clear oversold market structure bitcointhe network has provided a ver liquid structure to the downside. now that is contracting, i believe we will revisit the sell heavy area as a contraction of the bear move according to this market structure POC VAL.

weekly distribution gainthe daily market may top out again, but for now as long as we are above VAH consolidation levels the reversal trend may remain intact.
the ability of this market to recover fully is still very much in question, but for now the daily levels in major equities are reading a technical squeeze.
the daily trend could still retrace to VAH, and very well may sell off POC or 4hr value gap areas according to market structure.

S&P bulls attempt to regain control but they are not there yetLast week, using oversold bounce, buyers attempted to regain control over the price. Their effort was somewhat successful, as they managed to establish both a higher low and a higher high on the daily chart. However, they failed to set a weekly low, which was a challenging task given the magnitude of the previous week's range. This indicates that bears still maintain control over the weekly (and monthly) timeframes, suggesting that we should expect to see more selling pressure in the short term.
The immediate objective for bulls is to test the price above last week's high ( 509.9 ) and to close the month within March's range. They must also protect the last higher low ( 497.5 ) or the last weekly low ( 495.5 ), or else their progress will be undone.
The short term outlook is mildly bearish.
Watch out for volatility on Wednesday as important economic data is released and FED announces decision over interest rate
Disclaimer
I don't give trading or investing advice, just sharing my thoughts.
