Notice!
This is documentation for v3, which is no longer
actively maintained.
For up-to-date documentation, see the latest version.
Custom OHLC bars and candles
You may define your own custom bars and candles in Pine Scripts. There are functions plotbar and plotcandle for that purpose. Here is a small example:
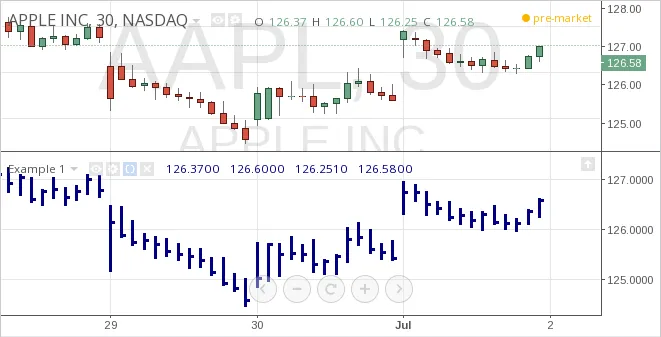
The script Example 1 simply replicates bars of the current symbol. Nothing outstanding. We can paint them with green and red colors:
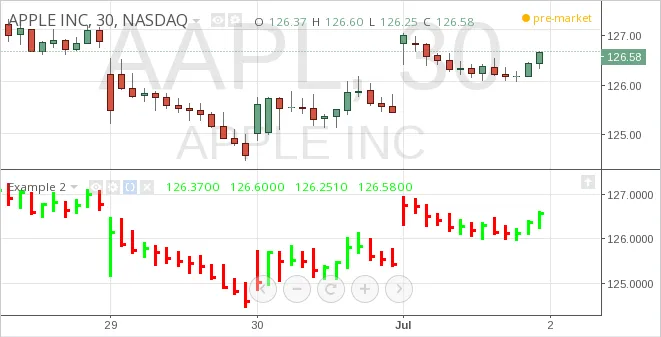
The Example 2 illustrates color argument, which could be given
constant values as red, lime, "#FF9090", as well as expressions
that calculate color (palette variable in the example above) at
runtime.
Function plotcandle is similar to plotbar, it just plots candles
instead of bars and have optional argument wickcolor.
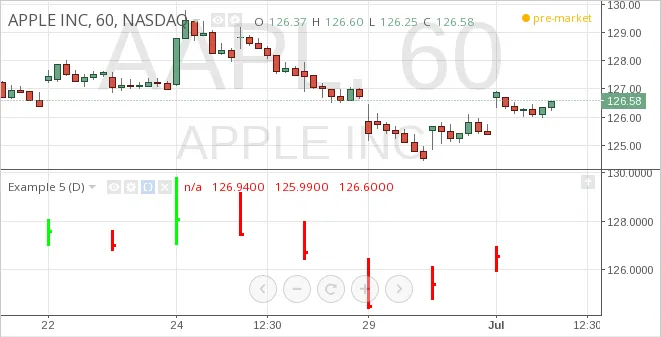
Both plotbar and plotcandle need four series arguments that will be
used as bar/candle OHLC prices correspondingly. If, for example, one of
the OHLC variables at some bar have a na value, then the whole bar is
not plotted. Example:

Of course you may calculate OHLC values without using the available
open, high, low and close values. For example you can calculate
and plot some sort of a smoothed candles:

You may get an interesting effect, if you plot OHLC values taken from a higher timeframe. Let’s say you want to plot daily bars on 60 minute chart:
Functions plotbar and plotcandle also have a title argument, so
user can distinguish them in Styles tab of Format dialog.