Notice!
This is documentation for v3, which is no longer
actively maintained.
For up-to-date documentation, see the latest version.
Plotting shapes, chars and arrows
In situations when you need to mark, highlight bars on a chart and not
draw a usual plot in the form of a line, the function plot may not be
a good fit. Although it’s possible to execute this kind of task by
applying plot in combination with the styles style=circles or
style=cross, it’s recommended to use the functions plotshape,
plotchar, plotarrow.
plotshape function
The plotshape function is designed for displaying, under or above bars, a few icon-shapes. For example, the script below will draw an “X” above all green bars:
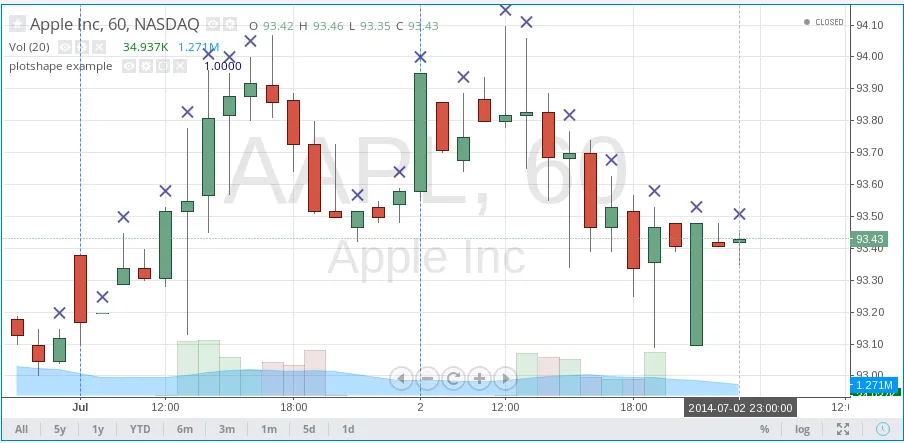
The first parameter, data, is considered as a series of logical
values. The crosses are drawn on each true value and not on false values
or na values. It’s possible to transfer a series of logical values in
plotshape to any series of numbers. It’s possible to transfer any
series of numbers to plotshape. A 0 or na is considered a false
value, any other value is considered true.
By changing the value of the parameter style is possible to change the
form of the icon-shape. The available styles are:
| Shape Name | Shape | Shape with Text |
|---|---|---|
shape.xcross |  | |
shape.cross |  | |
shape.circle |  | |
shape.triangleup |  | |
shape.triangledown |  | |
shape.flag |  | |
shape.arrowup |  | |
shape.arrowdown |  | |
shape.square |  | |
shape.diamond |  | |
shape.labelup |  | |
shape.labeldown |  |
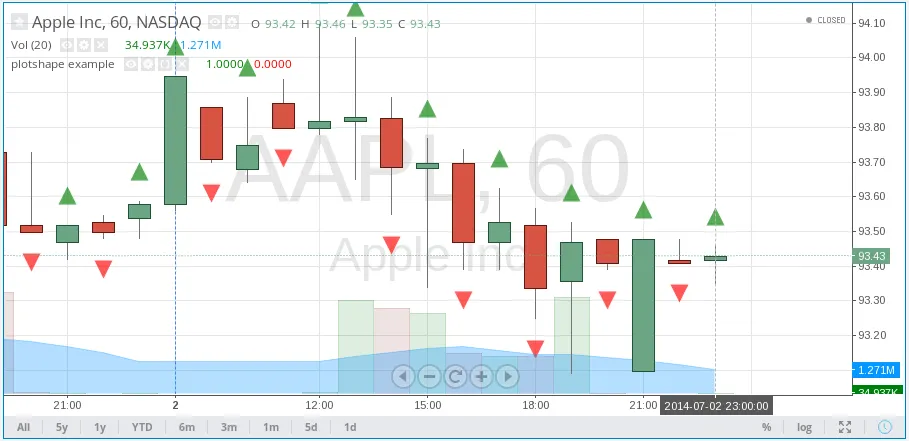
The function plotshape draws, by default, icons/shapes above bars. To
set another position for the shapes, it’s possible with the parameter
location. For example, the following script draws a green shape
shape.triangleup above the green bars and a red shape
shape.triangledown below the red bars:
Possible values for the parameter location:
location.abovebar— above a bar.location.belowbar— below a bar.location.top— top of a chart.location.bottom— bottom of a chart.location.absolute— any set/specified point on a chart.
The value location.absolute should be applied when the shapes need to
be applied on the chart without being linked to the chart’s bars or
edges. In such a case a value of the first parameter of the function
plotshape is used as an y coordinate.
The example ‘plotshape example 2’ also illustrates that the shapes’
color can be set by the parameter
color. Similar to the parameter color of the function plot, it’s possible to transfer expressions which will calculate the icon-shapes’ color depending on conditions at runtime. For example:
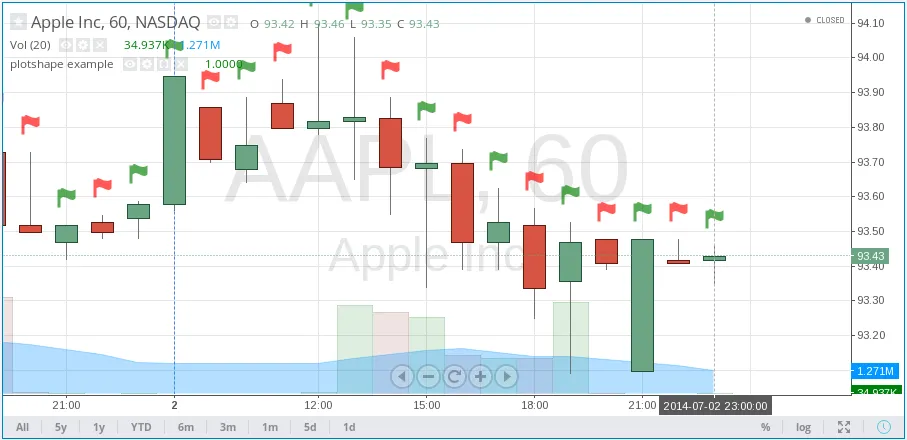
In the given example, the first parameter of the function plotshape is true which means that a shape is displayed at every bar.
The color is calculated by the condition color=data? green :red.
Some other features of the plotshape function:
- Set the name of a displayed series of data using the parameter
title. - Shift a series of shapes to the left/right using the parameter
offset. - Set the transparency of shapes with the parameter
transp. - Use
textparameter to display some short text above/below the shape. You may use\nto separate text lines.
plotchar function
plotchar’s primary difference from plotshape is in the way it assigns icon-shapes.
In plotchar, it is set through the inline parameterchar, allowing any encoding unicode symbol to be used (which are supported by the in-use font). For example:
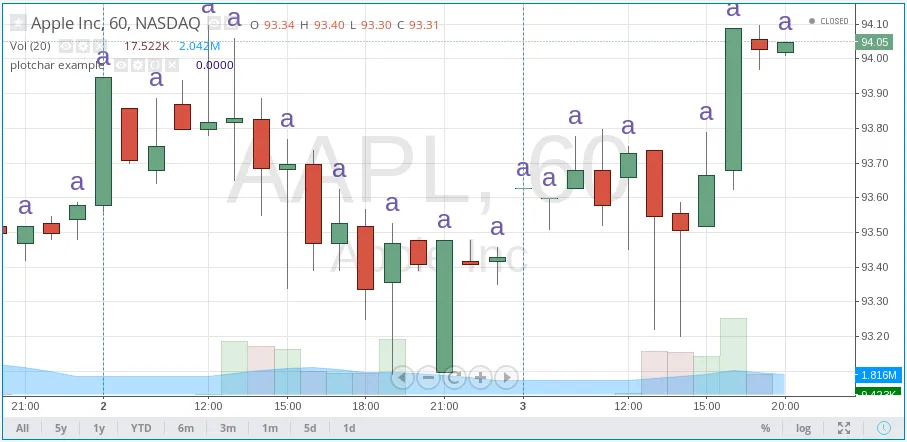
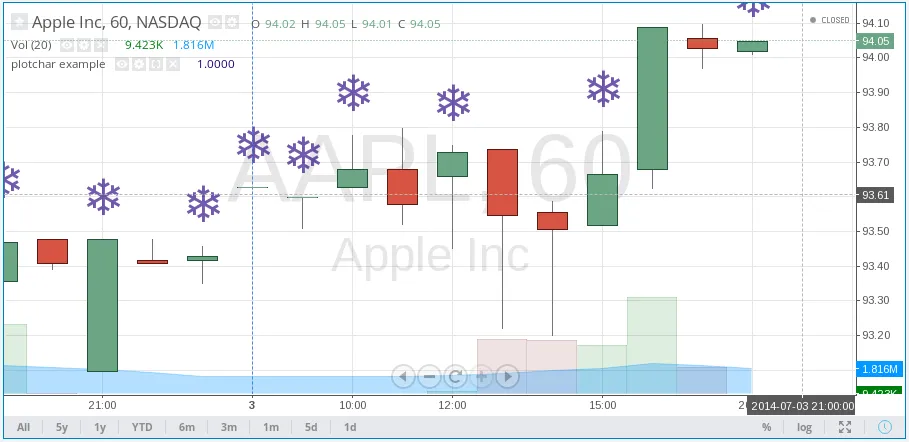
By default, the parameter char accepts the value ★ (U+2605, the “BLACK STAR” character). It’s possible to use any letters, digits or various symbols, for example: ❤, ☀, €, ⚑, ❄, ◆, ⬆, ⬇.
Example of the “SNOWFLAKE” (❄, U+2744) character usage:
Like plotshape, the function plotcharallows:
- Set a shape’s color, with a constant or complex arithmetic expression using parameter
color. - Set a shape’s location with the parameter
location. - Set the name of a displayed series of data using the parameter
title. - Shift a series of shapes left/right using the parameter
offset. - Set the transparency of shapes using the parameter
transp. - Use the
textparameter to display some short text above/below the shape. You may use\nto separate text lines.
plotarrow function
The function plotarrow allows for up/down arrows to be displayed on the chart. The arrows’ lengths are not the same on each bar and are calculated by the script code (depending on the conditions calculated).
The first series parameter of the function plotarrow is used to place arrows on the chart, using the following logic:
- If
seriesvalue on the current bar is greater than 0, then an up arrow will be drawn, the length of the arrow proportionally to an absolute value. - If
seriesvalue on the current bar is less than 0, then a down arrow will be drawn, the length of the arrow proportional to an absolute value. - If
seriesvalue on the current bar is equal to 0 ornathen the arrow is not displayed.
Here is a simple script that illustrates how plotarrow function works:
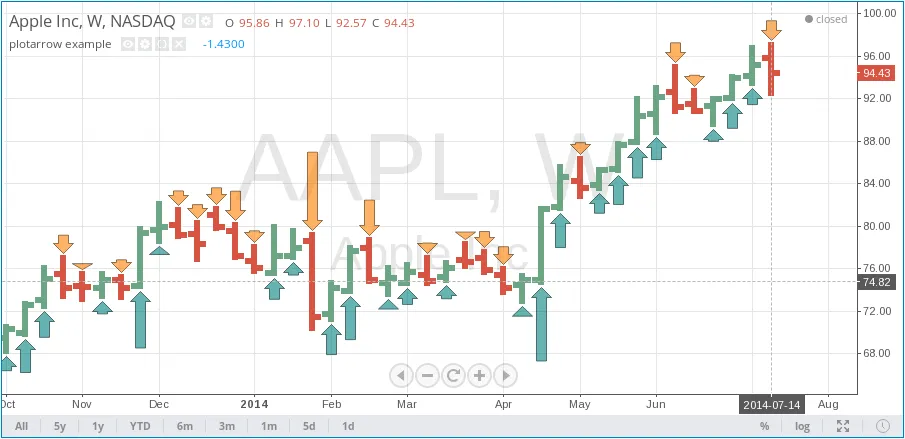
As you can see, the more absolute value of the difference close - open the longer the arrow. If close - open is greater than zero, then an up arrow is rendered,
otherwise (when close - open is less than zero) we have a down arrow. For another example, it’s possible to take the indicator Chaikin Oscillator from the
standard scripts and display it as an overlay above a series in the form of arrows using plotarrow:
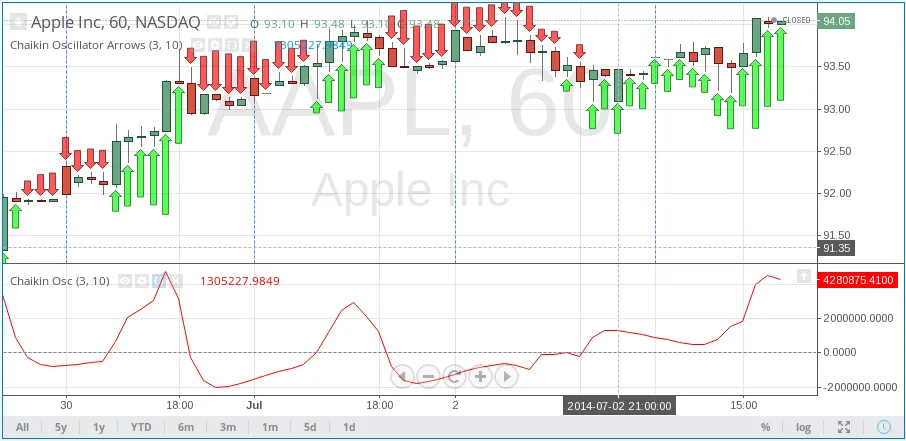
This screenshot shows the original Chaikin Oscillator alongside the script for better understanding.
As was stated earlier, the high of the arrow is chosen proportionally to the absolute value of the first series parameter of the function plotarrow.
The maximum and minimum possible sizes for the arrows (in pixels) are set by the parameters minheight and maxheight respectively.
Additionally, the function plotarrow allows:
- Set the name of a displayed series of data using the parameter
title. - Set the color of an up arrow using the parameter
colorup. - Set the color of a down arrow using the parameter
colordown. - Shift a series of arrows left/right using the parameter
offset. - Set the transparency of shapes with the parameter
transp.
It’s important to note that the colorup and colordown parameters should receive a constant value of the color type.
Using expressions for determining color (as is done in plot, plotshape, plotchar) is not allowed.