Notice!
This is documentation for v3, which is no longer
actively maintained.
For up-to-date documentation, see the latest version.
Price levels, hline
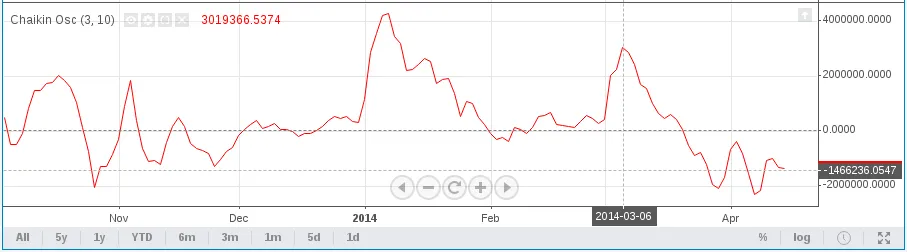
The annotation function hline renders a horizontal line at a given fixed price level. For example:
study(title="Chaikin Oscillator", shorttitle="Chaikin Osc")
short = input(3,minval=1), long = input(10,minval=1)
osc = ema(accdist, short) - ema(accdist, long)
plot(osc, color=red)
hline(0, title="Zero", color=gray, linestyle=dashed)
A number must be the first argument of hline. Values of a series
type are forbidden. It’s possible to create a few horizontal lines with
the help of hline and fill in the background between them with a
translucent light using the function
fill.