Notice!
This is documentation for v4, which is no longer
actively maintained.
For up-to-date documentation, see the latest version.
Custom OHLC bars and candles
You may create your own custom bars and candles in Pine scripts by using the plotbar and plotcandle annotation functions:

Example 1 simply replicates bars of the current symbol. To color them green or red, we can use the following code:

Example 2 illustrates using the color argument, which can be given
constant values such as red, lime, "#FF9090", as well as
expressions that calculate colors conditionally at runtime (see the
palette variable in the example above).
The plotcandle annotation function is similar to plotbar, but it
plots candles instead of bars and has an optional argument: wickcolor.
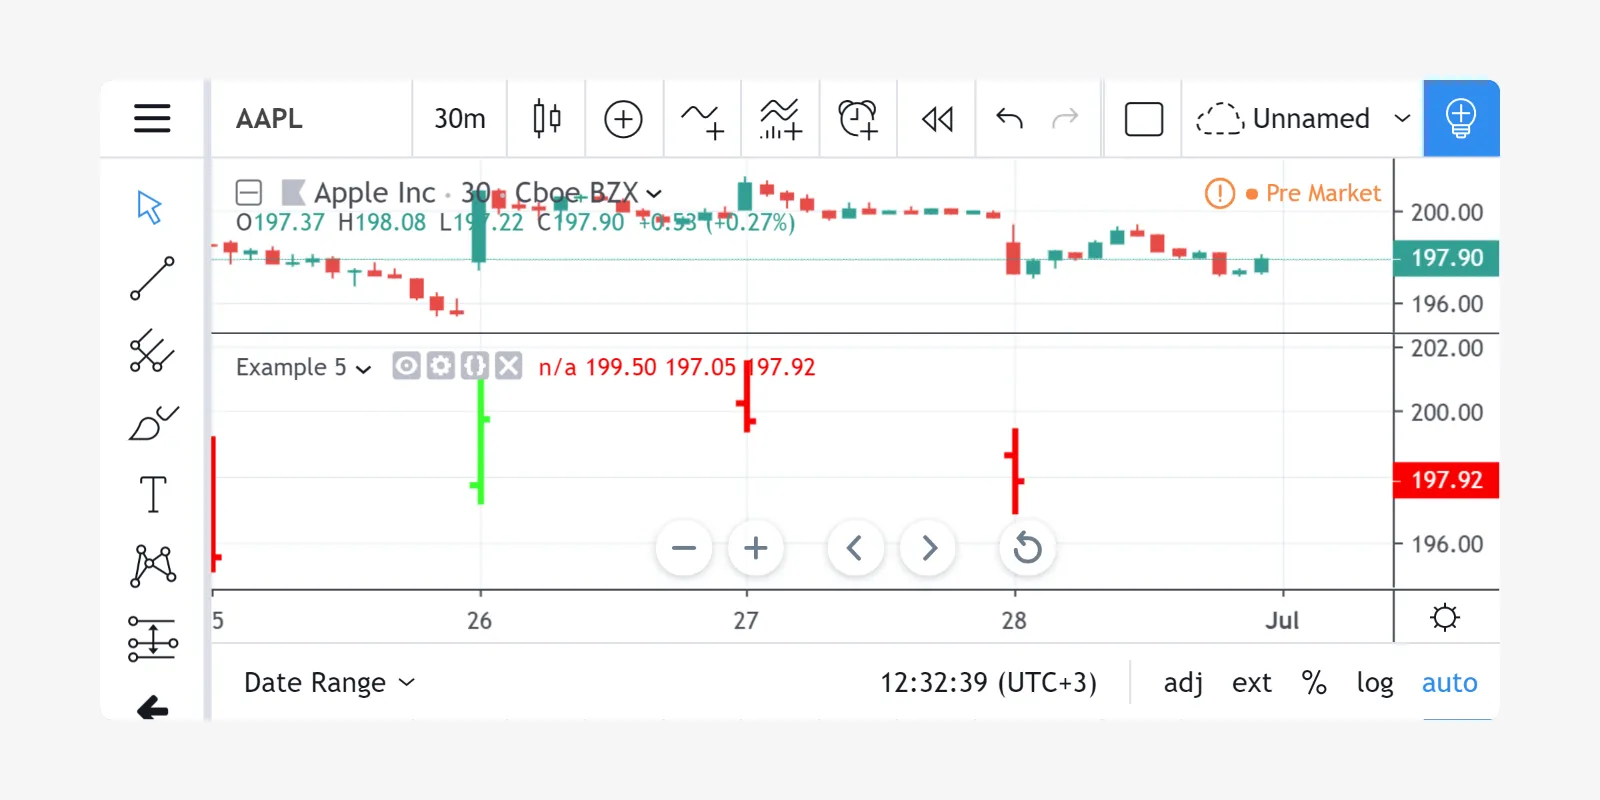
Both plotbar and plotcandle need four series as the arguments that
will be used for new bar/candle OHLC prices. If one of the arguments for
a bar has a na value, then the bar is not plotted. Example:
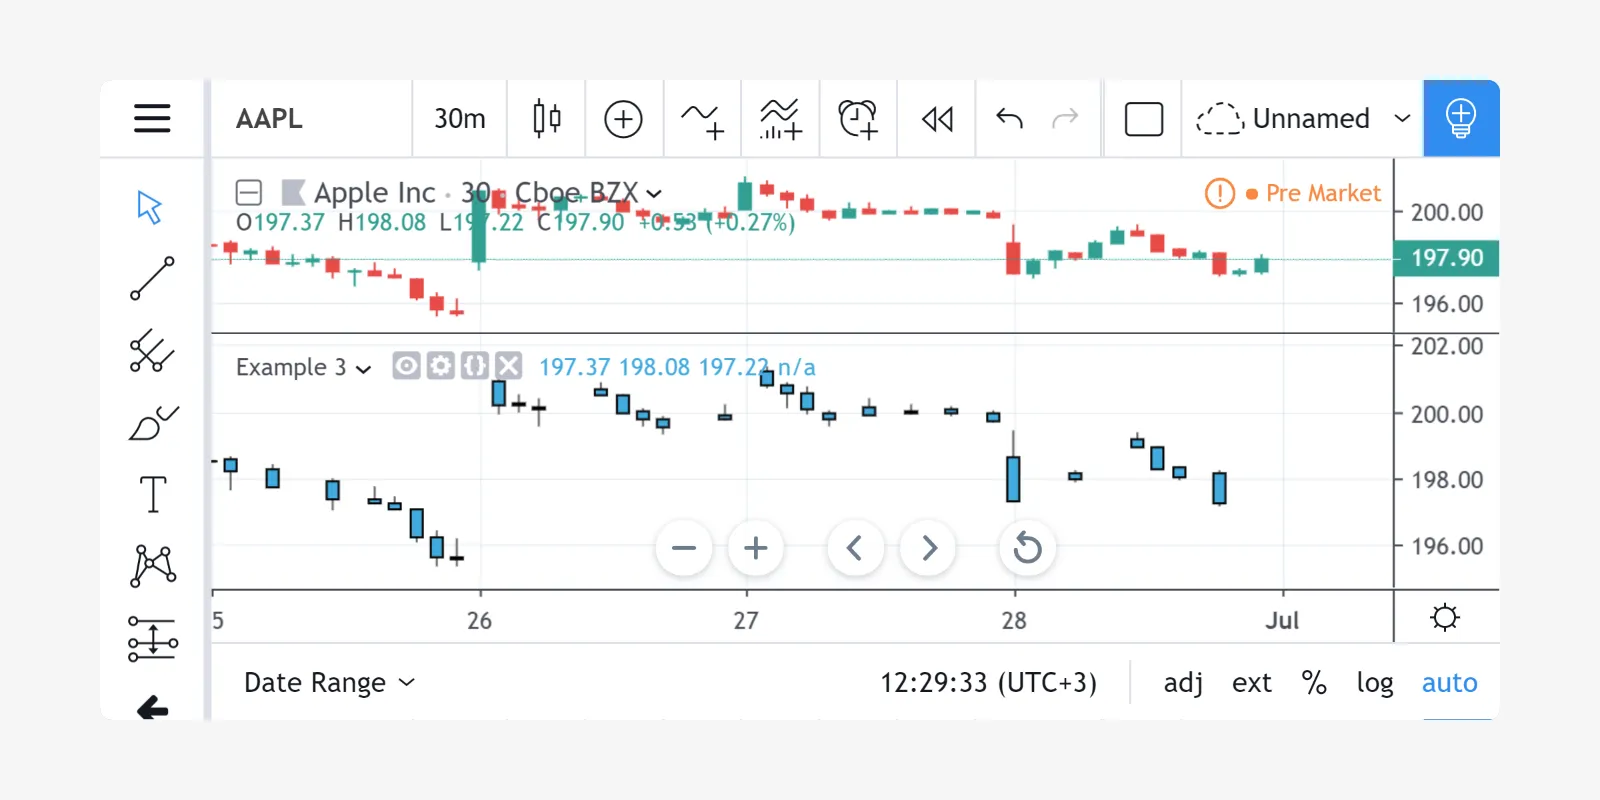
You can build bars or candles using values other than the actual OHLC values. For example you could calculate and plot smoothed candles using the following code:

You may find it useful to plot OHLC values taken from a higher timeframe. You can, for example, plot daily bars on a 60 minutes chart:
The plotbar and plotcandle annotation functions also have a title
argument, so users can distinguish them in the Style tab of the
Settings dialog box.