Notice!
This is documentation for v4, which is no longer
actively maintained.
For up-to-date documentation, see the latest version.
Plotting shapes, chars and arrows
There are situations where you need to mark or highlight specific bars
on a chart, and where a usual line plot using plot may not be optimal.
Although it may be possible to do so using plot with
style=plot.style_circles or style=plot.style_cross, it is often
easier to use the plotshape, plotchar and plotarrow annotation
functions.
plotshape
The plotshape function can display a variety of shapes. The script below will draw an “X” above all green bars:
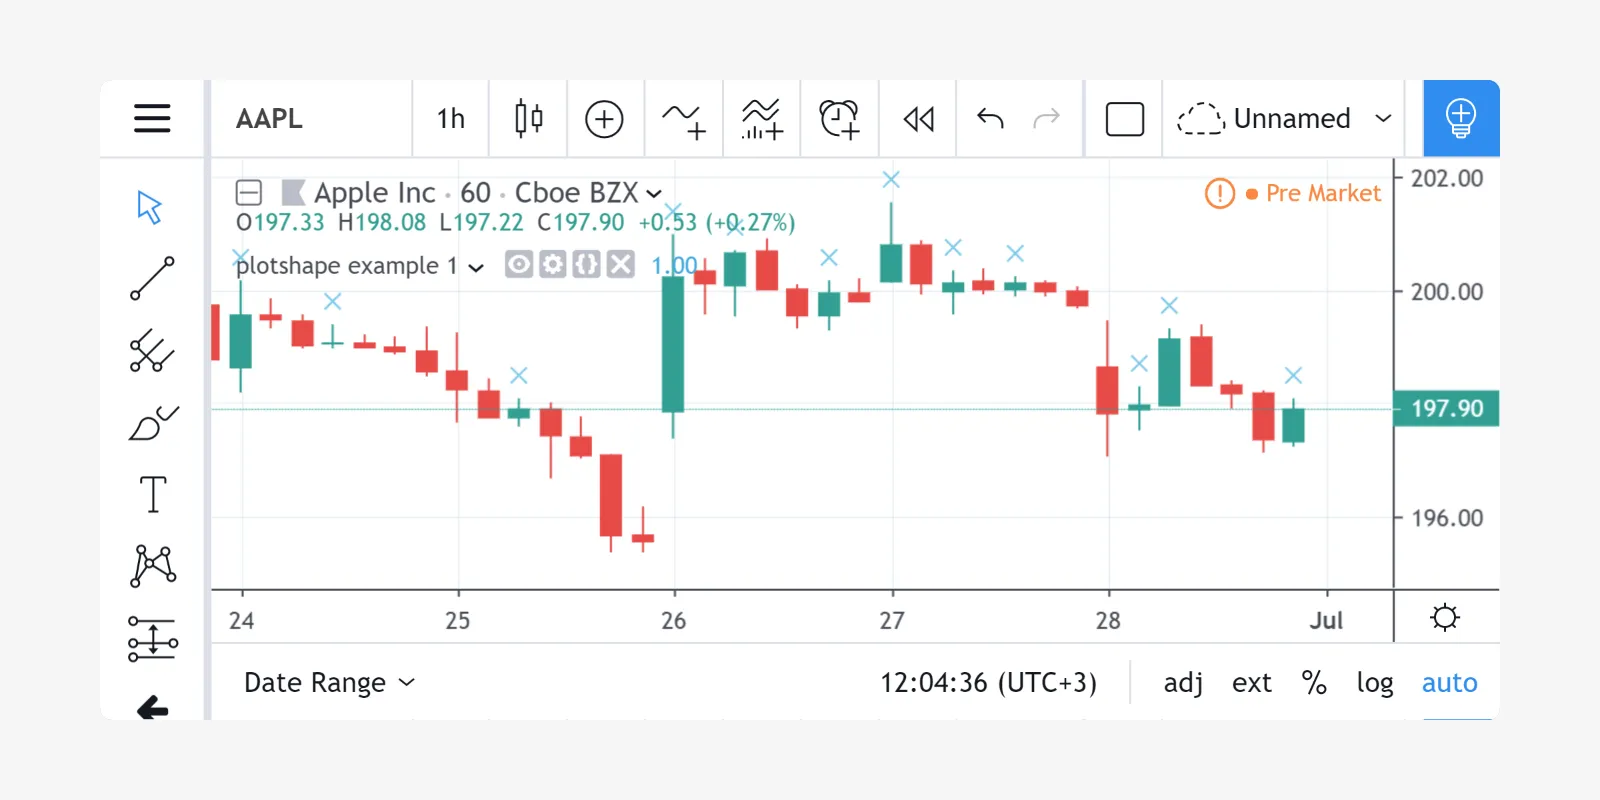
The first parameter, data, is used as a series of logical values. The
crosses are drawn on each true value. Nothing is drawn on false or na
values. You may use a series of logical values or numbers as the first
argument of plotshape. A 0 or na is considered a false value, any
other value is considered true.
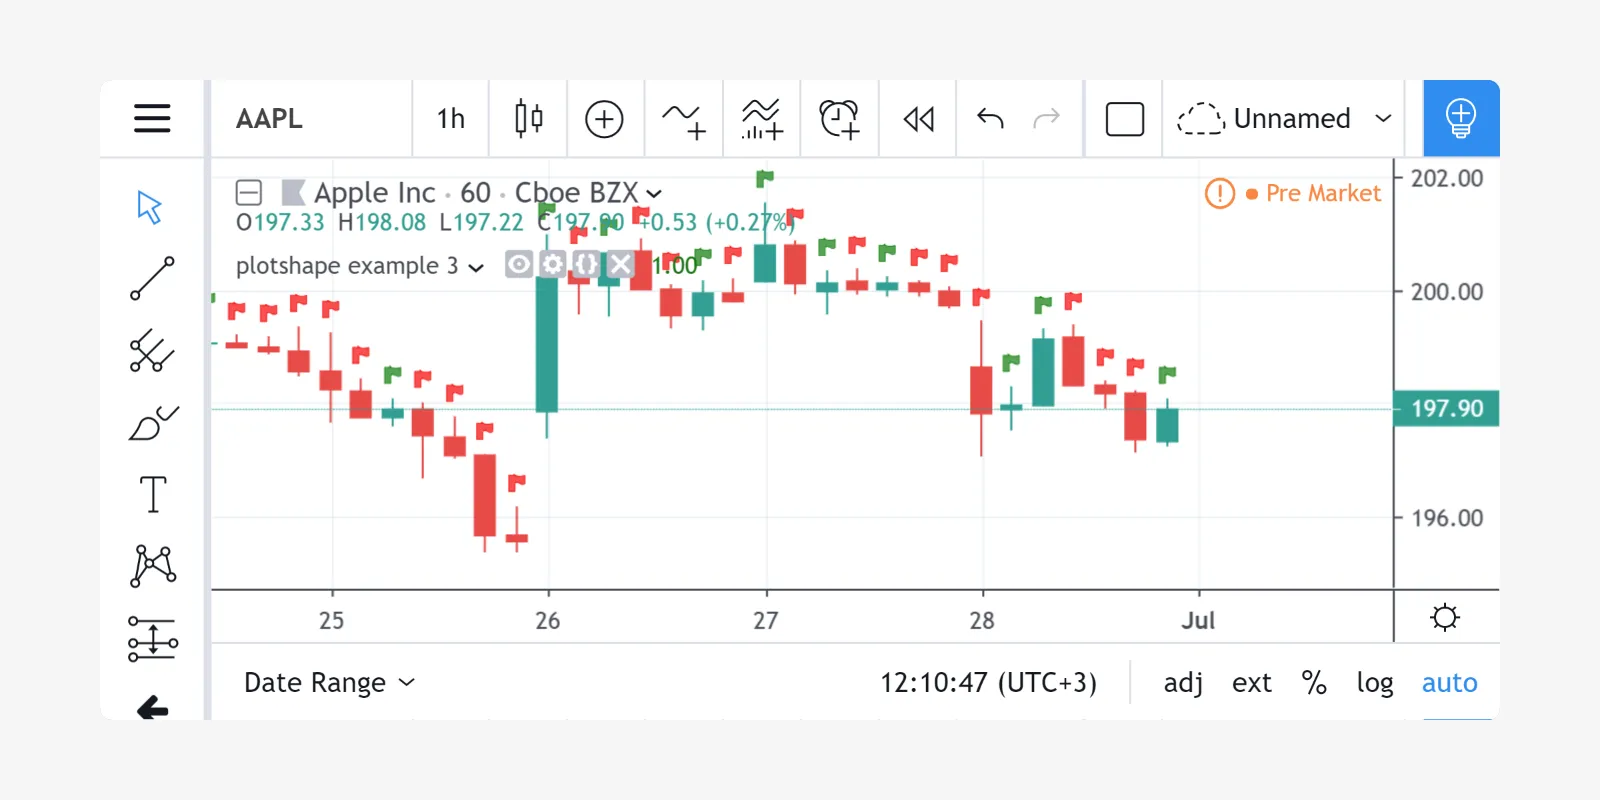
By changing the value of the style parameter, it is possible to vary
the shape. The available styles are:
| Shape Name | Shape | Shape with Text |
|---|---|---|
shape.xcross |  | |
shape.cross |  | |
shape.circle |  | |
shape.triangleup |  | |
shape.triangledown |  | |
shape.flag |  | |
shape.arrowup |  | |
shape.arrowdown |  | |
shape.square |  | |
shape.diamond |  | |
shape.labelup |  | |
shape.labeldown |  |
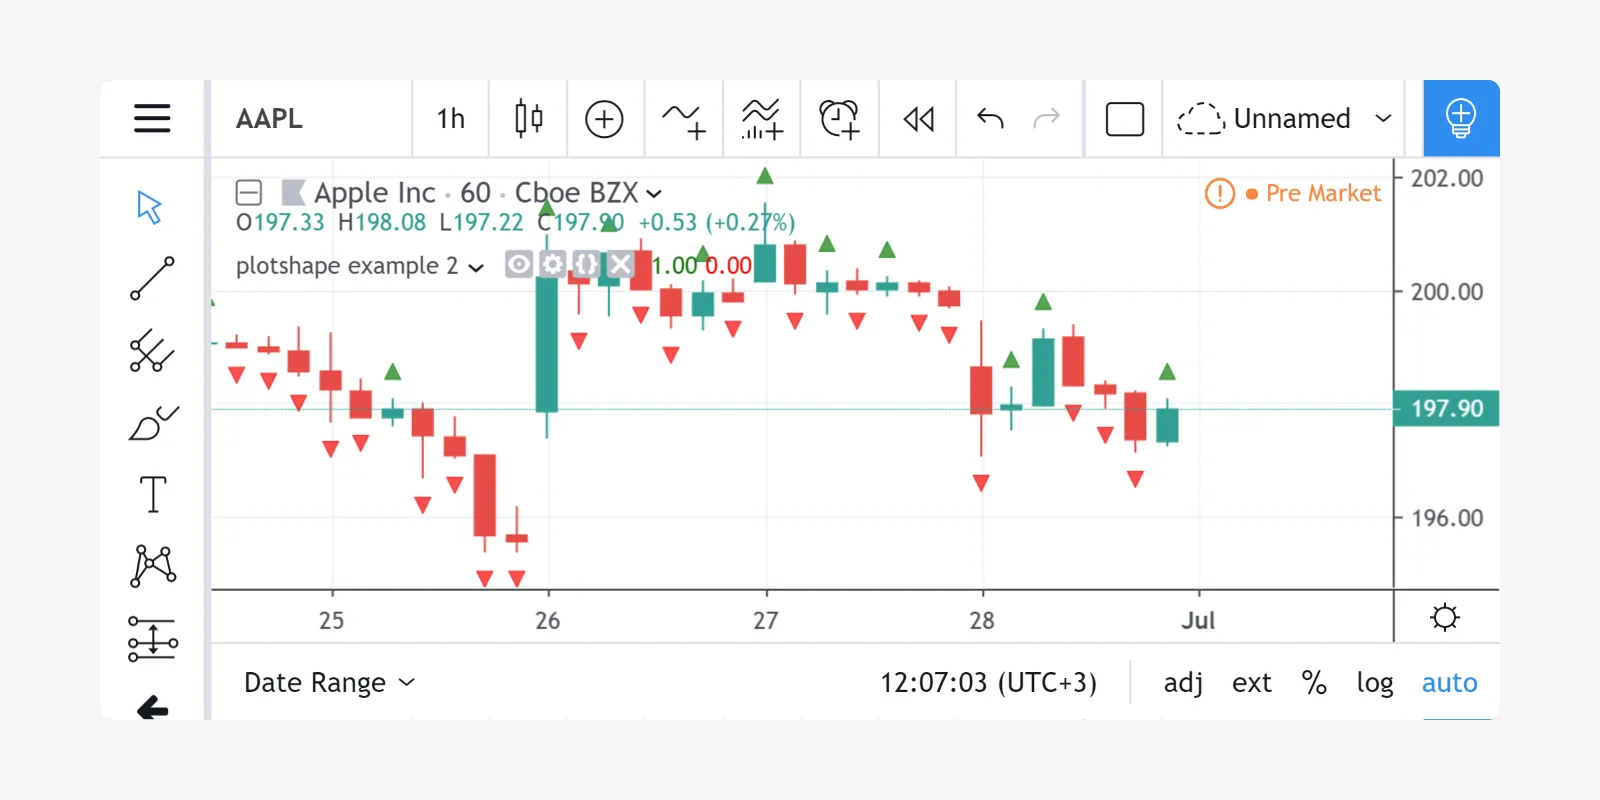
The default position where plotshape draws shapes is above bars. To
use another position, use the location parameter. The following script
draws a green shape.triangleup above the green bars and a red
shape.triangledown below the red bars:
Possible values for the location parameter are:
location.abovebar- above a bar.location.belowbar- below a bar.location.top- top of the script’s y space.location.bottom- bottom of the script’s y space.location.absolute- any position in the y space.
location.absolute can be used when the shapes need to be positioned
more precisely in the script’s y space. The first parameter of the
function is then used as a y coordinate.
‘plotshape example 2’ illustrates how the shape’s color can be
defined using the color parameter and expressions which will calculate
the shape’s color depending on conditions at runtime. For example:
In the given example, the first parameter of the function plotshape is
true, which means that a shape is displayed at every bar. The color is
calculated by the color=data ? color.green : color.red expression.
Other features of the plotshape function:
- Set the name of a displayed series of data using the
titleparameter. - Shift a series of shapes to the left/right using the
offsetparameter. - Set the transparency of shapes with the
transpparameter. - Use the
textparameter to display a short text above/below the shape. You may use\nto separate text lines.
plotchar
The main difference between plotshape and
plotchar
is that with plotchar, the shape is an ASCII or Unicode symbol
(provided it’s supported by the TradingView standard font) defined with
the char parameter. For example:
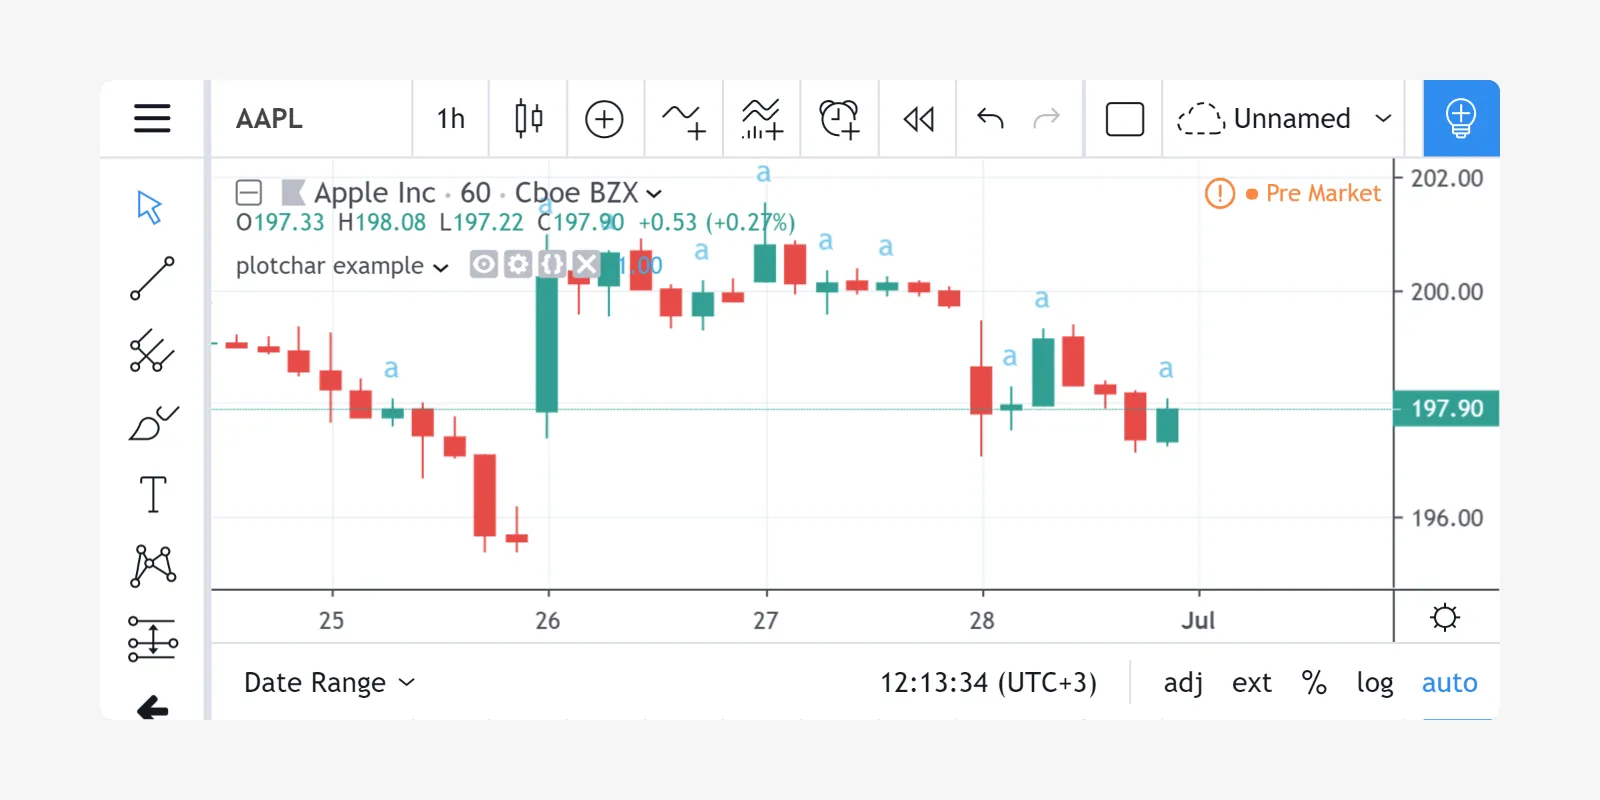
The default character is ★ (U+2605, the “BLACK STAR” character). It’s possible to use any letter or digit and many symbols, for example: ❤, ☀, €, ⚑, ❄, ◆, ⬆, ⬇. The supported character codes are those of the Trebuchet MS font family.
The next example uses the “SNOWFLAKE” (❄, U+2744) character:

Like plotshape, the plotchar function allows you to:
- Set a shape’s color with a constant or complex arithmetic
expression using the
colorparameter. - Set a shape’s location with the
locationparameter. - Set the name of a displayed series of data using the
titleparameter. - Shift a series of shapes left/right using the
offsetparameter. - Set the transparency of shapes using the
transpparameter. - Use the
textparameter to display a short text above/below the shape. You may use\nto separate text lines.
plotarrow
The plotarrow annotation function allows for up/down arrows to be displayed on the chart. The arrow length is not the same on each bar and is calculated from the first parameter’s value.
The first series parameter of the plotarrow function is used to
place arrows on the chart using the following logic:
- If the
seriesvalue on the current bar is greater than 0, then an up arrow will be drawn, the length of which will be proportional to the relative value of the series on that bar in relation to other series values. - If the
seriesvalue on the current bar is less than 0, then a down arrow will be drawn, the length of which will be proportional to the relative value of the series on that bar in relation to other series values. - If the
seriesvalue on the current bar is equal to 0 ornathen the arrow is not displayed.
Here is a simple script that illustrates how the plotarrow function
works:
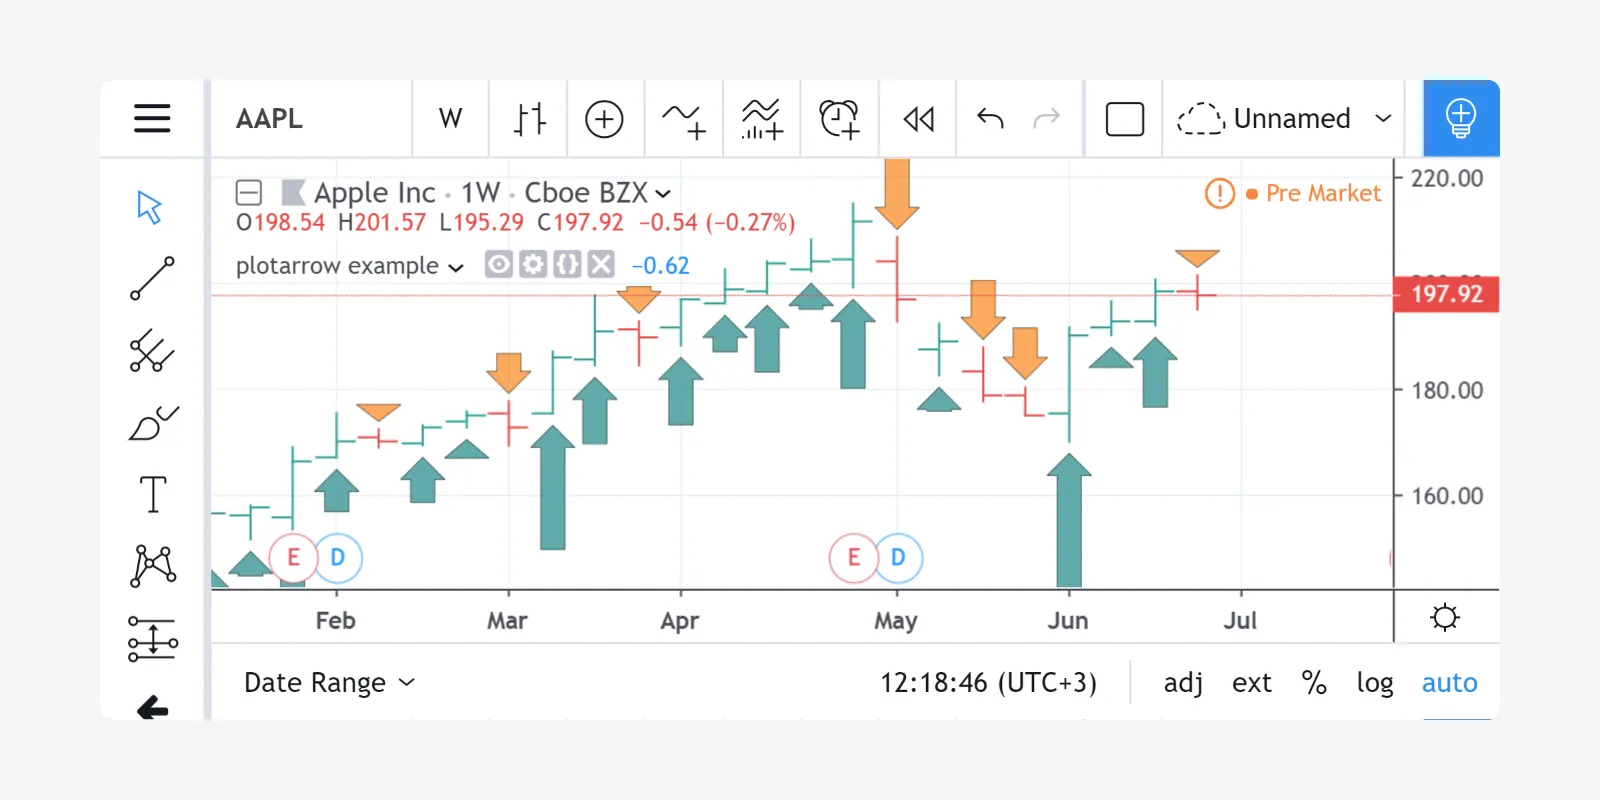
As you can see, the greater the relative value of the close - open
difference, the longer the arrow. If close - open is greater than
zero, then an up arrow is rendered. When close - open is less than
zero, a down arrow is rendered.
In another example, we’ll start from the Chaikin Oscillator script in the built-in scripts and display it as an overlay above a chart using arrows:
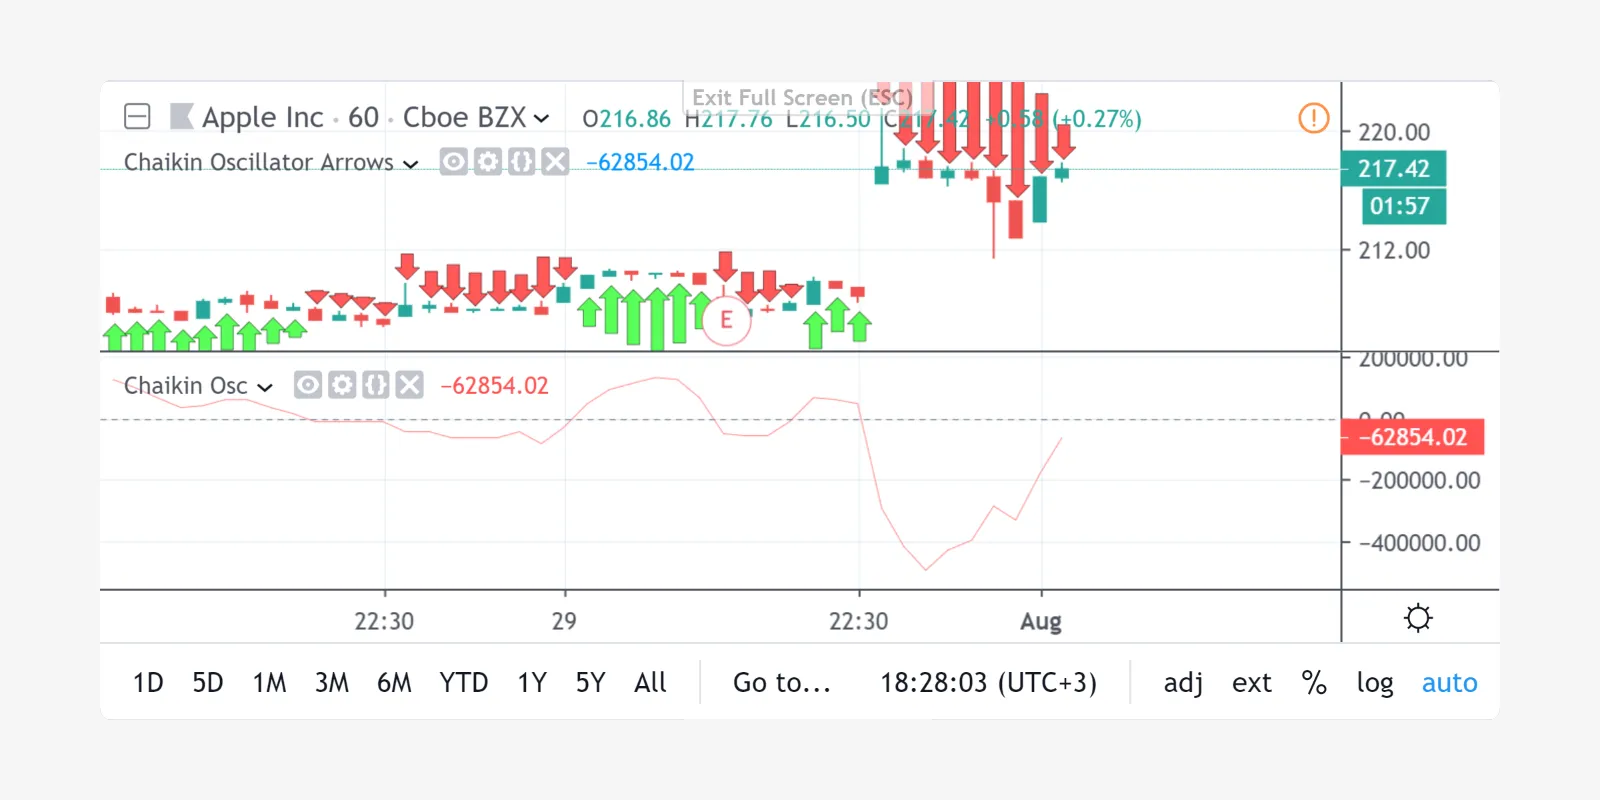
This screenshot shows the original Chaikin Oscillator alongside the script for better understanding.
As was stated earlier, the height of the arrow is proportional to the
relative value of the first series parameter. The maximum and minimum
possible sizes for the arrows (in pixels) can be set using the
minheight and maxheight parameters.
Additionally, the plotarrow function allows you to:
- Set the name of a displayed series of data using the
titleparameter. - Set the color of an up arrow using the
colorupparameter. - Set the color of a down arrow using the
colordownparameter. - Shift a series of arrows left/right using the
offsetparameter. - Set the transparency of arrows with the
transpparameter.
It’s important to note that the colorup and colordown parameters
must receive a constant value of the color type. Using expressions for
determining color (as is done in plot, plotshape or plotchar) is
not allowed.