Notice!
This is documentation for v4, which is no longer
actively maintained.
For up-to-date documentation, see the latest version.
Plot annotation
The plot annotation function has one mandatory parameter: a value of series type, which it displays as a line. A basic call looks like this:
Pine’s automatic type conversions makes it possible to also use any numeric value as an argument. For example:
In this case, the value 125.2 will automatically be converted to a series type value which will be the same number on every bar. The plot will be represented as a horizontal line.
The plot annotation has many optional parameters, in particular those
which set the line’s display style: style, color, linewidth,
transparency, and others.
The value of the color parameter can be defined in different ways. If
it is a color constant, for example color.red, then the whole line
will be plotted using a red color:

The value of color can also be an expression of a series type of
color values. This series of colors will be used to color the rendered
line. For example:

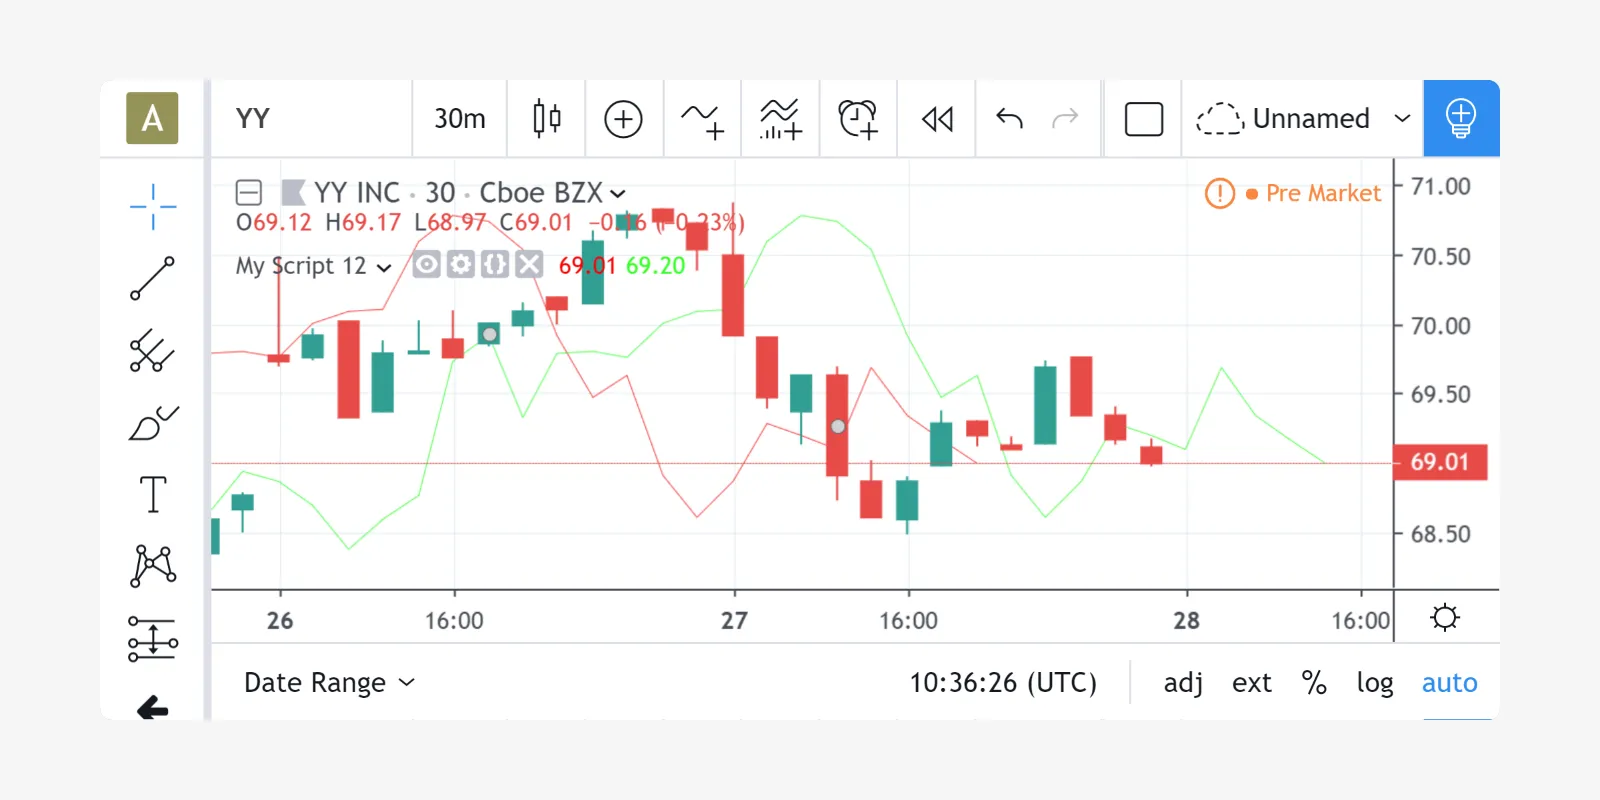
The offset parameter specifies the shift used when the line is plotted
(negative values shift to the left while positive values shift to the
right)1. For example:

As can be seen in the screenshot, the red series has been shifted to the left (since the argument’s value is negative), while the green series has been shifted to the right (its value is positive).
Footnotes
-
In Pine there is a built-in offset function which shifts the values of a series to the right while discarding ‘out of range’ values. The advantage of the
offsetfunction lies in the fact that its result can be used in other expressions to execute complex calculations. In the case ofplotfunction’soffsetparameter, the shift is only cosmetic; the actual values in the series are not moved. ↩