Notice!
This is documentation for v4, which is no longer
actively maintained.
For up-to-date documentation, see the latest version.
Script inputs
The input annotation function makes it possible for script users to modify selected values which the script can then use in its calculation or logic, without the need to modify the script’s code.
Specific widgets are supplied in the Settings/Inputs dialog box for
each type of input. A description of the value as well as
minimum/maximum values and a step increment can also be defined. If the
type of the input variable cannot be inferred at compile time, it can be
explicitly defined using the type parameter.
Pine supports the following types of input:
- input.bool,
- input.color,
- input.integer,
- input.float,
- input.string,
- input.symbol,
- input.resolution,
- input.session,
- input.source,
- input.time.
The following examples show how to create each type of input and what its widget looks like.
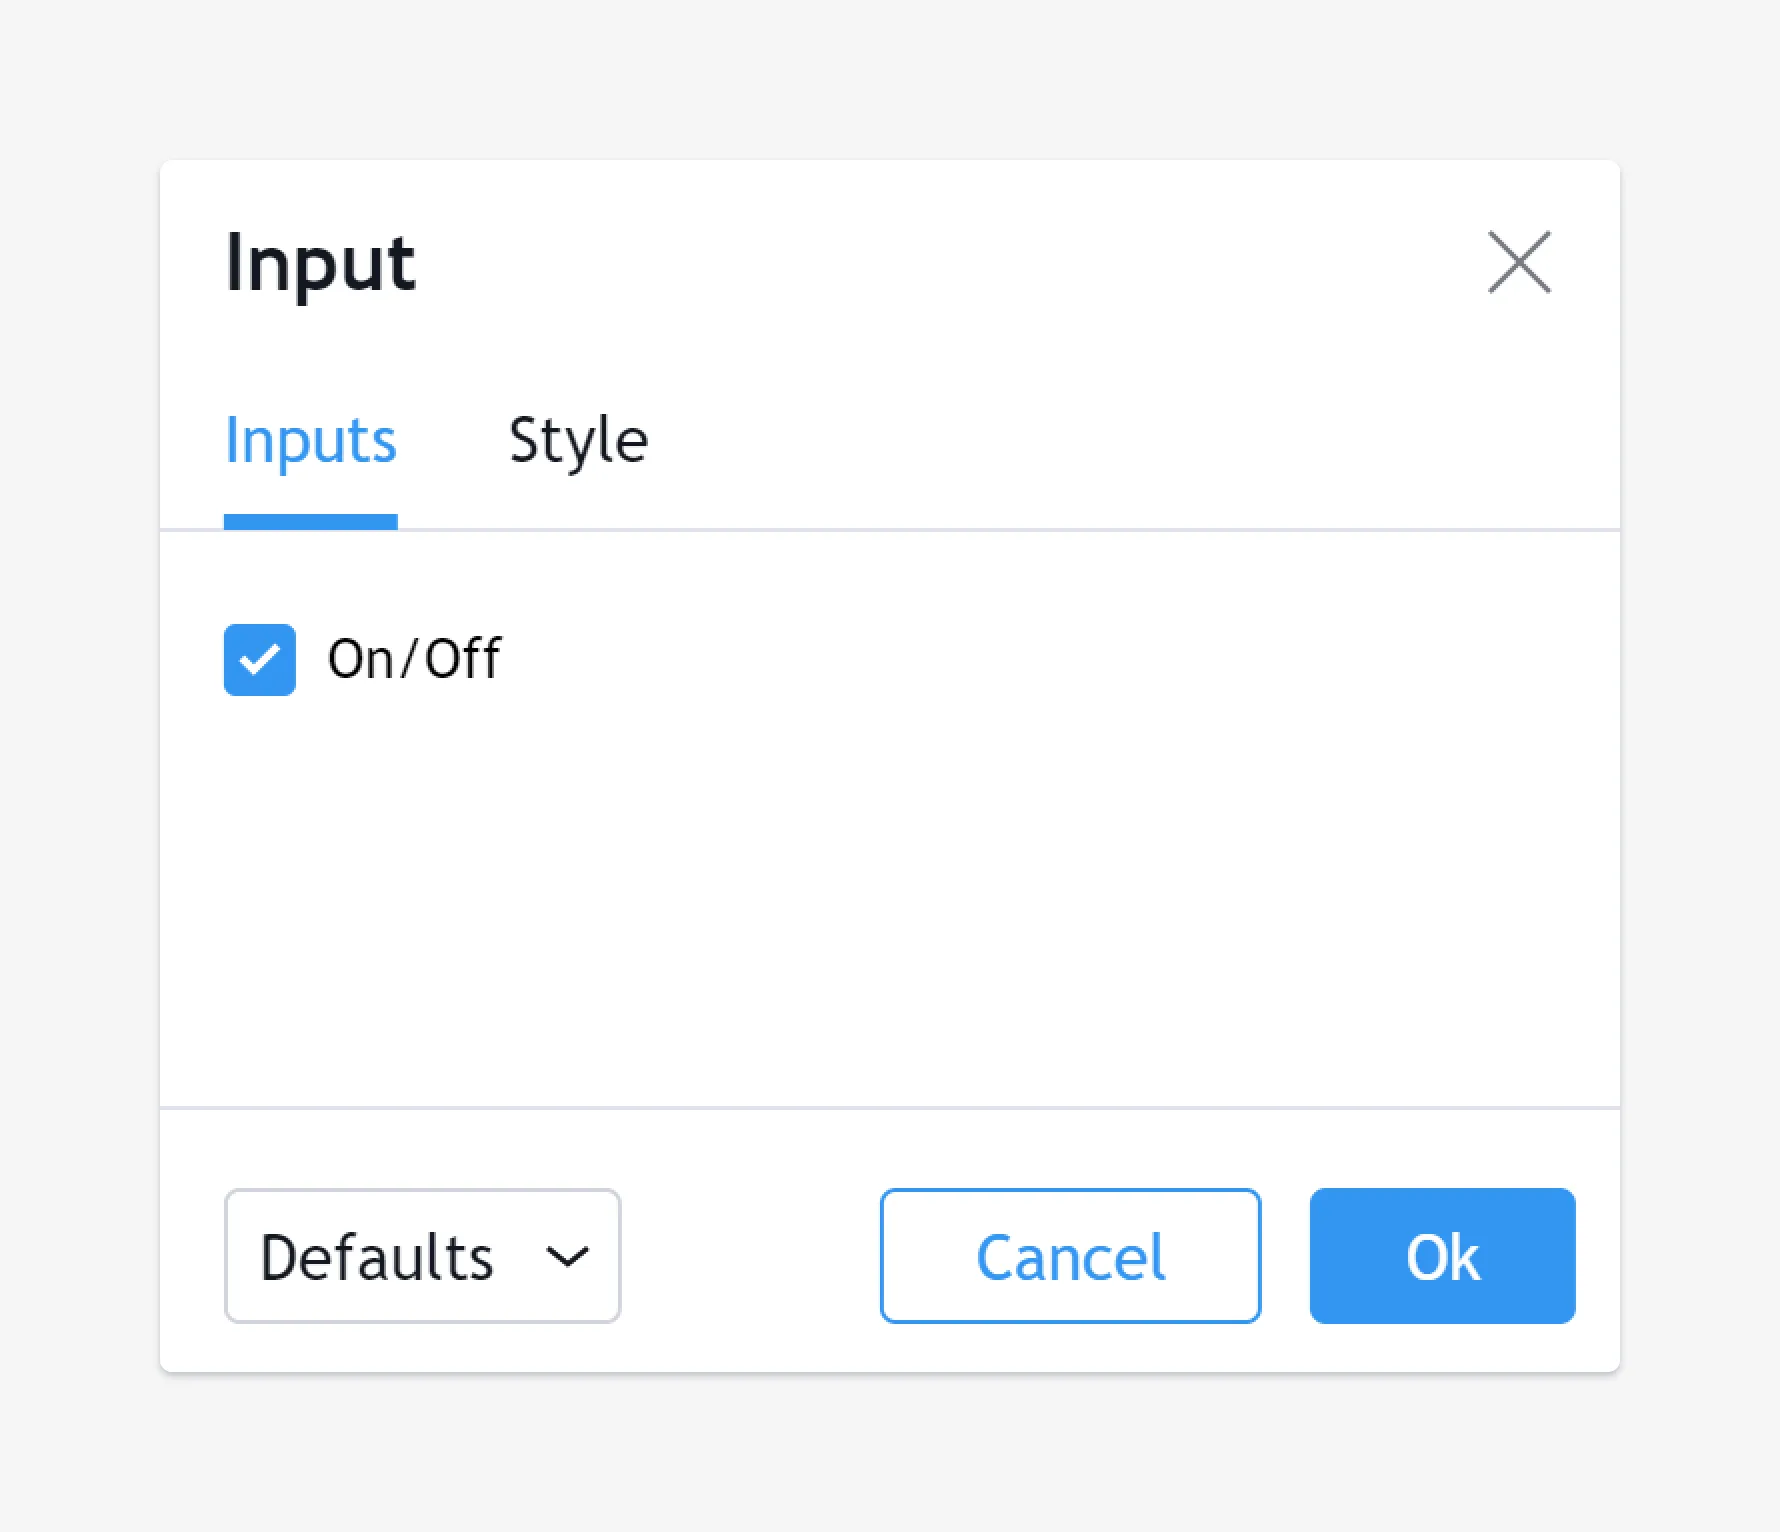
Boolean input
Color input

Integer input
Float input

Symbol and resolution inputs
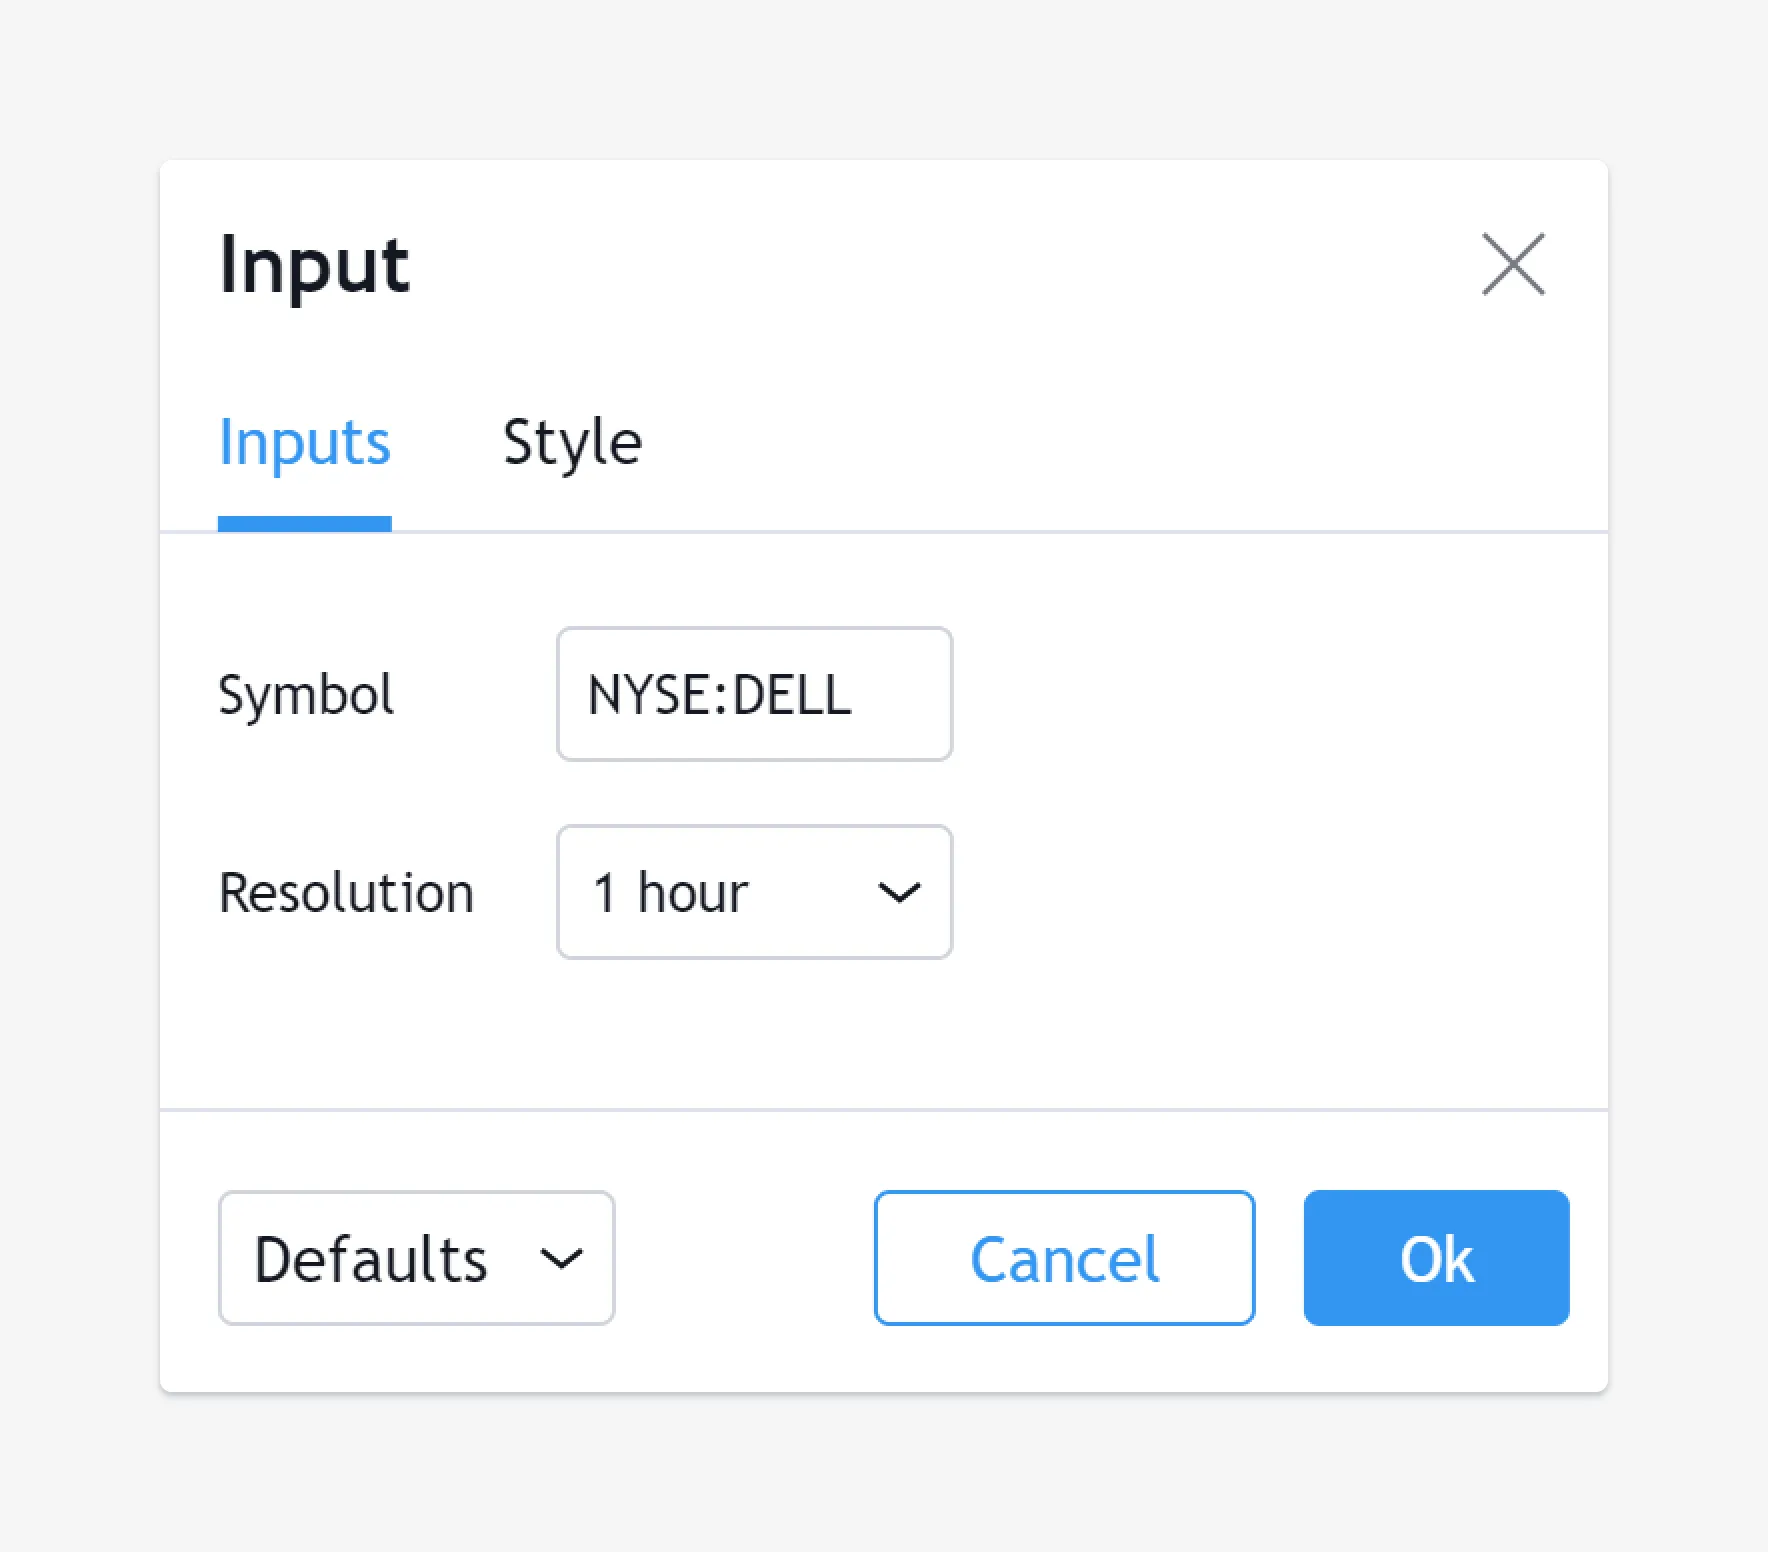
The symbol input widget has a built-in symbol search which activates automatically when the ticker’s first characters are typed.
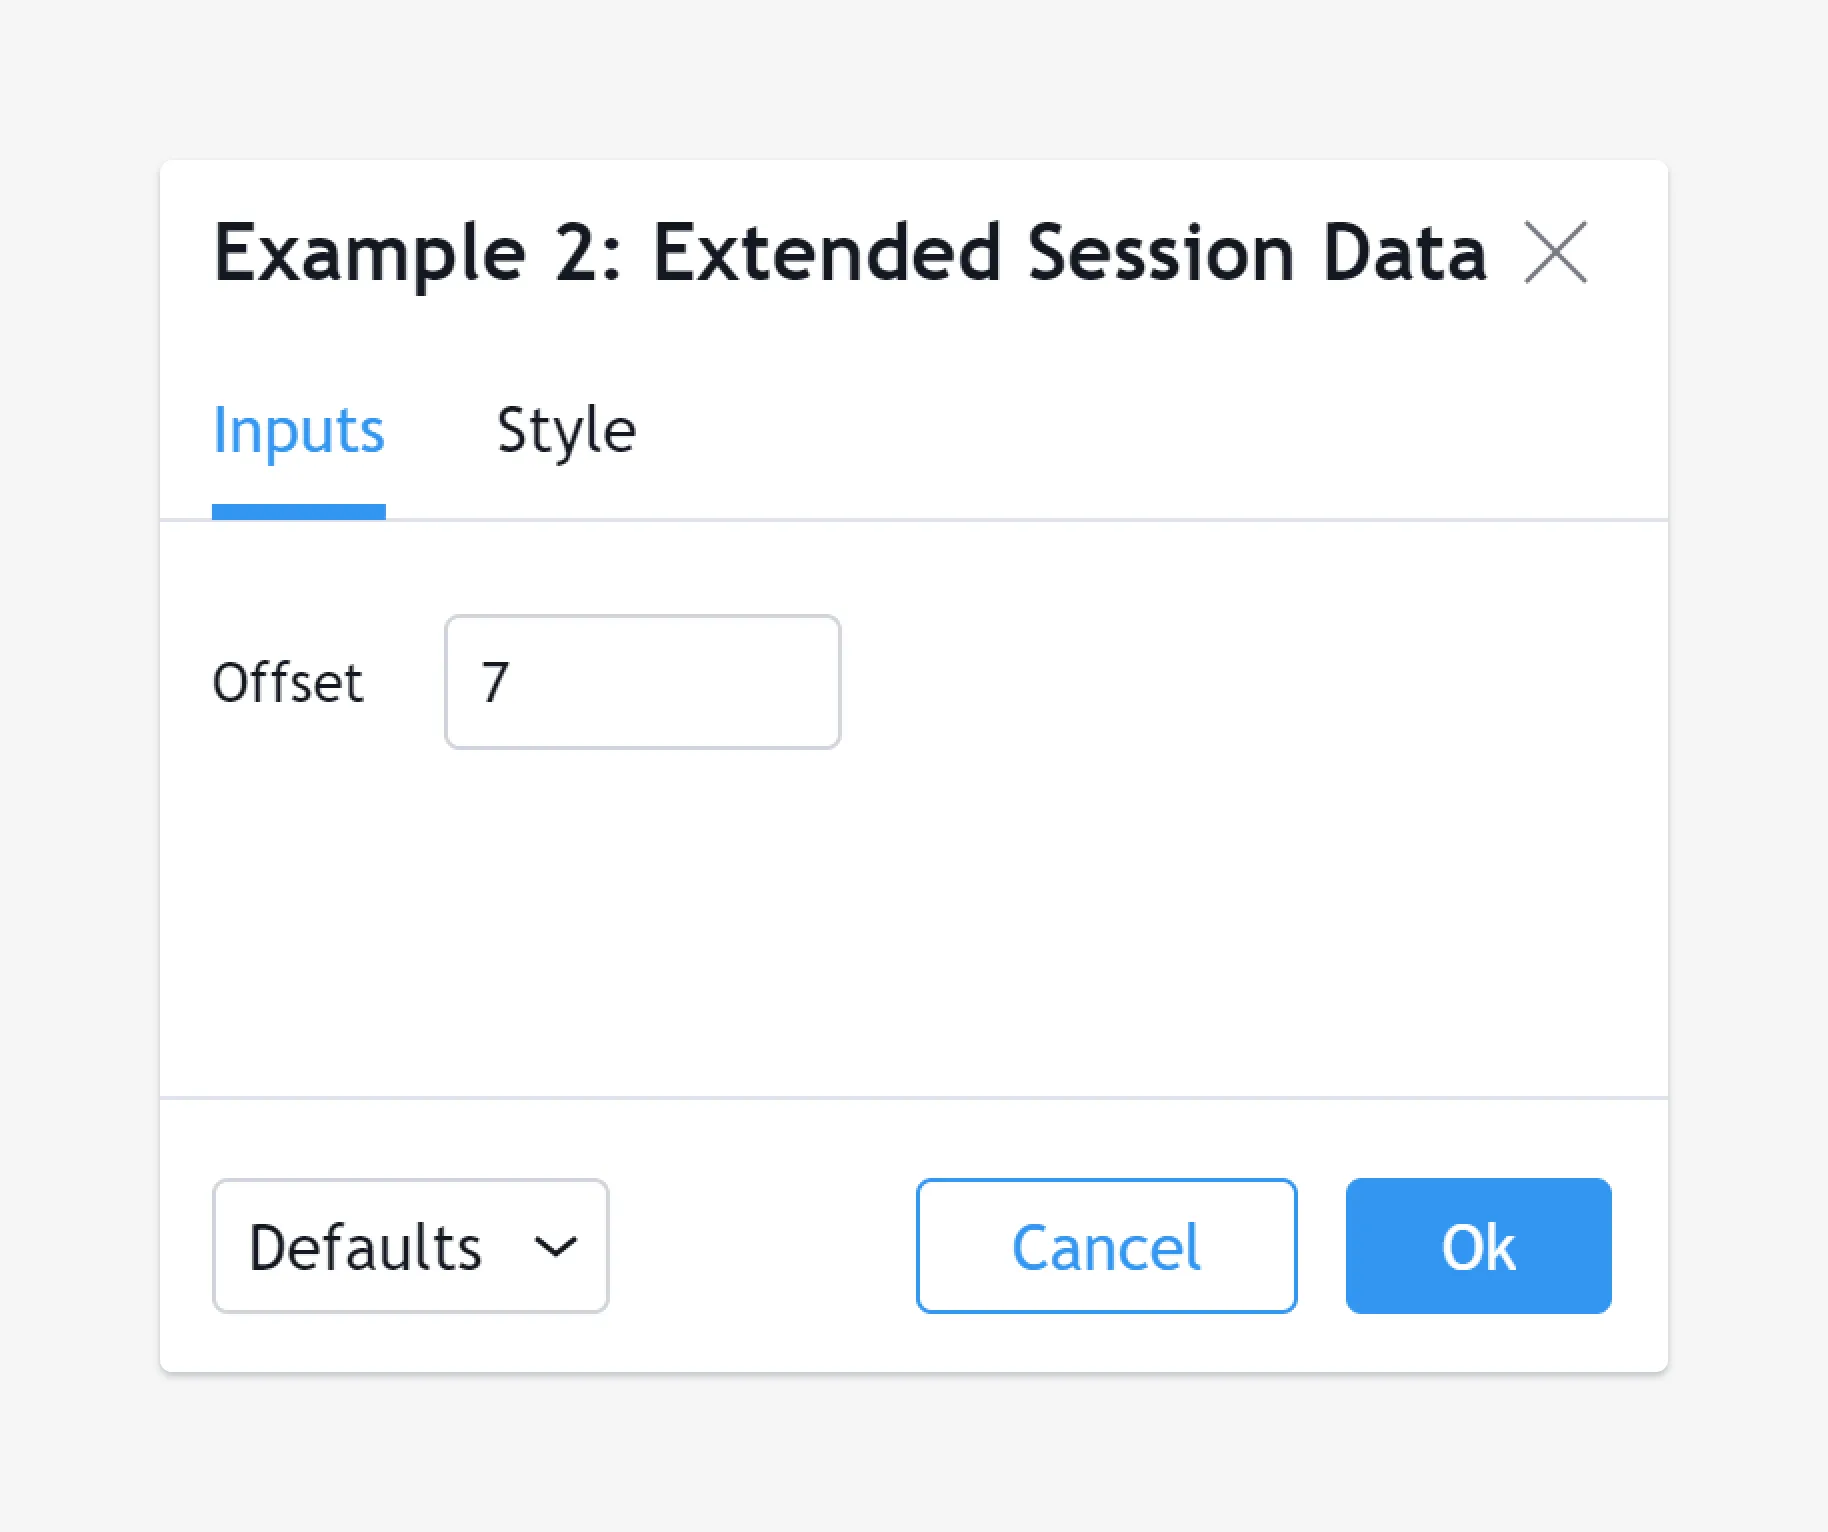
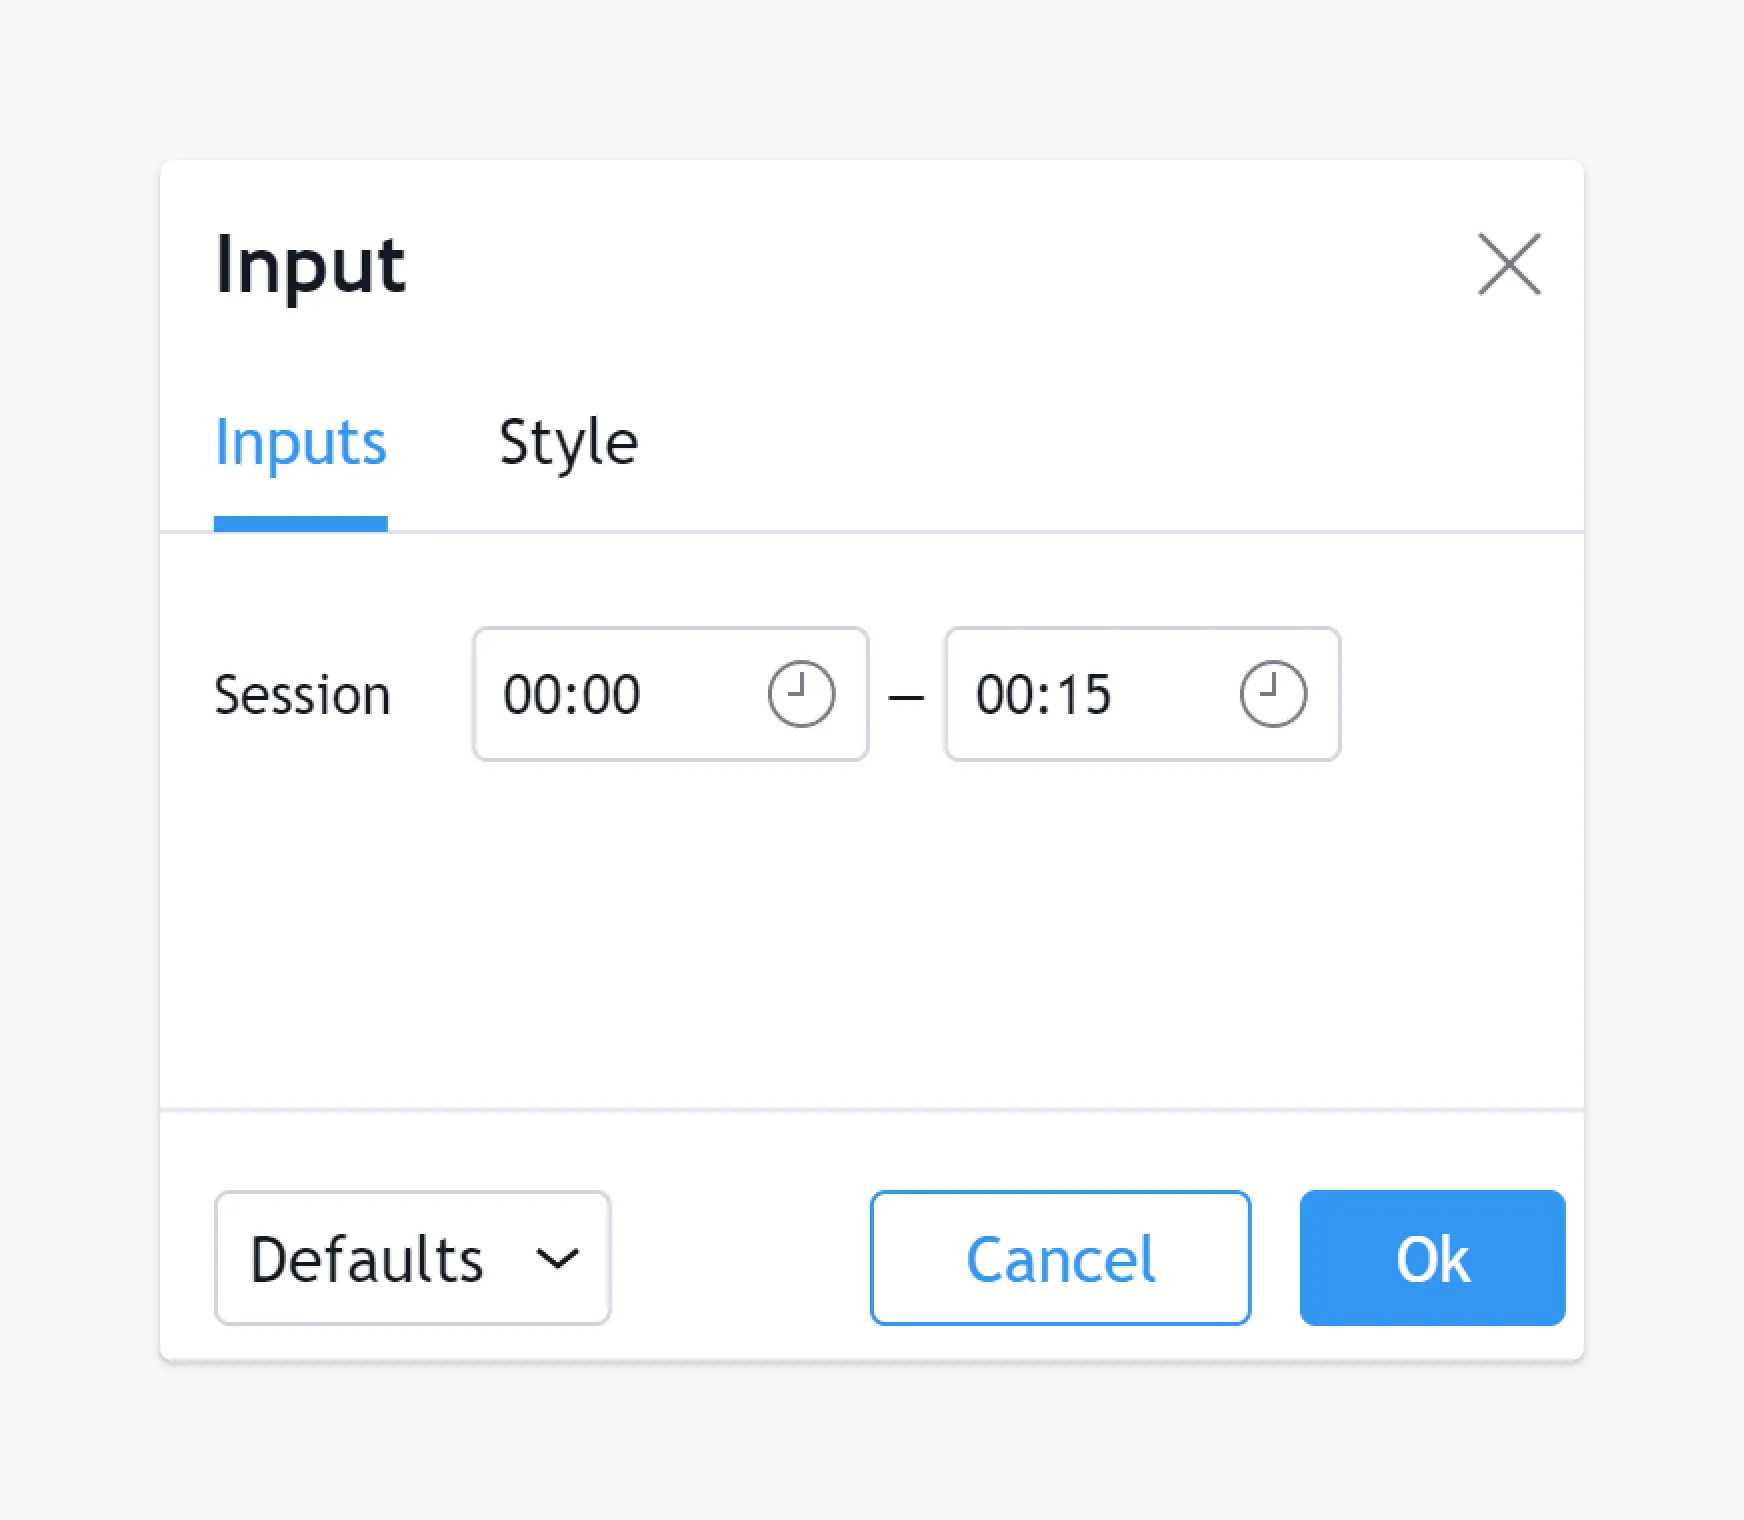
Session input
Source input

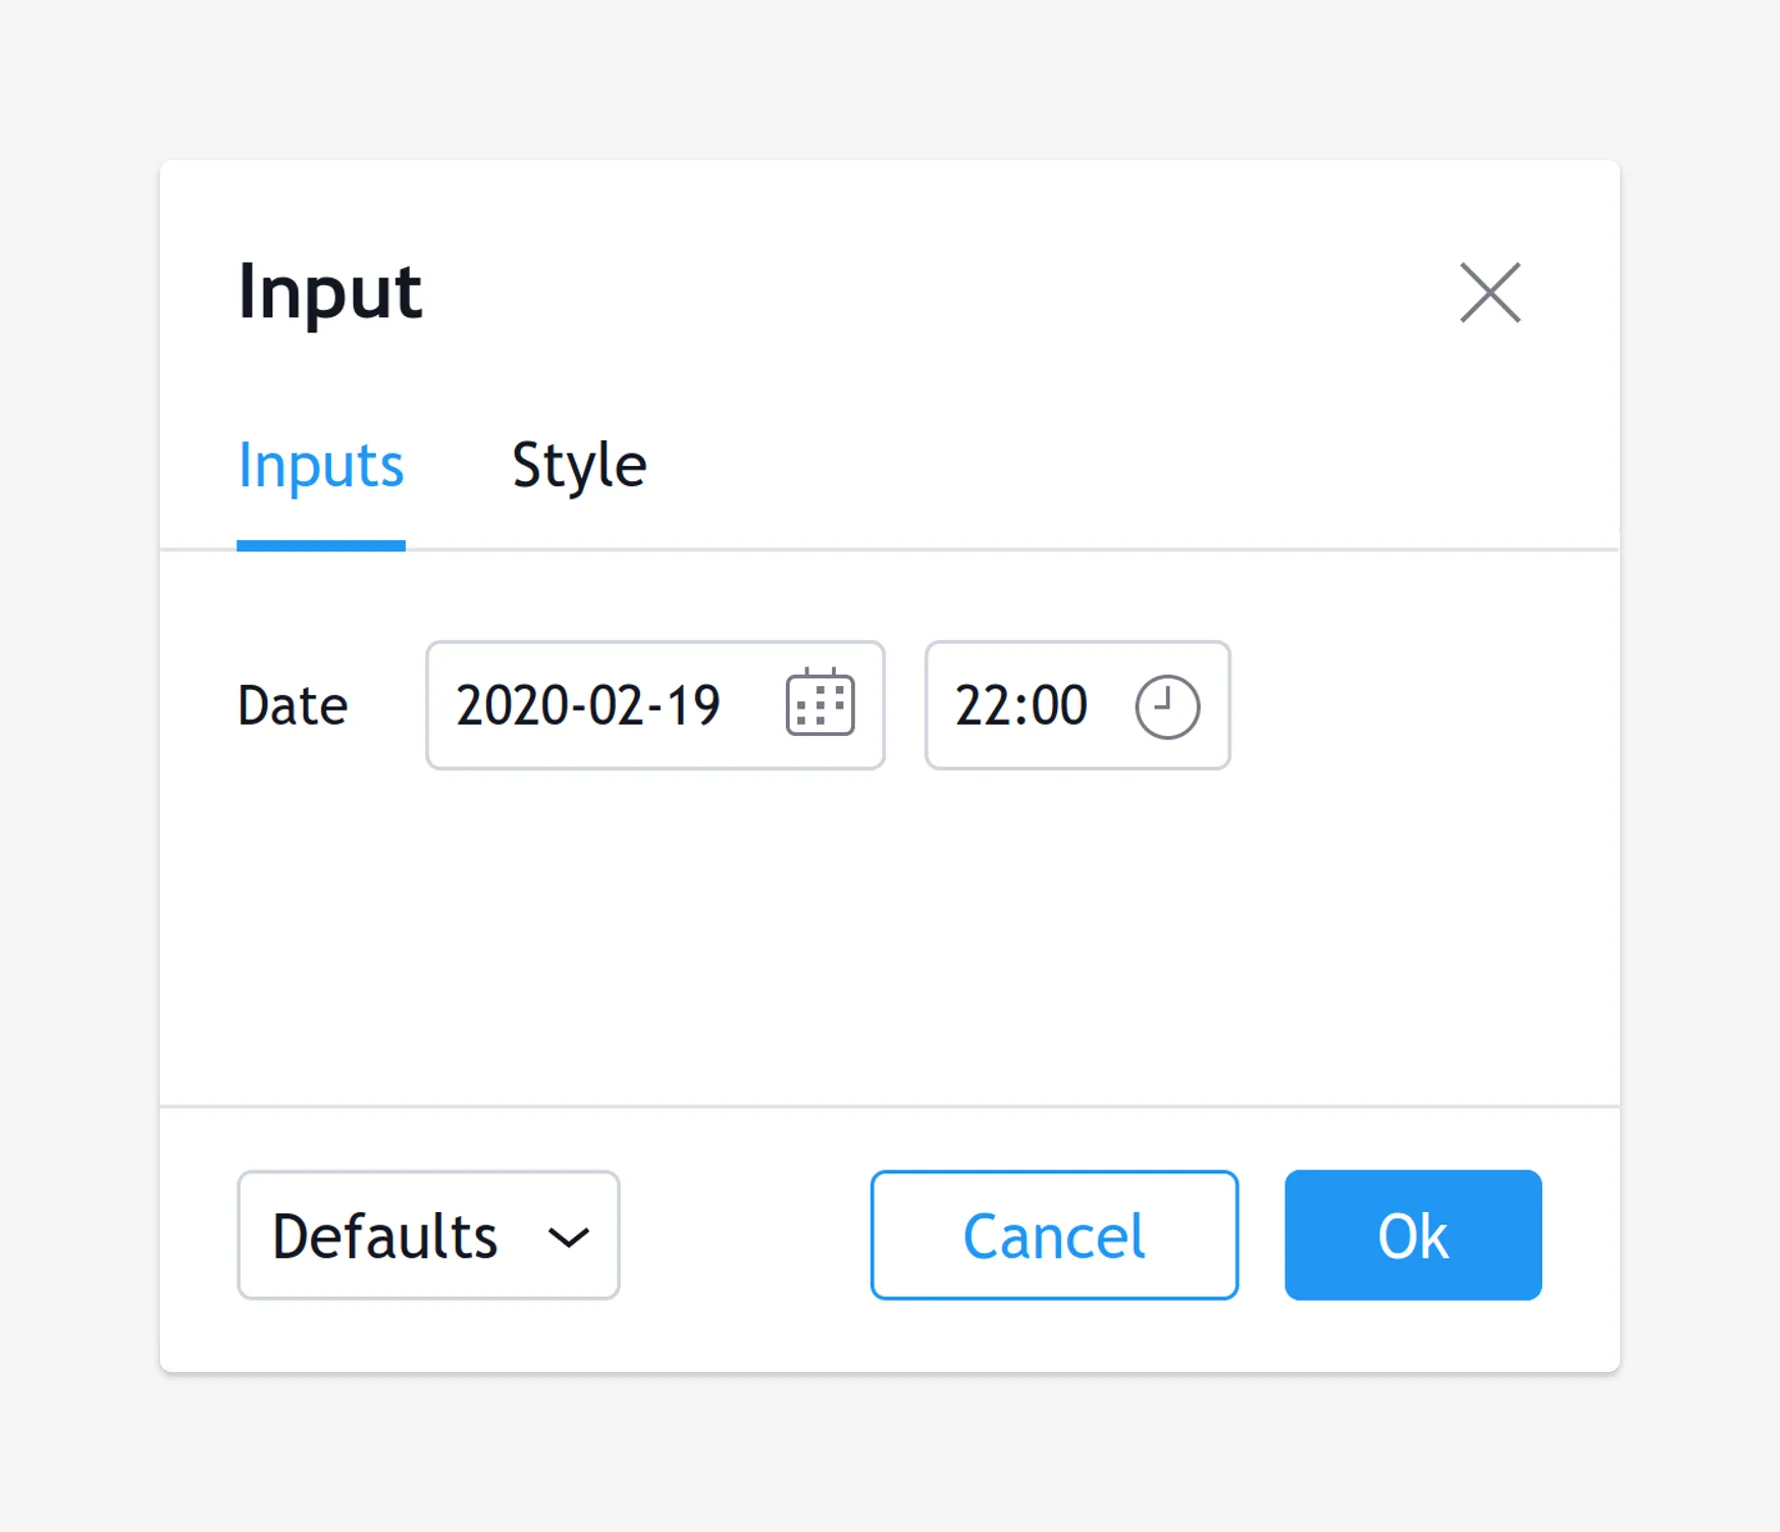
Time input
Options parameter
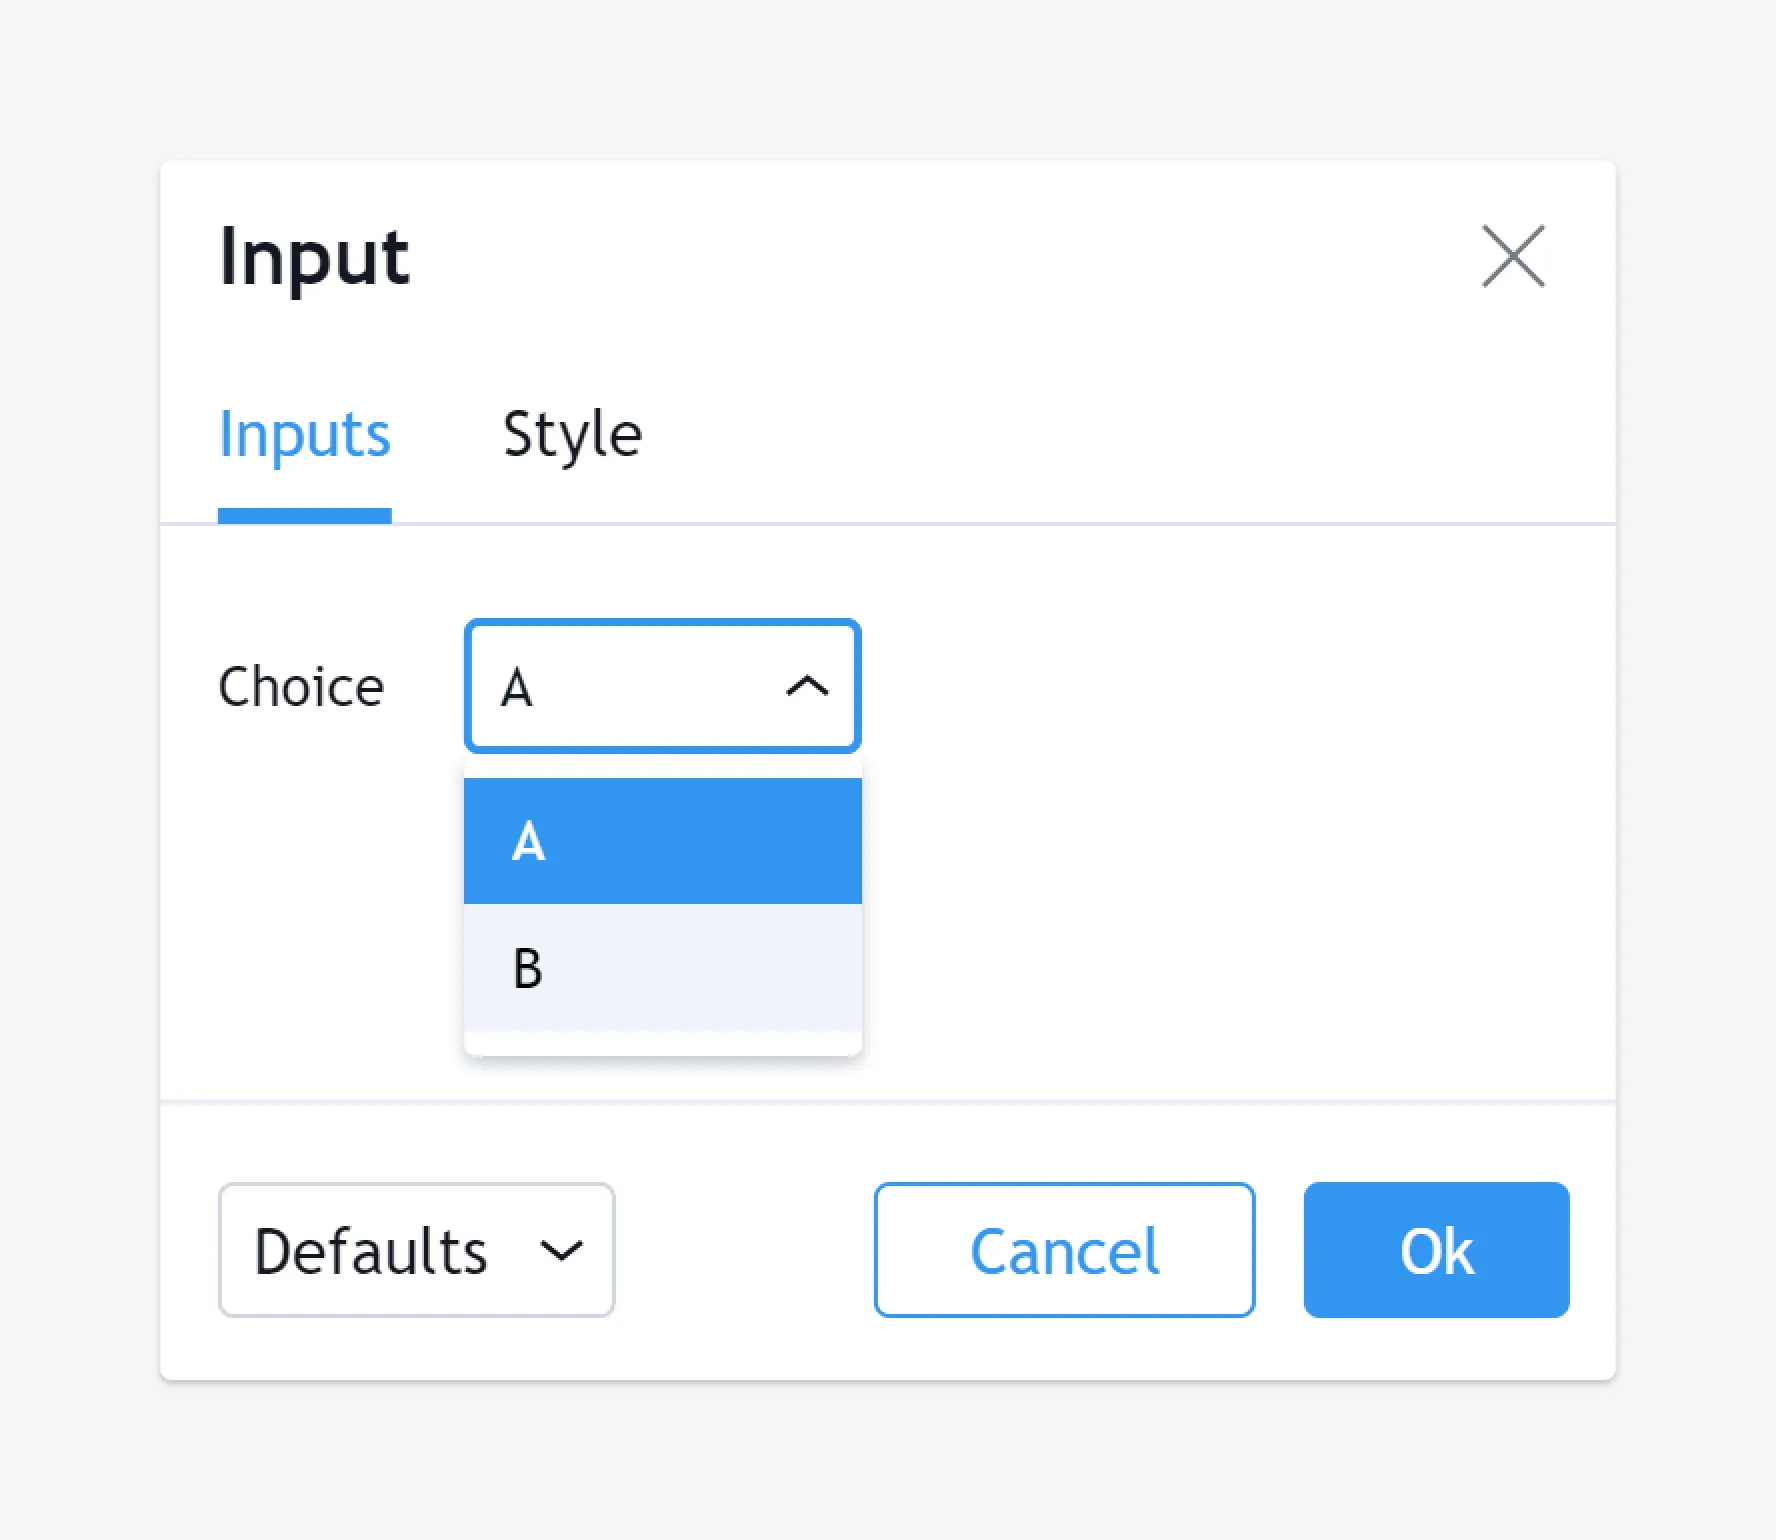
The options parameter is useful to provide users with a list of
constant values they can choose from using a dropdown menu.