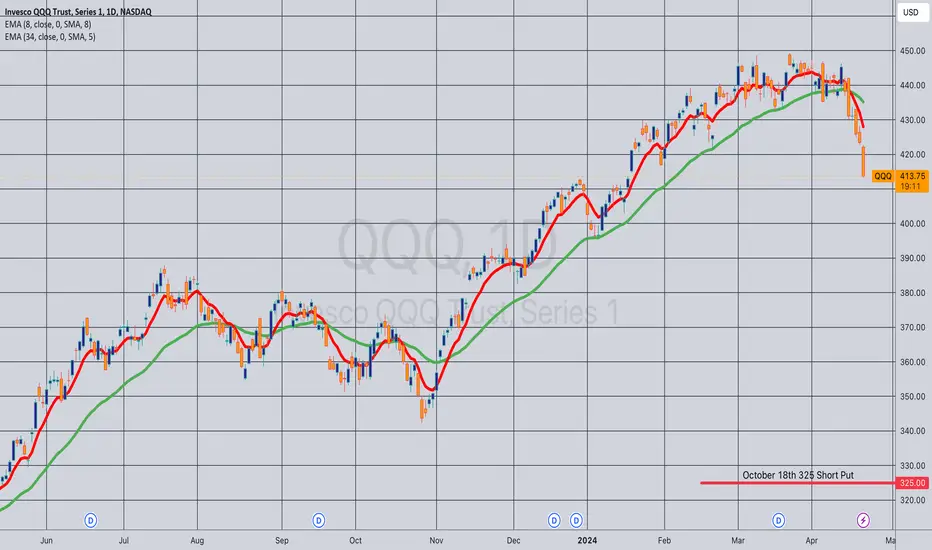
Opening (IRA): QQQ October 18th 325 Short Put... for a 3.52 credit.
Comments: Adding a rung out in Q4 here with QQQ IVR at 81.0, targeting the <16 delta strike paying around 1% of the strike price in credit.
Will generally look to manage shorter duration rungs as I come to them ... .
ETF market
GLD - Time to Take Some off the Table?While I'm still looking for higher prices, eventually, recent gains are too good to pass up. Line chart shows a three week testing of the high and at the moment, appears to be failing. Big move the past couple of days including this morning tried to push prices higher but this morning's big move was met with selling taking it off of overbought highs.
Looking for some pullback to test the 200 level.

GOLD MINERS GDX - 4 Years of pain?A inverse #HVF appears to be in progress on the #GDX
@TheCryptoSniper
Coincides with a probability that gold has put in a major secular top being pushed down by positive real rate environment.

5/10/24 - MEGA SHORT time sensitive - $jets $qqq $soxl $vixydo yourself a favor and look into this incoming CME from the sun.
youtu.be/9QCA3jouCKk - it's a short video WATCH IT NOW
6 or 7 earth bound flares that each have the capacity to f things up massively.
the reason this matters is it's a DOWN ONLY situation. the market doesn't know about this (clearly) so any non-event doesn't move the market "back up". many sources i look at suggest the deep negative event is 10%. could be higher for a disruptive event 20-30%.
EVEN IN a 10% disruption event, the market is looking very weak ON IT'S OWN and awaiting a pin. the flip flop from economic data is a DISTRACTION from something like this that trumps all...
jets - GROUNDED. FEAR. LEVERAGED. THEY GET DUMPED FIRST.
qqq - the richest valuations and the most affected by EMP style pain
soxl - the sector within the q's that is even more heady but doesn't have any 'pin' bc ai is strong narrative (i subscribe to this btw, but ST it's run hard)
vixy (go long not short like the above) - 0dte's have basically replaced the need to buy short term vol. HOWEVER the scenario where this gets disrupted is a CAN'T SEE THRU scenario - of which "this" is one of those
PLEASE post comments and let's discuss this. it's perhaps the most EV positive trade i've ever seen even if the scenario is a 10% one. i believe it's foolish not to participate in this and/or hedge responsibly. ignore this at your peril and flip the coins. but really - don't. let's help each other stay safe fam.

5/10/24 - MEGA SHORT time sensitive - $jets $qqq $soxl $vixydo yourself a favor and look into this incoming CME from the sun.
youtu.be - it's a short video WATCH IT NOW
6 or 7 earth bound flares that each have the capacity to f things up massively.
the reason this matters is it's a DOWN ONLY situation. the market doesn't know about this (clearly) so any non-event doesn't move the market "back up". many sources i look at suggest the deep negative event is 10%. could be higher for a disruptive event 20-30%.
EVEN IN a 10% disruption event, the market is looking very weak ON IT'S OWN and awaiting a pin. the flip flop from economic data is a DISTRACTION from something like this that trumps all...
jets - GROUNDED. FEAR. LEVERAGED. THEY GET DUMPED FIRST.
qqq - the richest valuations and the most affected by EMP style pain
soxl - the sector within the q's that is even more heady but doesn't have any 'pin' bc ai is strong narrative (i subscribe to this btw, but ST it's run hard)
vixy (go long not short like the above) - 0dte's have basically replaced the need to buy short term vol. HOWEVER the scenario where this gets disrupted is a CAN'T SEE THRU scenario - of which "this" is one of those
PLEASE post comments and let's discuss this. it's perhaps the most EV positive trade i've ever seen even if the scenario is a 10% one. i believe it's foolish not to participate in this and/or hedge responsibly. ignore this at your peril and flip the coins. but really - don't. let's help each other stay safe fam.

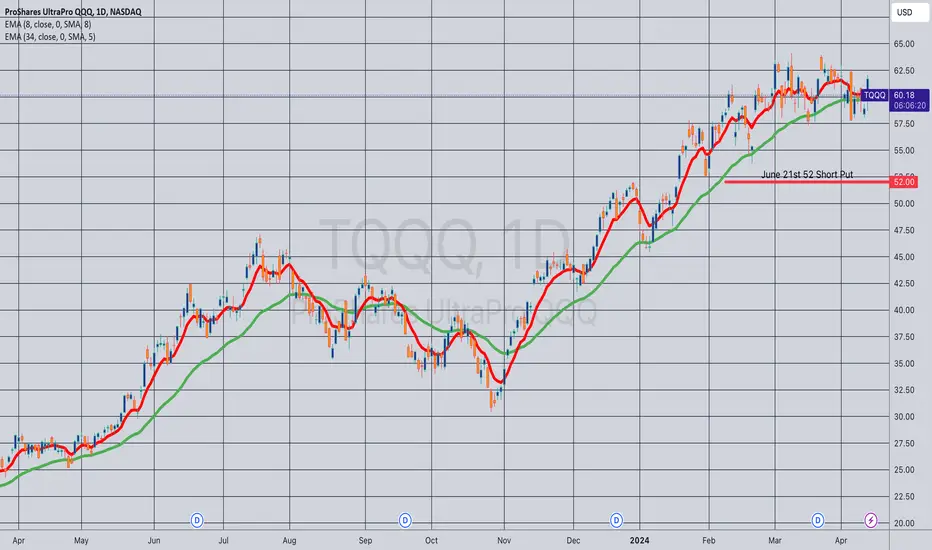
Opening (IRA): TQQQ June 21st 52 Short Put... for a 2.49 credit.
Comments: Adding to my TQQQ position on weakness ... . This is a bit longer-dated than I like to go with shorter duration premium selling, which I like to keep in that 45 DTE wheelhouse, but May has now only 35 days in it, and I like to stick to monthlies in all but the most options liquid underlyings.
Will generally look to take profit at 50% max. I'm fine with being assigned, then proceeding to sell call against if that occurs.
Metrics:
BPE/Break Even: 49.51
Max Profit: 2.49 ($249)
ROC at Max Profit: 5.03%
ROC at 50% Max: 2.51%
Delta/Theta: 24.36/3.37
Opened (IRA): TQQQ May 17th 55 Monied Covered CallBought a one lot of shares and sold an in-the-money -75 delta call to emulate a 25 delta short put to take advantage of call IV skew and to have built-in pro via the short call.
Metrics:
Break Even/Cost Basis in Shares: 52.71
Max Profit: 2.29 ($229)
ROC %-age at Max: 4.34%
ROC %-age at 50% Max: 2.17%
Will generally look to take profit at 50% max, add at intervals at a strike/cost basis better than what I currently have on should weakness present itself.

top of volume range band end of day?probably the influx of money into biotech this morning has a rippling effect all day on this etf as it retraces above its gap to sell off levels again.

TQQQ 6/26/2023Keeping it simple
TQQQ Multi-time frame analysis
Daily chart – Long term
Pretty clean straight forward chart. In this one we can see the different stages of the market.
After topping out in Aug. ’18, price entered a “sideways” market between Aug.’18 – May’20. The “sideways” market was deemed an Accumulation stage after price broke upwards and entered Uptrend.
In May’20, price entered its Uptrend after breaking out of an Accumulation stage. During this time, you can see price respect the 200ema the whole way.
The Uptrend ran between May ’20 thru Nov.’21. After topping out Nov.’21, price starts to move sideways until it breaks below 200ema Jan.’22. This breakdown deemed the “sideways” market as a Distribution stage and confirms the start of the Downtrend.
Price has been in a Downtrend since and continues to make lower highs and lower lows. Facts that can’t be argued.
The price slide continued until it reached the breakout point of May’20. At this level it found support and bounced breaking above the 200ema and breaking above resistance and previous lower high.
Does this mean the Downtrend is over? Absolutely not. Why? This is the 1st time the previous lower high has been tested.
I will now look at some indicators to provide further confirmation.
The Stochastic indicator - has been Overbought for a while and it’s coming down while being at a resistance level. Bearish.
The MACD indicator - is crossing below its signal while price is at a resistance level. Bearish
Price rejection/ false breakout – Price was above the previous lower high price(Resistance) but has now fallen below it. This is very bearish as price is rejecting higher prices.
So currently we have the following: Downtrend + Oversold stochastic + Macd under signal + Price rejection
This equals to a high probability short trade. I will zoom into 15min chart for entry.
15min chart – Short term
Here we can get a closer look at what’s going on short term.
Price has been on an Uptrend (respecting 200ema) since May 5, ’23 and topped out June 15th 2023.
Here we can see the “Price rejection” we saw on the Daily chart and its a Head and Shoulders reversal pattern in the 15min chart!
As you can see, the neckline has been broken to confirm the Head and Shoulders reversal pattern.
Entering trade short.
Entry: 37.30
Stop loss: 41.05, -10.05%
Target #1: 27.70, +25.75%, 2.56 RR ratio
Target #2: 17.67, +52.63%, 5.23 RR ratio

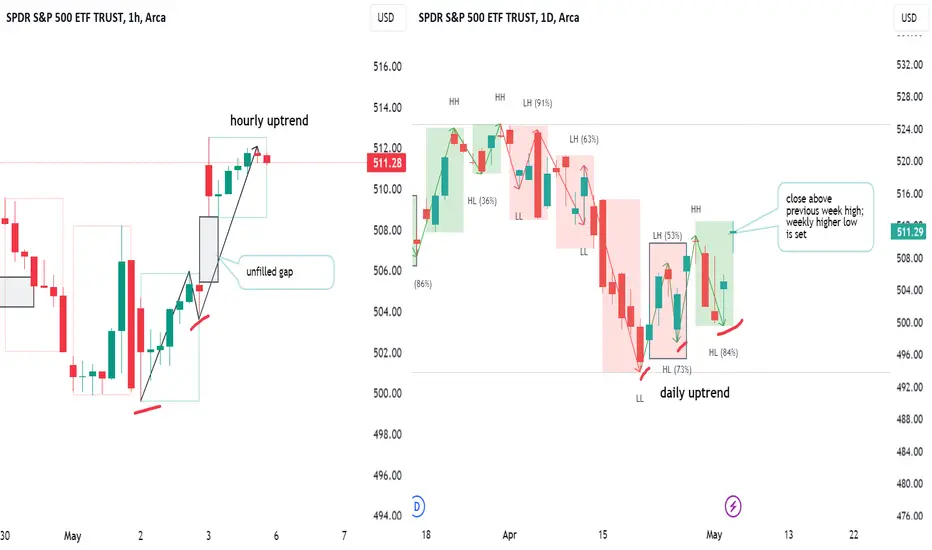
S&P Bulls prove their controlThe strong close last week indicates a shift in control to the buyers. They managed to close above the previous week’s high, establishing a weekly higher low and confirming the daily uptrend. Currently, the bulls have control across all key timeframes: the price is trending upward on the hourly, daily, weekly, and monthly charts. The only challenge they face is on the monthly timeframe, where bears have initiated consolidation; however, this is not a critical issue.
It's plausible that the bulls might either retrace the entire bearish wave or, more likely, close May as an inside bar, setting a price equilibrium that could persist throughout the summer. Given this scenario, the current position might not be ideal for a long entry since we are in the middle of April’s range. If you're considering buying, it would be wiser to wait for a pullback that could provide a more favorable opportunity.
Disclaimer
I don't give trading or investing advice, just sharing my thoughts.
golden oppertunity the price of gold rose even further after a report showed that more Americans than expected filed for unemployment benefits last week.

$SPY May 10, 2024AMEX:SPY May 10, 2024
15 Minutes.
Holding 516, (yesterday low was 516.70) 520 target was achieved.
At the moment i have 2 issues.
Positive is uptrend, above all moving averages, Stochastic black bar on top, did not become red on any pullbacks, Elloitt oscillator green and CCI green.
Negative is Elliott oscillator divergence (price making higher but not oscillator) and too far away from 200 moving averages.
My plan is:
Consider the last rise 518.34 to 520.2, holding 519 I have a target 523 - 524.
And if 518 is broken on downside I will short for a target 517 - 515 which is 38.2 retracement for the rise 508.56 to 520.2 and also 23.6% retracement for the rise 499.55 to 520.2 and 517 is 100 averages. 518 is important as breaking will nullify the HL HH pattern being formed now.
That retrace should allow the 200 averages to catch up at 514-515 levels allowing us to go long for the next uptrend above 524.
Since I trade on moving averages my bias is on reversal to 515-517 levels.

SPY: Week of April 15Last week I just did a longer timeframe update.
I am going to continue with the larger timeframe as the focus but will also give the shorter timeframe levels for next week.
You can see we've just chilled below the 3 month threshold for far too long. It's 504 on the horizon, that's for sure.
We will likely snag a bit lower, because I didn't realize there was this giant daily gap on SPY that stems down to 497 (its the purple box in the chart).
A gap fill doesn't require us to hit PL2 on the 3 month, but it does require us to hit PL1 on the 3 month, (504).
Some pretty bearish readings registered for next week, and likely going to kick off right off the bat into Monday based on the daily outlook assessment.
The weekly levels to watch are here:
Would be nice to just get to the point, get into that gap zone and then we head back to 532.
We'll see how eager it is to just get it done.
The selling is pretty controlled with too many eager and early bulls. This makes for PA that is dreadfully terrible with its slow pace and choppy grind down.
If we manage a gap fill it will just be back to straight up.
For next week, look for 504 and below.
Long zone is between 497 - 503.90.
If we can get some selling catalysts we can probably increase the velocity and just get it done early next week and reverse into mid to end of week.
Remember, probability is indicating a particularly bearish start to the week on Monday so just be careful you permabulls ;).
Those are my thoughts!
Safe trades!

watching for the breakbreak out imminent , all aboard choooooo chooooooo lithium is back baaaaaabaaaaaayyy

🚨$SPY May 10 500c 7.97 to 19.97 150%🚨 AMEX:SPY May 10 500c 7.97 to 19.97 150%
Over 1k made on this SIMPLE Options plays. When we take the 618 Fibonacci pullbacks and GAP FILLS we get Options for DEALS because we BUY CALLS when the Market is TANKING!

XLK Price Momentum DivergenceTech printed a triple divergence on a daily timeframe today between price and MACD, with a bearish engulfing candle close.
Even if today's high holds, we are likely to see a retrace higher of this downside move in the first half of next week.
Assuming the high holds, we are likely to see a pullback to the 50MA around ~ 200, or 3.5% lower than today close. A re-connect with the 200MA around 180 is not out of the question which would see price drop another 12-13%.
The recent examples of similar occurrences of price and momentum divergences are December (50MA test) and last July (200MA test).

$SPY -Uh oh Stinky Bears about to go to work on $SPY. Sold some ATM 519 calls for June 21 expiration, 43 DTE

POTENTIAL YIELDS CRASHING MAY LEAD TO A SUPER BULLISH GOLDThe inverse relationship between yield and gold over the long term gives us an idea of what phase and dynamics of the market we are in.
The bottoms of the yields are the tops in gold; interestingly the bottoms happen in 4-year cycles, especially in summer, July or June; while the tops are every 5 years in fall, September or October.
Based on these dynamics, a potential and highly probable correction in yield (by any factor) would lead to a historic run to the upside for gold....
Few...
----------------------------------------------------------------------------------------------------------------
La relación inversa entre rendimiento y oro a largo plazo nos da una idea de en que fase y dinámica del mercado estamos.
Los fondos de los rendimientos son las cimas en el oro; curiosamente los fondos suceden en ciclos de 4 años, especialmente en verano, julio o junio; mientras que las cimas son cada 5 años en otoño, septiembre u octubre.
Basado en esta dinámica, una potencial y altamente probable correción en el rendimiento (por cualquier factor) llevaría a una corrida al alza histórica para el oro...

SPY LongSPY has been ripping through all resistance levels since bottoming out in April. VX continues to decay. We're not getting much volume and conditions have been choppy, but if SPY can break yesterday's high and hold on a retest, we could see a rally back to $520.

SVR LongEntered here on this small pullback. Not my usual tactics, no point fighting the tide. Looks to have potential on weekly after breaking free from the sideways action. Left a large SL to allow a further pullback if I'm a little trigger happy.

SPY Analysis to todaySPY Analysis
====================
1. Price is showing Weakness as it is moving upward
2. Until it breaks 520.05, we expect a Range bound
3. Sideways possible between 512 and 520

Trading YINN? Two sides of a COINFrom China "uninvestable" to social media influencers calling bulls in the HK/China market and there are some followers getting edgy what they should do.
I know what I will do since I am clear with my objectives , time horizon, risk tolerance, capital management, etc.
For my existing holdings, I am selectively averaging down on some of these companies - Tencent, Alibaba, Meituan, Xiaomi,etc. One follower wants to know if he should trade YINN . Note that it is leverage by 3 times , ie if you win you triple your returns and also the losses. Most want to focus on the wins but may not be able to accept the losses when it happens!
Also, if the WINS come too easily, it is easy to get a bloated ego and one can starts to go "all in " in order to win BIG and fast. That itself is dangerous, leading into the path of gambling. For that, I wouldn't be touching this myself and am happy with the FXI ETF which has rally nearly 30% from the bottom.
Please DYODD

$SPY Analysis, Key Levels and Targets for Day TradersTomorrow's Trading Range (5.9.24) and all of the levels going through it.
