Weak Jobs Report -> Treasury RallyTLT long term bond ETF ripe for a swing trade to $92 coming off the
1. Hard landing concerns -> Treasury Bond Rally (TLT)
2. Faster Fed Rate cuts -> Treasury Bond Rally (TLT)
3. Inflation Dropping -> Treasury Bond Rally (TLT)
ETF market

CQQQ May 7th TTR UpdateTheTradersRoom is very long #CQQQ from much lower levels and looking to hold this one till at least we see 2-3x gains on it.
We have entered it first days of Feb and very happy with the result.
China is recovering and Im expecting a perfect inversion alignment to QQQ here into the end of the next year.
It was a clear breakout from the downtrend channel last week. If the broken channel gets tested from above, it will be a perfect opportunity to add into our long position.

$SPY May 7,2024AMEX:SPY May 7,2024
15 Minutes.
AMEX:SPY managed to stay above 510 levels.
Now we have 100 and 200 also near 510 levels.
Now holding 513 levels uptrend intact.
513 is the 61.8 % retracement for the fall 524.61 to 493.86.
510 is important because it is 38.2% retracement for the rise 599.55 to 516.61.
For the day holding 514 levels i have a target 518-519 levels. This is the number from April 11, we saw AMEX:SPY going all the way down 493 levels.
So, I expect some resistance around 519-520 levels.
I am going long around 515-515.6 levels for 519 SL 513 - 512.5.
The retracement to 515 - 515.6 is due to oscillator divergence in 15 minutes.
For two days we had a gap up we need to sort out the divergence.

CAN THE MARKET SURVIVE AN 80% CRASH, WHAT ABOUT ONLY 40%?So, for anyone who likes to watch certain movements.
A big one is about to occur.
A rejection from this break is the covid drop. about 30% and some.
However, the end of the cycle, if you believe in those kind of things, would be a 100% retrace of the impulse with a little extra on the downside, which closes all gaps, I believe.
That takes us down below 200.
It would have to be quick.
Next cycle then starts and pulls us up to $600.
I tried to mark it in orange.
This chart isn't an idea as in (I REALLY THINK WE'RE DROPPING 80% in less than 1 year).
This is more to show that trend break from the past and the trend break showing.
518 to 530. CAREFUL ZONE!!!
Market is showing a lot of crazy movements and numbers. I think something has to be "up" such as China and Taiwan considering what we're seeing with semiconductors.

Very nice set upHere's a set up that will be meaningful: NASDAQ:TLT breaking out through the downtrend AND weekly EMA30.
The area to watch in the green box 👁️✍️

Why Bear Shares are NOT InvestmentsPrice of SOXS since inception. Price in 2012 is not a typo.
Adjusted for reverse splits, shares declined from $11.1m to $3.
Eleven million, one-hundred thousand dollars became three dollars in twelve years.
Bear etf funds do not contain equities. They consist entirely of futures contracts, which suffer time decay and expire.
This is the effect of time decay on short sale of futures in a rising market.
Can you make money on SOXS? Sure, if you buy it the day before a crash. Good luck with that!
Other lousy ETFs include UVXY, SPXS, TZA, SDOW, SQQQ.
But Sawbucks, just last month you posted you were buying some of those?!
Yes, you buy them when market is extreme overbought condition and hold for no more than a week.
One day is often long enough.
These are NOT investments, they are purely speculative high-risk instruments. After just a week in these etfs you can notice the time decay, you will see index return to a price it held last week, but the bear fund will be a nickel or even a dime less than it was at the same price.
DO NOT HOLD LONG-TERM!!

Uranium Go Boom!Uranium looks ready to explode higher.
This commodity had a daily chart breakout today and no one is talking about it.
Silently triggering a bullish inverse head and shoulders, this should yield more upside.
I'm looking for this breakout move to be confirmed in the coming days. If it confirms a breakout this will be a likely trade that we can buy the dip on.

Opening (IRA): SPY September 20th 445 Short Put... for a 4.64 credit.
Comments: Targeting the <16 delta strike paying around 1% of the strike price in credit to emulate dollar cost averaging into the broad market.
Was starting to get somewhat worried that we would never have decent IV again. This ain't great, but I'll take it ... . Will generally look to take profit at 50% max.

Opening (IRA): SPY August 16th 460 Short Put... for a 4.95 credit.
Comments: A Q3 starter position ... . Targeting the shortest duration <16 delta strike paying around 1% of the strike price in credit to emulate dollar cost averaging into the broad market. July isn't paying, so going out to August.
Will look to add rungs in shorter duration, assuming I can get in at strikes better than what I've got on currently.

Opening (IRA): QQQ August 16th 380 Short Put... for a 4.00 credit.
Comments: Starting to round out my Q3 rungs here on weakness and higher IV, targeting the <16 delta strike paying around 1% of the strike price in credit to emulate dollar cost averaging into the broad market.

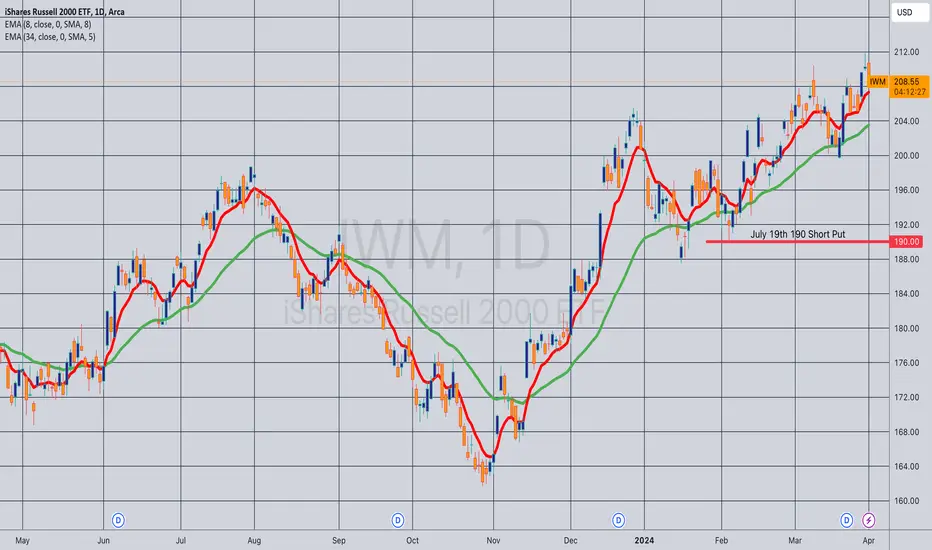
Opening (IRA): IWM July 19th 190 Short Put... for a 2.33 credit.
Comments: Targeting the shortest duration <16 delta strike paying around 1% of the strike price in credit to emulate dollar cost averaging into the broad market. (This is actually at the 18 delta, but it was either the 190 or the 185 where I wanted to pitch my tent from a delta standpoint).
Starting to slowly deploy third quarter rungs here in broad market (IWM, QQQ, SPY) while I piddle around with shorter duration higher IV sector ETF stuff.

China bottom vs USA | FXI vs SPXWe will continue to beat our fists on the table that Asia has bottomed vs US equities.
simple chart here. FXI (China large cap index) vs SP500
RSI popping out of oversold on the 2M with a nice bull div.
This is setting up for a multi year move. Likely at least the remainder of the decade.

$SPY Bear FlagCould be brutal if this breaks down. JPOW held the market, but not for long, hmmm. Rip or dip ASAP.

SPY TAHere is a chart of SPY with the support and resistance outlined based off volume.
TA can help you predict where price can go, and based off the current level its going sideways.
This coming week we have earnings and FED speak on Wednesday from Powell.
With inflation elevated and not appearing to decrease we can hear the same rhetoric from Papa Powell himself.
Will updated soon.


SPY short trade setupWe have reached the top of the formation on the chart and is the area I have been looking at for retrace, so added a bit of short puts for a possible swing short next week.

SPY 4hr updateWe broke through Zone 3 and the next wicked down to the previous supply zone (zone 3). I would consider this next candle as non confirmation to the upside due to the wick down. I would prefer to see a candle survive totally above the zone as confirmation. Full body with no wick would be A+. However a pull back is in store as we are over 70 on the rsi, but equally we are trading above the 13, 48, and 200 ema. Therefore my overall sentiment is bullish.

SPY Daily - Rising WedgeTreading lightly here as the SPY looks to be right at the end of a bearish rising wedge following a bearish ABCD Elliot Wave heading into a major week economically speaking. On Wednesday we have retail sales numbers, core CPI, and Core CPI YOY coming out, followed by jobless claims on Thursday. Will be watching closely, some support levels and RSI-based supply and demand zones to keep an eye on in the meantime, bearish and hedged- (Original Chart Attached Below)
- Rising Wedge following a bearish ABCD Elliot Wave
- Hidden Bearish Divergence on the RSI
- Sitting right on its 50-Day SMA
- Bearish ABCD Elliot Wave

SPY bearish outlookSPY (second red mark) looks like a repeat of the 1st one. Additionally the pitchfork lines also seem bearish.
Additional pitchfork lines also seem to confirm a bearish outlook:

UEC Uranium space is breaking out again. Amir keeps looking smarter and smarter all the time. Like ten fifteen years ahead of the pack. Boss Energy also looking nice. It’s at least competitive with UEC, but they move a little differently, so the pair reduce volatility.

HydrogenThis is mission accomplished to the downside for Hydrogen. Plug Power made a deep retrace. Not full retrace, but still very deep. Fcel just closed a gap in the volume profile down to $.87, and even lower. I’m in at 2.40. You just need to zoom out. Always zoom out to know what’s about to happen. A nasty reversal to the upside. You have been lulled to sleep by record low volatility in the hydrogen space, and low volatility begets high volatility, and all of the hydrogen space, etfs and stocks, is coming off a “higher low” in the largest timeframes. Do don’t see this, because most all of the etf originate at the most recent high, so all they have done is fall. Nobody knows what the etf will do once they see inflow.

Thrift Savings Plan (TSP) S-Fund $DWCPF $VXF next leg up?Broke through the 50 DMA, VWAP resistance and Volume shelf.
