$SLV Just getting started! Confirmed weekly breakout incoming. Silver has broken a major trendline on high volume and looks to go higher.
ETF market

Opening (IRA): GDX February 16th 29 Monied Covered Call... for a 28.24 debit.
Comments: GDX (IVR/IV 40.8/ 32.9) is at the top of my IV screener for ETF's (along with GDXJ, which has higher IV, but is less liquid).
Buying stock and selling the -71 delta call against, resulting in a max profit potential of .76 ($76)/contract; 2.69% ROC at max; 1.35% at 50% max. That .76 isn't massively compelling, but the ROC is "decent" for what I'm trying to do in the IRA on a month-month basis.

Opening (IRA): GDX August 16th 22 Monied Covered Call... for a 21.01 debit.
Comments: There isn't much that is weak in this market ... . Adding a rung to my GDX position out in August at a strike lower than what I currently have on. (See Posts Below).
.99 max on BPE of 21.01; 4.7% ROC at max; 2.4% at 50% max.

KREDespite the feds continuing to say they won’t be cutting rates much or anytime soon , which lower rates is better for the banks, and many other interest rate sensative stocks, the KRE in my veiw is gearing up for a big move up.
It’s slamming its head against the downtrendinf reistance.
It’s got a double bottom holding up and now consolidating in a pennant right above the W pattern. Bank earning are next week or so and this could be why it’s looking ready, otherwise it’s Becuase the fed might have other plans then they are feeding the markets and the charts are showing ahead of time !!

Opened (IRA): BITO May 17th 24 Short Put... for a 1.74 credit.
Comments: Adding a rung at strikes better than what I currently have on. Will generally look to take profit at 50% max or take assignment of shares should that occur and proceed to sell call against.
Metrics:
Buying Power Effect/Break Even/Cost Basis in Shares (If Assigned): 22.26
Max Profit: 1.74 ($174)
ROC %-age at Max: 7.82%
ROC %-age at 50% Max: 3.91%

Opened (IRA): SMH May 17th 198 Monied Covered Call... for a 192.24 debit.
Comments: Opened this in late Friday's session as it floated to the top of my IV screener with IVR/IV at 106/39.
Sold the -75 delta call against 100 delta of long stock, with a resulting cost basis of 192.24/share. This is to emulate a 25 delta short put and to take advantage of call side IV skew while having "built-in" position defense via the short call. Will look to add at intervals, assuming IVR/IV remains high, generally taking profit at 50% max and defending via roll out of the short call.
Metrics:
BPE/Break Even/Cost Basis in Shares: 192.24
Max Profit: 5.76 ($576)
ROC at Max: 3.00%
ROC at 50% Max: 1.50%
Variants:
Short Put:
May 19th 200 Short Put, 4.65 at the mid, 195.35 (cash secured), 25.70 (on margin). 2.38% ROC at max, 1.19% at 50% max for cash secured; 18.09% ROC at max, 9.05% at 50% max on margin (which is why you stick with the short put on margin; it's more BP efficient).
Synthetic Short Put:
May 19th 110/200 Short Put Vertical, 4.50 at the mid, 85.50 (cash secured), paying .15 to bring in BPE by more than half, 5.26 ROC at max, 2.63% at 50% max.
This would only make sense in a cash secured environment from a BP efficiency standpoint; the naked short put remains more BP efficient on margin than either the covered call or the "synthetic naked short put" spread.
Standard Short Put Vertical:
May 19th 190/200 Short Put Vertical, 2.03 at the mid on BPE of 7.97 (both cash secured and on margin), 25.57% ROC at Max; 12.74% ROC at 50% max.

SPY/GLD Long term trend of SPY vs GLD coming into a long term support trend line. Are we about to see GLD outperform SPY? It be a big deal well beyond ratio with risk model implications for all markets and assets.

BCHG Looks Good For A Run To $50 At LeastBCHG has broken through all the resistance levels. Next one is around $24.50 and if it can get through that then I see a straight shot to $43 and then $55. At those levels I would expect a decent pullback perhaps up to 50% before its attempt to break the high. BCHG is much further along than LTCN in its run. LTCN still has a long ways to go to reach the level that BCHG is at. So upside on BCHG is limited in the short term perhaps another 100% vs LTCN could do a 1000% move to reach the same level as BCHG as far as nav value to price. Keep an eye on news and developements surrounding the space and specifically securities and SEC stuff. The Proof Of Work coins are about to make a comeback. I think Litecoin will far outperform Bitcoin Cash but Bitcoin Cash will have a decent run as well. Good luck out there my friends. Ill update this chart throughout the cycle. Please like and follow me and this idea so you can be notified when i update it. Thank you and please know that none of this is financial advice its just my opinion and observations. Good luck my friends.

How I view the SPY over next whileThe top target looks more and more likely to me. However the tight range of the last 6 days has to break up or down decisively to motivate me to take any position in the indices.
I will be keeping an eye on larger time frames to see if they are giving me clues. Other than that real simple, doing nothing till the market does, maybe some tiny play positions.

GDX Gold minersGDX Gold miners are finally showing some short term momentum, still range bound, looks promising for a long term if convincingly break the range

TLT- Are rate cuts postponed? LONGTLT has been in a broadening wedge and formed a falling wedge within the larger pattern.
Price bounced off the lower supoort trendline in the mid-morning of trading then rising
to break out of the falling wedge. I see this as an opportunity to take a long trade in TLT
and close out a TBT position at the same time. This reversal may be due to the value of
existing bonds with the implications of a rate cut postponed beyond June. The faster RSI line
has recovered to cross the 50 level lending further support to this long trade.

2024 Q1 Short: QQQAh, the QQQ. Why's it up here? No one knows.
Looking at earnings : price ratio and adjusting for inflation, we are far overvalued. Sure, we can keep going, but odds say we need a pullback. Break 400, it could be decent. If we hold 400 and rebound to 408 surpassing that back into 410, be ready to close shorts dependent on your risk-tolerance.
MACD turning negative, RSI overbought and turning down hard.

Time to short (:It's been too long, go short, no pun intended.
Rates aren't coming down until something blows up & that may already be happening.

UVXY - VIX Futures ETF- rises from a falling wedge breakout LONGUVXY on the 30- minute chart is now in an establish falling wedge breakout. Increasing
volumes lend support for bullish momentum as does the fear that rate cuts may be postponed
the the market's bullrun may stall and correct. This chart is left clean with only trend lines
drawn in recognizing that quite a few traders only have a basic subscription on Tradingview
without the luxury of multiple indicators, alerts and so on. A rise in the VIX may be a signal to
start trimming long positions or hedging with short trades.

Top of channel POC magnet buyThese algorithms say this price action is a buy, and are indicating pressure towards the top of the daily trennd channel. this fund is oversold, and in pullback from a bullish overall trend where it has consolidated above fair valu gap and equillibrium.
AI is good at trading crypto, and if the computer is buying itself, then im buying the computer
AMEX:BITO
CME:BTC1!

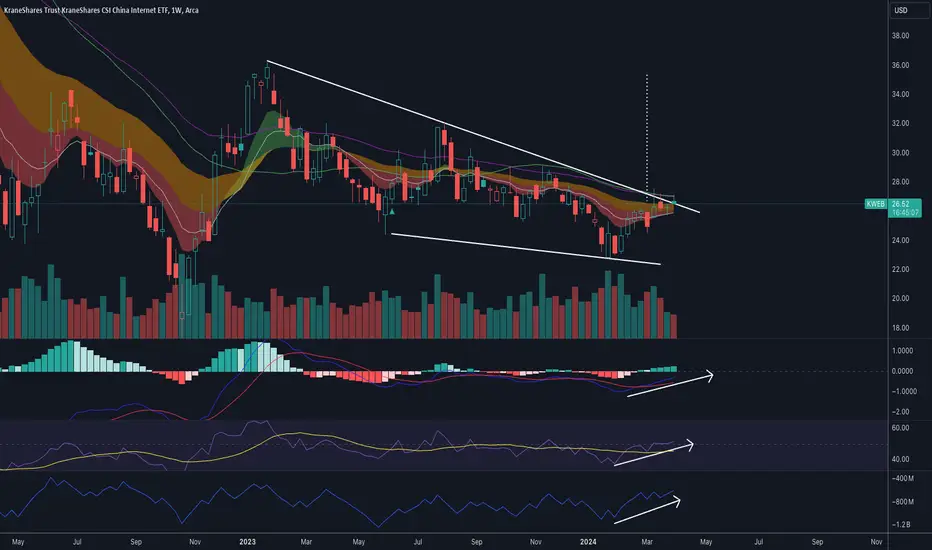
$KWEB - Close to breaking outAMEX:KWEB Kweb is on the verge of breaking out!
Targets:
$29
$31
$36
Risk:
$22
Pump Up the JamMonthly Chart of CBLS. Bullish! Little Island Reversal w./ a double bottom. Expecting to C higher monthly Close(s). Higher lows on each month.

$SPY April 5, 2024AMEX:SPY April 5, 2024.
15 Minutes.
Stop loss hit.
But the target was achieved as expected.
One of the days where we tend to blame.
Cheated.
Gapped at open. Closed trade and computer. Knew it was not my day.
No trade today also.
The chart is corrupted.
We have 508 as 50 average in daily.
Possible target?
Have to see.

SEMI should be bouncing soon.As shown in the chart.
SOXL is still a higher low along on the trendline, seeking a bounce tomorrow.
I would take loss if SOXL dropped below 38.95. Otherwise, it should be ABC wave up to 53.

TMF long trade setup 3X Bullish TreasuriesTMF on the 4H chart is set up at the bottom descending support trendline of a symmetrical
triangle in the approach to the apex. Price appears ready to reach for the upper descending
resistance trend line and the Echo Indicator ( Lux Algo ) makes that forecast. Current
ambiguities in a rate cut soon upcoming will make values of Treasuries a complicated matter.
I am taking a long trade targeting 54 with a stop loss at 50 in consideration of the triangle
pattern. I have existing positions in TLT.

JETS:NYSE is testing the resistance and is ready to RISE JETS has broken out of the resistance and is testing the breakout and is likely to rise and start a new trend up

✅SPY BEARISH BREAKOUT|SHORT🔥
✅SPY was trading in a
Strong uptrend in a
Rising wedge pattern
But now we are seeing a
Bearish breakout and the
Breakout is confirmed so
We are bearish biased now
And we will be expecting
A further move down
SHORT🔥
✅Like and subscribe to never miss a new idea!✅

S&P still very strong; rally goes onLast week began with bearish consolidation, which was short-lived. The bulls quickly regained control, established a daily higher low, and broke through the previous week's resistance at 524.1 . Although the breakout was not very strong, it was still meaningful. The March close was very strong, posting a +3% gain, and both weekly and daily charts are indicating an uptrend. All major sectors appear strong. The bulls have full control, and the rally is likely to continue.
This week is heavily loaded with economic data releases, which might cause some volatility. However, unless there are major surprises, it should not affect our main thesis.
Important level to watch is 518.4 . As long as it holds, buyers are in control
Disclaimer
I don't give trading or investing advice, just sharing my thoughts.
