QQQ Scalping Zones 4/26Scalping zones worked pretty will this morning.
Upside Targets:
*
Downside Targets:
*
Daily Trend Tracker
*DXY - Bullish - *VIX - Bearish - *US10Y - Bullish
ETF market

Market Direction using SPY historical trend patternsFrom a technical perspective, there hasn't been a definitive signal indicating a trend reversal for the SPY 500. Back in May to October 2023, the SPY exhibited a clear "M" pattern or double top, experiencing a drop of approximately 5%, retracing back, and then dropping around 10%, forming the M pattern.
If we compare this M pattern with the current price action, we observe a striking resemblance in the market behavior, as the price retraces from a similar percentage drop of around 5%. The question arises: Is the market genuinely recovering, or are we merely witnessing the formation of another M-shaped pattern!


Largest Purchases of VIXM Ever since conceptionThe white box I inserted is where a 41 million dollar purchase was made at the price of $16.20 BUT, a second large purchase was made of 8.3 million dollars at the price of $16.00.
After these purchases, the price was able to stay above the purchase price and this is a bullish sign on medium term volatility.
Circled in the volume candles is the exact trades that I mentioned and I will be watching very closely on how this move prior to and at FOMC.
Its pretty obvious the NVIDIA event will be bullish for the markets until FOMC.
Little pop..... and a DROP.

GLD - SHORT POOTSGold prices have been on the decline recently, influenced by several key factors:
1. **Correction from Highs**: Gold had reached a record high last week, trading at $2,413.80 per ounce. Such spikes are often followed by corrections, as seen with the current downward movement.
2. *Rising Dollar and Treasury Yields**: The U.S. dollar and Treasury yields have both increased, which typically makes gold less attractive. As the dollar strengthens, gold, which is priced in dollars, becomes more expensive for investors using other currencies, reducing demand. Higher Treasury yields also make gold less appealing since it does not offer interest or dividends, unlike bonds.
3. **Economic Data Influencing Fed Policy Expectations**: Recent U.S. economic data indicated a 1.6% growth in GDP for the first quarter, which was below expectations. This situation affects market predictions regarding the Federal Reserve's interest rate decisions. Initially, weaker GDP growth might suggest potential rate cuts, which would typically support gold prices as a safe haven and hedge against currency devaluation. However, the current market sentiment suggests that investors are possibly adjusting their expectations about the extent and timing of such cuts.
4. **Geopolitical Tensions**: The easing of tensions between Israel and Iran has also played a role. With fewer concerns about a potential wider conflict in the Middle East, the demand for gold as a safe haven asset has diminished.
5. **Technical Support Levels**: Despite the recent drops, gold prices are still holding above the $2300 mark. Analysts from Saxo Bank noted that there is key support around the $2250-$2260 area, indicating that prices might stabilize if they reach these levels.
Can see easily a demand area at 202 area, longer term.
Puts bought on todays micro double top. good luck!

LONG SDS target 30In my opinion with no cut rates for 2024, stock markets should drop 10-15% from current levels. So the best play will be long SDS.
Regards,

Opening (IRA): SMH July 19th 165 Short Put... for a 1.69 credit.
Comments: High IVR/IV at 78.9/34.5. Adding a rung out in July to my SMH position, targeting the <16 delta strike paying around 1% of the strike price in credit to emulate dollar cost averaging into the semiconductor ETF.
Generally, will look to take profit on the short put at 50% max.

SPY THIS WEEKWe should stay in 502-508 range today, consolidate.
First move in the morning could be down.
508 is a strong resistance.
I am wondering if we do another leg down or do V.
Usually ACB should have another leg, but the move yesterday was strong, so I am 50/50
sitting on the fence.

$SPY should be a big dumpBollinger Bands and Stochastic are suggesting that downward movement in AMEX:SPY

Where will QQQ go from here?Slight correction is expected but long term trend line remains with target price of USD520 by 2025

$SPY April 26, 2024AMEX:SPY April 26, 2024
15 Minutes.
The expected long was nullified by gap down.
But AMEX:SPY managed to close near 502 levels.
Now we have all moving averages consolidated together.
I have Elliott oscillator green, CCI green and stochastics above 75 with no black bar on top.
Now for the rise from 493.86 to 507.37 AMEX:SPY retraced more than 61.8%.
Also, we have multiple resistance around 506 levels in chart as it can be seen.
For the fall from 515.30 to 493.86 we have 61.8% retracement around 507 levels.
I expect AMEX:SPY to be in the range 507 to 510 on upside today, provided it holds 502 levels.
If that happens then we can assume AMEX:SPY managed to hold 100 days in daily and 21 in weekly, there by setting up a buy above 515 levels for next week.
I will go long only above 514 - 515 levels.
For the day as moving averages have converged, if AMEX:SPY opened gap up I will wait for first 15 minutes, and if close of bar is near low I will short for 503-504 as targets provided the gap open is around 507 to 510 levels with SL high of bar or 511.
The reason is for the fall 524 to 493, 512 is approximately 61.8% of retracement for the fall.
Hence I have a buy only above 514 levels.

QQQ rangbound bearish bias SHORTQQQ on the daily chart hit a hpivot high on 3/21 followed by a slight downtrend of 1-1.5 %
overall this past week. Buying volumes are low. The Price Momentum Oscillator has
reversed to bearish and the Raltive Trend Index has entered the chop zone and is heading
bearish. Price is presently one standard deviation above the intermediate-term anchored
VWAP. Reversion to the mean suggests another 1% move downside before VWAP support
exerts itself. Price is compressing in a symmetrical triangle. Accordingly, I am expecting
a move down before a potential reversal in a VWAP bounce from that support.

Utilities setting up?The daily chart on XLU provides rationale to keep a place on our watchlist. Recently it made a golden cross and seems to have broken free of a downdraft in price. Now it looks like the RSI could be searching for overbought.
One option is a momentum trade targeting the $71+ price. Personally I'd like to see it hit overbought, then that a position of it pulls back down around the 50 & 200 day MSAs. Looks like with some patience there could be 15% out there depending on how things develop.

Dead cat bounce....?I see the bulls in the market attempting to cause us bears to panic. I believe this will be a short term "rally" that will only be the continuation of the downside trend.

QQQ Dancing on a High Wire $422.93: Golden Genesis fib and top?=QQQ is dancing on a high wire, a Golden Genesis fib at $422.93
Failure here could indicate top is in, so this is a key level here.
Just below is a fib confluence at $418, last stop before SERIOUS dip.
It is PROBABLE that we orbit this fib for a while.
It is POSSIBLE to bounce here and keep going up.
It is PLAUSIBLE a bull trap / distribution is done.
Here is a snapshot of the Genesis Sequence for the Q's:
=================================================================================================

$SPY 4hr double bottom could push it to trend/monthly resistancePossible double bottom here. Watching for a continued push to the trend line and major monthly resistance.

Possible H&S on 15minI am out for now. if we reach 502.50 SPY may be making right shoulder.
However, There is that massive gap that needs to be filled so it may be just a quick scalp.

BITO @ $39 Jun '24I feel increasingly isolated among the growing crowd of bears but I believe BITO has formed a textbook flag pattern. My argument:
Following a sharp move upward, beginning 3/14 (6 weeks from the time this was published), price has declined in 3 drives forming a clear channel but didn't break the 50% retracement level while volume has steadily declined during the formation of the flag. If I'm correct, a movement similar to the one that makes the flagpole would put the price right at the .382 level which I believe further supports my argument.
Full disclosure: this is all based strictly on technical analysis and I have limited experience in dealing with crypto or it's derivatives so there could be something I'm missing. It's entirely plausible that I'm completely wrong but I'd appreciate any feedback from the community

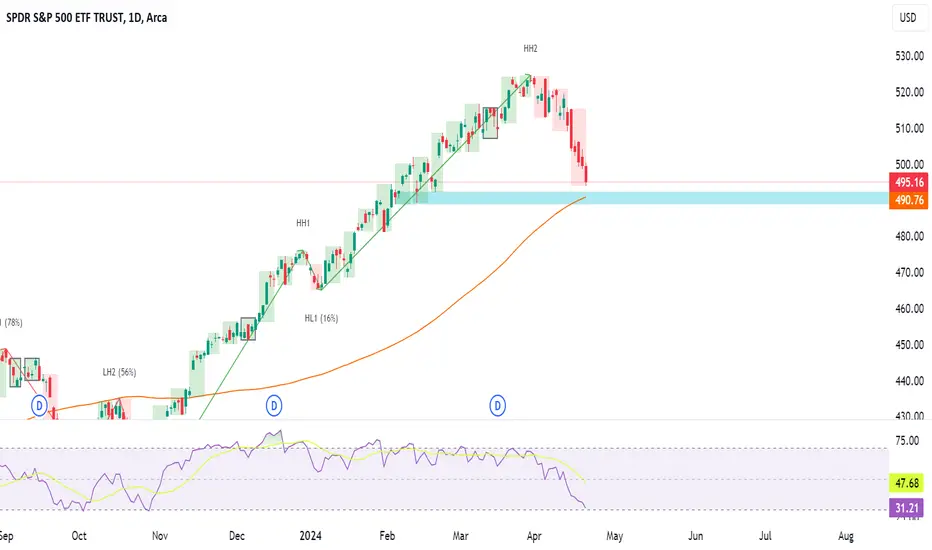
S&P Bears are strong but Bulls still have a chanceLast week, sellers firmly controlled the market. Buyers attempted to defend March's low, but the bears left them no chance. Prices consistently declined for six consecutive days, with the futures chart ( CME_MINI:ES1! ) appearing even more bearish.
We are now approaching a critical juncture, which presents a significant opportunity for buyers to take a stand. The daily RSI is nearing an oversold condition, and simultaneously, the price is approaching the SMA100 alongside a horizontal support level ( 490 ) from the February consolidation.
There is no absolute certainty that buyers will seize this opportunity, but we should closely monitor the price action next week. Although sellers have demonstrated their strength, we are still in a weekly uptrend, and trends do not end easily unless there is a radical shift in sentiment. Despite negative news in recent weeks, nothing has emerged as critically detrimental yet. However, this could change, so we must regularly reassess the situation as new information becomes available.
The short-term outlook remains bearish, but this could change depending on how the price reacts to these support levels.
Disclaimer
I don't give trading or investing advice, just sharing my thoughts.
Spy Short - 50sma Stop loss50sma - strong support / resi
Below - market is bearish
Above - market is bullish

QQQ - Bull, < 1WInstrument: QQQ
Direction: Long
Time Frame: 1W
Upper Target: 100DSMA
Lower Stop: ~413 (New Rel Low)
Reference Weekly Monday Journal for basis.

Looking for 515 if money flow breaks outPrice action needs to breakout of the descending wedge/triangle. If AD and money flow continues to rise and breakout of resistances spy can head to 515 level

Ibit bullish supply zoneI think here ibit its very bullish from here but also its too much risky anyway this with Hong Kong etf maybe can force the market price to go up
