SOXX $178, Plunge
By the technical analysis,
SOXX plunge into $178.
AI semiconductor may be risky.
NVDA may plunge to $565 till june.
ETF market

$SPY April 21, 2024AMEX:SPY April 21, 2024
15 Minutes.
As expected the downtrend continues.
Two issues.
It is coming to the lower parallel channel in the move.
And oscillator divergence.
I expect a retrace to 498-500 levels.
As I believe once 492-490 levels broke I will have a target of 495 which is 32% retracement for the larger move 409 to 524.
409 I have taken because for the trend change for this uptrend happened from the 348 low.
And in that move for the rise 348 to 459 AMEX:SPY retraced to 409 levels. From that low it went to 524 levels.
Hence I consider the large move from 409 to 524, 480 as a number to watch.

SPY Weekly/Monthly UpdateRecap:
SPY is currently in a corrective wave using price action on the higher timeframe. Corrective waves are completed after 3 legs (A, B, and C) … Each wave has 5, 3, and 5 legs per wave respectively. A (5 legs), B (3 legs), and C (3 legs). There are other specifics but I will not go into detail.
For now we are operating within wave A, soon to be wave B which is a correction within a corrective wave. lol once I will not go into.
The key price points throughout the entire correction are 492.69, 480.22, 466.84, and 453.45. The golden zone is between 453.45 and 466.84. Anything below that ....... yikes
The previous week on SPY closed near the first key price point (492.69). Price is also sitting at oversold levels in confluence with lots of demand. This week also signaled a break below the previous month’s low, a first since Sep 2023.
Trade Idea 1:
As long as price doesn’t capitulate to the downside, going into next week I expect price to begin setting up to make a push higher from this demand area with a target to the previous month’s low week. I am also watching for some form of price consolidation between 493.55 and 506.53 until price convincingly breaks either level, preferably 493.55.
In addition to looking to trade the retracement move to the upside, I would like for price to push below 493.55 briefly then reclaim the level the breaking above the lower time frame downtrend before playing the move upward.
Trade Idea 2:
If price does maintain the current downtrend and continue down I will look for a sell entry below 493.55 and 490 to target the next major level below.

QQQ expect short term bounceLooking at the last Sept correction, all of the three legs has a drawdown of around 8%. First wave took 23 bars. Currently, we've are 20 bars into the first down leg with a drawdown of 8%.
QQQ at 413 is the VWAP from the Oct, 2023 low and the top of the Jan base. It was almost touched on Friday.
If we get one more down day, it's likely a good buying opportunity in the short term

XLE could be inverted Cup-Handle - Possible trapTemporary breakout may turn into inverted cup so careful.
Wait for clear breakouts, will keep you posted.
Possible temporary small break at 95.60
Possible consolidation at 97

Daily Consolidation Potential Reboundsince the weekly reversal in favor of bears for AMEX:MJ etf and cannabis stocks, the daily bounce has turned back downward, and is approaching recent multi week lows.
this set of oscilatiry trend regularity indicators show when there is potential for retracement in the opposite direction should these levels hold.

GOLD : From SHIMMER to SHIVER- Gold Prices Set to Slide !GOLD has completed it's upward move. Though Analysts say that it will go up further. It's time to be contrarian as Analysts also manipulate the market for their HNI clients. here might be a small move up but more explosive move is going to be downwards.

Spy possible move on monday.Like shown on the chart. Spy can continue downtrend in 4 ways. Since rsi is oversold. Just be patient and wait for price action on each level. Whenever spy reaches those level on higher timeframe switch to 5 mins timeframe and wait for price to atleast break nearest demand zone for downtrend continuation.

SPY: Free Trading Signal
SPY
- Classic bullish formation
- Our team expects pullback
SUGGESTED TRADE:
Swing Trade
Long SPY
Entry - 495.10
Sl - 489.28
Tp - 504.96
Our Risk - 1%
Start protection of your profits from lower levels
❤️ Please, support our work with like & comment! ❤️

SPY=>Anyone buying the dip? 😆The bloodbath has started 🧛🩸
The bears are in full control and the buy the dippers crowd is getting hurt.
Are the last remaining bulls waiting for the next rally to sell?
Are you buying the dip?
Or are you selling the rally?

ITBEESSince a long time in the past, the IT sector has experienced extreme market volatility and pressure. even if one of the most favored industries is IT.
Thus, because of this unstable market, "ITBEES" appears to be the greatest investment in the IT sector. I've seen that there has been a 16–17% correction to this volatility.
That one, I think, if you investigate here at CMP 35 Rs. It might yield a 17–18% return for us in the upcoming days.
Before considering an investment, please consult your advisor (HOLD as POSITIONAL). I'm not a certified advisor.
Please don't take anything personally; it's only meant to be informative.

spy
My Nasdaq 3M view #spy #stockmarkets #StockMarket #stockMarket #trade #trader #technicalanalysis AMEX:SPY NYSE:ES #es1


SPY Week-Ending April 19The gap zone from the Island Pattern earlier this year seems interesting because 510-505 are less thoroughly traded so far this year and will likely be the area we return to when this pullback is done. Bearish price action is all but confirmed, but can we expect an elevator down first thing on Monday?

$QQQ - $343 Price TargetQQQ is in overbought territory in almost all metrics, selling has started which would cool down the index in order to move higher, looking for gap to be filled and a price target of $343

S&P weekly consolidation in progressAt the end of last week, sellers confirmed weekly consolidation by closing below the previous week's low. From now on, bears have control over the price on the weekly timeframe. We should monitor the progression of weekly lows and highs to see when things start to shift, but until then, we should trust the sellers.
It is also notable that if we look at the futures chart ( CME_MINI:ES1! ), we can see that buyers were unable to close above the previous day's high for the last 10 trading days. If buyers want to regain control, this will be their first objective.
Please note that the price is currently positioned near the previous month's low, which can provide an intermediate support level. If you’re planning to short the market, it is better to wait for a pullback or for a breakout with retest.
Finally, if weekly consolidation will convert into monthly consolidation it will be a major win for bears.
Disclaimer
I don't give trading or investing advice, just sharing my thoughts.

$IWM - Can we see a relieve bounce soon?AMEX:IWM hits the first support area of $192. It is the October 2023 pivot VWAP (Volume Weighted Average Price), which has provided support before. 👀 The RSI (Relative Strength Index) is close to oversold, so we could see a bounce soon.

QQQ | SHORTNASDAQ:QQQ
Possible Scenario: SHORT
Evidence: Double Top Price Action
Entry: 433
Target: 422
SL: 436

spy short its time 3-8% correctionNew thread
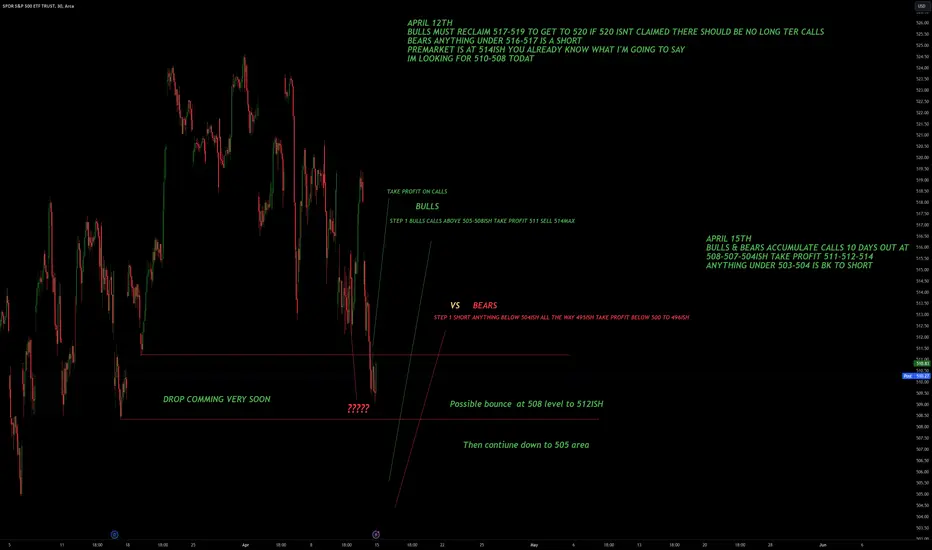
April
510-505
I would personally buy calls all the way down to 505
10 days out for a bounce 514
Taking profit 512-514
Then I would get bk into shorts all the way down 505 or lower as low as 495 this upcoming week
weekly range keeping us in a corrective phase no higher 516
as low as 495
WILL UPDATE SUNDAY NIGHT
SPY | SHORTAMEX:SPY
Possible Scenario: SHORT
Evidence: Price Action, Macro Economy
TP1: 497$
It has fallen below the 50-day moving average (MA); the next support is at the 100-day MA at 490, and there is a gap at $497 that will likely be filled on the way down

EWJ - LONG to $80-$87USDJPY goes down - Japanese stocks go up
The annual inflation rate in Japan rose to 3.5% in April 2023. From 2015 it was near 0-1%.
Companies have a lot of cash, do huge buybacks.

Simple chart analysis for SPYActually, it was difficult to get the gasp of using Elliot Wave on this kind of chart because it didn't work like usually do
On H4 t.f., three Elliot Wave finished. ABC correction finish. A to B of second ABC is in process.
I use fibonnacci from peak 2 to peak 0 and start with the level 0.50% to have a better idea of where the fifth peak will be. It should reach 300% of fibo. .
The percent and 100% fibo. it's to know strong zones for retracement.
Note: It is a risky trade cause I'm not very familiar with this kind of chart with so many gaps, but I have analize it the best I believe.

TURNING POINT FOR $SPY??Today looks to be a fight to stay above $500 for $SPY. Starting to see some consolidation in these areas. If AMEX:SPY can avoid a pit fall for the rest of the day, Calls will be on the menu. Nice simple and quick play. RSI already at 30.
