IWM/SPY, high probability resistance, 26.decIn 26th dec, there was a high probability weakness in IWM based on this graph.
Top of BB's and impulse has no potential, yet important resistance/break out.
//rising TNX is bad for cyclicals or small caps.
ETF market

BOIL trends up continuation expected LONGBOIL is here on a 30 minute chart. It has reversed this week and ascended 13% with a double
bottom at 13 and 13.25 forming a resing support trendline. Volumes changed from selling
to buying. Price bounced off the ATR- stop loss in its pullback and now appears poised to
break through the moving average channel and get support after that cross-over.
I will take a long trade here with a stop loss of the pivot low of 14 while targeting the
upper boundary of the Keltner channel at 15.25 for two-thirds the position with the remainder
to run to try to reach 37 , the pivot high of January. As a leveraged instrument, BOIL is very
volatile and needs extra care in the trade.

1995 Thesis Being TestedIn my previous idea and in many of my comments here on TV I have noted how similar today's market is to the 1995 market specifically. Today's three-day candle close matches one similar event in 1995 right at the end of the year, as compared in the idea. This was the only time 3 consecutive three-day candles printed in 1995 & the next close will be critical to determine if this comparison is still valid.
Please see the ideas I've linked for two other direct comparisons between this market and 1995 (& late 1994 in one of the ideas). The comments in Steversteves idea include a mathematical comparison between 1995 & 2024 using ATR and average daily change that will likely be invalidated if we see more downside right away.

$SPY April 13, 2024AMEX:SPY April 13, 2024
15 Minutes.
AMEX:SPY took 50 average support in the daily.
Now 505-510 levels become important to hold.
The uptrend is from 493 levels in 15 minutes.
Made a high of524 levels.
so 61.8% retracement for that move is around 505 levels.
If that level is not held next week I find it difficult to go long.
Any rise up to 516 levels I will sell as I have a target 505 levels SL 518.
The long is only above 524 levels as of now.
Downtrend now bias at the moment.

The Candle That Started The Bull MarketToday the SPDR S&P 500 ETF made a rare marubozu candle - that is a candle with no bottom and no top. It is not said to have any predictive power, but to only exist when buyers (or sellers) have high confidence. The current bull market has historical parallels that suggest it may be here to stay. In 1995, a similar candle was printed the day before the legendary 1990's bull ran began.
Could it really be that simple? Maybe not. But the historical price action from 30 years ago has a LOT more parallels than that. Take these examples from the ETF's first all-time-high in 1994 & the recent all-time-high that has just been surpassed...
The marubozu candles both printed following a descending wedge/megaphone formation, then a sharp uptrend with an unfilled gap beneath the final price action.
But are there any bearish historical parallels? Yes, actually. Sort of.
Price-action in SPY futures is also similar to the Nikkei's 1998 futures trading. Note the same kind of lows in October 1998/2022 and March 1999/2023, with similar volume. A technical pullback happened at approximately the same time as now. However, a just as in 1994, a run to new all-time-highs followed on the futures chart - but not a new bull market in Japan. In this scenario, SPY has a target of approximately 535 before reversal.
SPY price action seems more bullish now than either of the scenarios I have highlighted, though!
Every day at this point we don't see a sizable rejection suggests this is the start of some new wave in the ETF's history.
Trade safe!

Short term SPY target 503Short term target for SPY is 503 over the next few weeks. This is the area of the most support with the gap up. Upward channel from the last 3 months was broken several days ago, and now we are in a different technical situation.

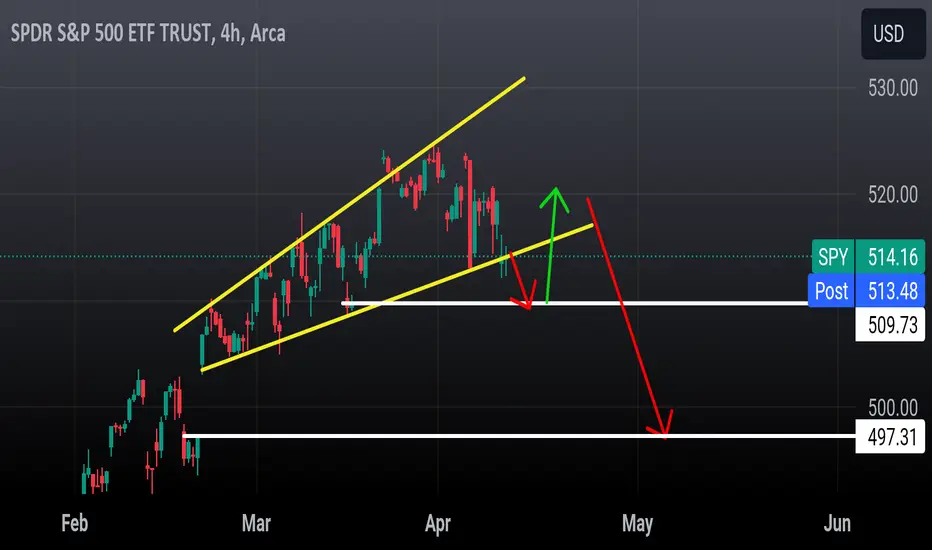
SpyLooking for a gap close at 509 by End of week followed by a bounce back to 518-520 before the next leg down to 497..
Ascending broadening wedge here.
Vix 4 hour chart.. is flagging for a move up to 18 .
Dow jones
Bear channel formed here. Next target is 37,800.. I expect a dead cat there before fi al target of 37,000
Nasdaq or IXIC
Looking for 15,930 this week then A bounce back to 16,250 before a correction down to 15,500 gap close.. what this looks like on QQQ is a drop to 433 then a pop to 441 before a leg down to 420
Camina o revienta.Slow move up, very slow, more slow than I would like and desire. But UP, at the end. Some might call it "acumulation" or any fashion word to describe what market does for unkownn reasons, when it moves slowly.
So here are the rhythms of this FOUR year corrective move. And now? walk or Burst (again), fly or Die (once more).
I chose the first.Is my choice. In fact I see the sector reaching all time hights again during 2025.
It would not be a path full of roses. When has it been before?
In a nutshell for this coming year:
- Dollar mainly down.
- Gold mainy UP
- Miner mainly UP-
And in addition to all this:
- General Markets (S&P500) also UP to all tme hights.
- China (Shanghai Index) up, in a explosive manner.

DIA may experience a significant drop, but it won't be the endStatistically throughout history, on average, stocks drop by at least 10% at least once a year. I believe that moment may have finally arrived for DIA.

DXYZ I posted yeateday as a potential breakout of this pattern. I was leaning on the bullish end with a target of 68 if we could breakout of 55 and hold. We struggled and found reistance there.
I had a long opened at the support
Of 51$ which ended up breaking. I discussed if we lost 49 $ o would stop out and look for target of 37$
We ended up breaking around 430 pm and I closed it trade for small loss. As of now DXYZ has reached the price target of 37$ which could be an area to look for bounce back to 46$ which is the .618 fib
Market is weak but I think this support holds for short term bounce zone

SPY entered a downwards channelUnless we get a strong move on the upside and break the resistance, I expect AMEX:SPY to fall under $510 soon.

$VUTY - Accumulating Needs to break above 17.40 to confirm, but I am liking the higher lows and slowly building a position in anticipation of a break higher.

SPY LONG: scout for hourly higher lowBulls defended the weekly low and made a convincing breakout yesterday. This is a powerful statement, although buyers have not yet proven their control. To do that, they must first establish a weekly higher low, which is likely to happen next week (of course, we need to monitor how things develop). This presents a great opportunity for a long play, but buyers should wait for a pullback and scout for an hourly higher low. Ideally, this should occur near the previous Volume Area High (VAH). An example of the trade is shown on the chart.
You can read full analysis of the market below
Disclaimer
I don't give trading or investing advice, just sharing my thoughts.
LTCN About To Print MillionairesHello everyone, I figured I would do an updated chart on LTCN. My previous chart played out as predicted so far.
So, LTCN is in a clear breakout. Local top is coming around $30 with a possible 50% correction back down to $15 at that time. Coincidentally after the current cup and handle plays out, this correction will be forming a much larger cup and handle pattern on a higher degree of trend. If this larger cup and handle plays out then I can see LTCN hitting all time highs and probably breaking through into price discovery where we could see $1000 + LTCN. For this to happen then the native Litecoin cryptocurrency would have to be into the thousands of dollars. Either we are all crazy or Litecoin crypto is about to print bigger millionaires. Hold onto your hats folks, things are about to get interesting. Good luck out there.
This is just my opinion, none of this should be considered financial advice in any way.

Precious Metals minersThis is something I look at in terms of health (outlook) for PM mining stocks (see GDX and GDXJ etfs)
Mining stocks have been battered in recent times but just when everyone gives up on them is probably a decent contrarian time to start looking for higher prices
the ratio of small miners/big miners looks like it is about to break out a little higher which generally is a positive signal for the sector as a whole (risk on for the sector)

LTCN Following BCHG, Dont Get Shaken Out Here!I just wanted to point out where I believe we are in the LTCN cycle. BCHG seems to have front run LTCN in this cycle. BCHG broke through the .786 and corrected perfectly down to touch the .7 LTCN is correcting are the .618 where BCHG didnt. So what I see is LTCN is going to break the .786 at $132 spike up to $160 and then come back down to the .7 at $84 before a straight shot up to all time high. Dont get shaken out here right before the massive parabolic rally in cryptos and crypto stocks.
Also something to note is the STOCH RSI and RSI look much more bullish on the LTCN chart where the BCHG chart looks a little more toppy and corrective.
Not financial advice just my opinion. Thank you

GOLD: NOT SO STRANGE AT ALLHi guys, if you follow daily the market here there is not a strange situation.
Many guru claim that we're on the verge on something big, obviously I don't know but this movement was so called.
When you find a pattern you don't have to act but react.
If you are wrong positioned, you can close and change position, it's so easy.
I was bearish 2yrs ago (if I well remember) on Gold, but since 2023 the pattern is clear and this breakout has confirmed that short the market is always a bad decision.
Let's see if we play in the same way or we could see something different.

TLT Treasuries Long breaks down under VWAP SHORTTLT on a 120 minute chart has continued its trend down since early December after a suddent
uptrend in November lasting for a two month until the end of 2023.
Inflation data is kicking the rate cut down the road of time.
Price has now fallen under the VWAP and all of the EMA lines including the EMA20.
Relative strength trending correlates with price . I conclude, TLT continues to be set up
SHORT or alternatively TBT LONG . I will take short trades at weekly highs on a 30-60
minute chart until signs of a reversal are seen on the chart.

FAZ Triple Leveraged Bearish Financial Sector LONGThe idea is on this FAZ 15 minute chart. This is a ply on the idea that a rate cut may get kicked
down the road and a rate increase may come into consideration as a result of the report
of "sticky inflation".

The SPY is going up for 2 more days...The SPY will continue to go up for 2 more days staying within this channel area. I suspect it will hit the target point I have indicated on my chart by Feb. 6th.
I have also used Fibonacci on this chart and you can see that both my time and target price prediction matches the Fibonacci retracement of 2.618 when it meets the top of the channel. The target price is 506 on Feb. 6th before it heads down towards the lower part of the channel.
Happy trading!

Triangle peaking March 12, when US Inflation data released ...There is a triangle forming which is peaking around March 12 which is when the US inflation data is being released. According to the theory, the market can either go up or down at the peak of the triangle by approximately the same distance as the height of the triangle formation.
I suspect it will go down at the peak of the triangle due the weekly indicators showing an overbought signal. I would wait for my daily indicators and weekly indicators to align to confirm an entry point.
In the past, such as the beginning of Feb, 2018 or October, 2018 or even the big drop in 2020, the market dropped 61%, then retraced between 38.2-50% of the previous move then moved back down to another Fibonacci level. You can also find the end of the move by measuring the distance between the top of the triangle (A) to the bottom of the move (B). After the market retraces upward,the distance between C to D should equal A to B.
Typically, I find that the market progresses in 6 day moves or fractions of 6 days. So, if the market moves around March 12th like I think it will, the SPY will drop 6 days down from Point A, March 12th to Point B, March 19th. The Fed meeting is scheduled on March 19th and 20th, 2024. So around that time, the market will bounce back up (retrace) between 38.2% to 50% (Point C). It will probably peak on that retracement around March 21st or 22nd before heading down again the following week. It will stop around March 28th just before the Easter long weekend (Point D). After the Easter long weekend, the SPY should bounce back up.
I only use important events or long weekends as beginning and end points as I find chart movements seem to pivot around those days. But I use the daily and weekly chart indicators as barometers as when the market will move.
I use the DMI, MacD, Stoch RSI and MOM as indicators to guide my entries and exits.
EXTRA INFORMATION:
INFLATION: When Bill Clinton was in power, congress changed the definition of inflation and how it was calculated. Why?!? To reduce transfer payments from the government to the people. The inflation calculation changed when Congress implemented the Boskin Commission Findings where it implemented substitution, weighting, and hedonics into the calculation of inflation, thereby manipulating the inflation rate to reduce the transfer payments from the government to the people.
Substitution Effect - We no longer measure the cost of goods and services from one year to the next because of the substitution effect. This effect assumes when the price of something goes up, we will switch to something cheaper. So, if milk goes up, we will switch to powder milk or something cheaper to drink.
Weighting Effect – When something rises too fast, it is assumed people will use less of these things. For example, Health Care is calculated at 17% in the GDP calculation but is only being recorded as 6% of the CPI basket. Because health care costs are increasing so rapidly, the impact of recording a smaller weighting of health care costs means a reduction of reported inflation.
Hedonics – This is supposed to adjust for the quality improvement which leads to greater enjoyment or utility of the product. It assumes new features are always beneficial and are synonymous with falling prices. Hedonics accounts for 46% of CPI. So, if a TV is bought with a new feature, this is synonymous with quality improvement and a greater utility of this product. So, this new feature is synonymous with falling prices.
Added to this manipulation of inflation is the fact that years ago, common purchases such as gasoline, fruits, vegetables, and cigarettes were removed from this already manipulative calculation on the grounds that their prices are volatile. And we know that no one here buys gas or eats fruits and vegetables -- We all walk and eat candy to keep us alive.
If we were to calculate inflation without these manipulative methods, inflation would be much higher, hence increasing transfer payments from the government to citizens. John Williams of Shadowstatistics.com calculates everything like it was in the 1980s. Mr. Williams finds if inflation was calculated like it used to be, then we would have around 10% inflation rate or more as opposed to under 2% rate that is currently being reported every year. Inflation is not reduced just because you calculate it a different way. That is why there is such a huge disconnect between the declared inflation rate and the prices you see in the store.
To illustrate this manipulation of facts and numbers, I will use the calculation of a person's age and the Canadian Pension as an example.
Let's say the government wants to save some money through the Canadian Pension. They decided to implement the Sunday Commission Findings which was a study done by some retired politicians. (This is a fictitious study used just to illustrate the manipulation of inflation.)
In this study, these retired politicians realize the public typically has 2 days off a week. On one of those days the public needs to get errands done but the other day off is used to relax a bit and regroup. Therefore, this commission makes an assumption that there is little to no aging done on that one day where a person relaxes .
So this commission now states that one day a week the public has time off to relax should not be included in the calculation of his age in relation to the Canadian Pension.
Now, the government states a 65 year old who is just about to retire isn't really 65 years old but instead just a little over 58 years old. (Given that 1 day a week does not age you because you relax so there are 52 days/year you relax, multiply that by 47 years (given a person starts working at 18).) That equals 2,444 days or 6.69 years where a person does not age due to the fact he is relaxing on his day off. So a 65 year old is now just a little over 58 years old with this new calculation.
With this 'new' calculation, a 65 year old man isn't really 65 years old and therefore is not deserving of a pension yet.
So now the government does not have to give the man a Canadian pension for another 7 years. Now multiply that number by all the retirees. That's a lot of money saved!!!
That is exactly what this "new" calculation of inflation or the Boskin Commission Findings is doing. It is just a manipulation of numbers just like the politician's Sunday Commission Findings.
KONDRATIEFF WAVE CYCLE - There are 4 cycles to the Kondratieff Wave Cycle; Spring, Summer, Fall and Winter. Each cycle lasts between 24-26 years. This could be the final drop of the 24-26 Kondrateiff wave cycle, but for some reason I do not think it is. I have a sneaking suspicion this is just a temporary drop and it will go back up around 2026 before it makes the final drop. But we will have to wait and see. All I have now, are suspicions.

Going back up for a while I suspect the Spy will continue to go up at least until March 1, 2024.
There were 2 budget deadlines for the US set for Jan. 19th and Feb. 2 of 2024. But both of those deadlines have been pushed out in the future.
The first budget deadline at midnight on January 19 was pushed out to Mar.1, 2024 includes the following areas: Agriculture, Rural Development, and the Food and Drug Administration; Energy and Water Development; Military Construction and Veterans Affairs; and Transportation, Housing and Urban Development.
Next on Mar.8, 2024, the remaining areas would lose funding. These are: Defense; Commerce, Justice and Science; Financial Services and General Government; Homeland Security; Interior, Environment and Related Agencies; Labor, Health and Human Services and Education; The Legislative Branch; and State and Foreign Operations. The previous deadline for this was on Feb.8, 2024.
I suspect there will be another triangle that can be drawn in the future with the tip around the beginning of March, but we will have to wait until we have some more points are formed on the chart to draw from. For now, all I can conclude is that the market will go up for a little while due to the weekly and daily indicators changing.

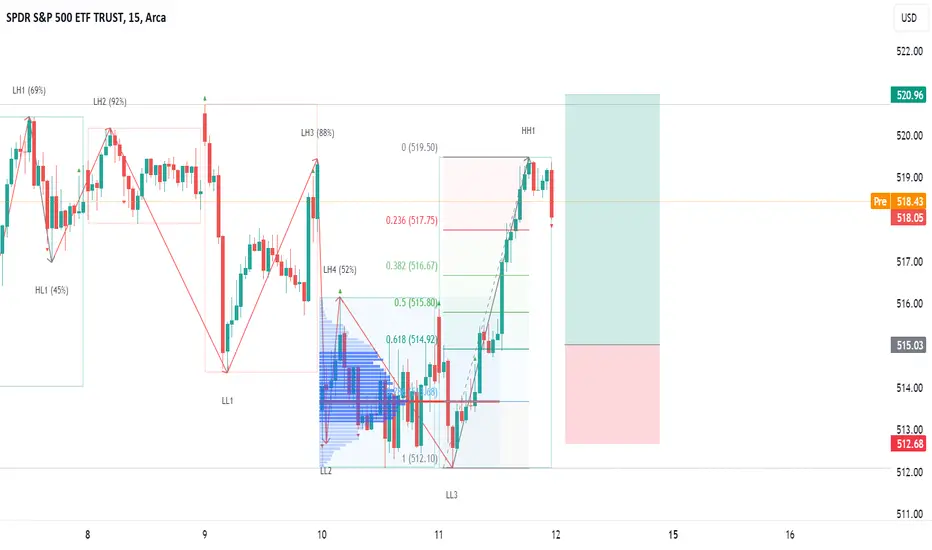
$SPY April 12, 2024AMEX:SPY April 12, 2024
15 Minutes.
As expected ying yang is going on. Stop loss would have hit on both sides.
After the quick fall from 523.86 to 512.76 AMEX:SPY has multiple times taken support at 512 levels.
At the same time it is being resisted at 61.8% of the fall around 520 levels multiple times.
For the first time in days has managed to close above averages in 15 minutes.
For the day AMEX:SPY must hold 515 levels to continue uptrend next week.
On the downside at the moment first support is 510 levels which is 50 days in daily.
So not worth shorting today.
If AMEX:SPY can consolidate between 515 to 520 levels today, then next week should be interesting.
No trade today for me.
