Drawings API
This article describes how to manage drawings using the API.
Methods listed in this article are part of the IChartWidgetApi interface. To call these methods, you should use an IChartWidgetApi instance. To do this, use either the chart or activeChart method.
For more information, refer to Widget methods.
Create drawings
When you create a drawing, you need to specify its position on the chart. The position can be determined with either one or multiple points. To create a drawing, use one of the methods below depending on the drawing type and number of points it requires.
createShape
The createShape method allows you to create a drawing which position on the chart can be determined by only one point. For example, you can create arrows, vertical or horizontal lines, icons, and more. To do this, call createShape and pass information about the point and drawing as parameters.
Point
You should specify one of the objects below to provide information about the point.
StickedPoint. A point is determined by an OHLC price on a bar at a specified timestamp.PricedPoint. A point is determined by a price and timestamp.TimePoint. A point is determined by a timestamp.
When you specify a drawing point, use timestamps that have associated data points on the chart. Otherwise, the library adjusts the time value to the nearest appropriate point.
For example, the current chart resolution is one hour, and the following bars are displayed on the chart: [09:00, 10:00, 11:00, ...].
If you specify a drawing at 09:30, the library shifts it to 09:00.
Moreover, if you change the resolution to 30 minutes and the data point at 09:30 appears, the library will still display the drawing at 09:00.
Drawing
You should specify a CreateShapeOptions object to provide information about the drawing, such as drawing type and overrides, and configure user control over drawings. For example, you can use the lock property to disable moving and deleting drawings in the UI.
Consider the code sample below that creates a play icon.
widget.chart().createShape(
    { time: 1514796562, price: 150 },
    {
      shape: "icon",
      icon: 0xf0da,
    }
)
Note that the icon value should be a hex number, not a string.
createMultipointShape
The createMultipointShape method allows you to create a drawing which position on the chart is determined by multiple points. For example, you can create triangles, trend lines, rectangles, and more. To do this, call createMultipointShape and pass an array of points and a CreateMultipointShapeOptions object as parameters.
You can check the number of required points in the Settings dialog of a certain drawing. If you pass a wrong number of points, you get the following issue: Error: Wrong points count for "drawing_name". Required "number".
Consider the CodePen below that displays Parallel Channel and Info Line right after the chart is loaded.
createExecutionShape
The createExecutionShape method allows you to display an execution drawing on the chart. The execution is represented with buy/sell arrows. Unlike other types of drawings, users cannot change or move the execution drawings in the UI.
The createExecutionShape method returns an instance of the IExecutionLineAdapter interface that provides an extensive API for adjusting the drawing settings. For example, you can specify an arrow color and text. Note that you cannot change the arrow size.
If execution drawings created via createExecutionShape do not meet your requirements, you can emulate these drawings using the createShape method.
Consider the CodePen below that demonstrates how to display buy/sell arrows using createExecutionShapeand createShape. These arrows represent trading history.
createAnchoredShape
The createAnchoredShape method allows you to create an anchored drawing. These drawings are fixed on the same position and do not move when a user scrolls the chart. The drawing points are measured as percentage from the top-left corner of the chart.
To create an anchored drawing, call the createAnchoredShape method and pass a PositionPercents and CreateAnchoredShapeOptions objects as parameters.
For example, the code sample below creates an anchored text.
widget.activeChart().createAnchoredShape(
    { x: 0.1, y: 0.3 },
    { shape: "anchored_text", text: "This is an anchored drawing", overrides: { color: "green" }}
);
Attach drawing to indicator
You can attach a drawing to a certain indicator on the chart.
To do this, specify the ownerStudyId property when you create a drawing using the methods above.
For example, the code sample below attaches an icon to the Exponential Moving Average (EMA) indicator.
// Create the EMA indicator
const emaId = await widget.activeChart().createStudy('Moving Average Exponential', false, false, { length: 26 });
// Draw an icon and attach it to EMA
widget.chart().createShape(
    { time: 1714796562, price: 170 },
    {
        shape: "icon",
        icon: 0xf0da,
        ownerStudyId: emaId,
    }
)
The attached drawing follows the indicator when the indicator is moved to another pane. If you delete the indicator, all attached drawings are also deleted.
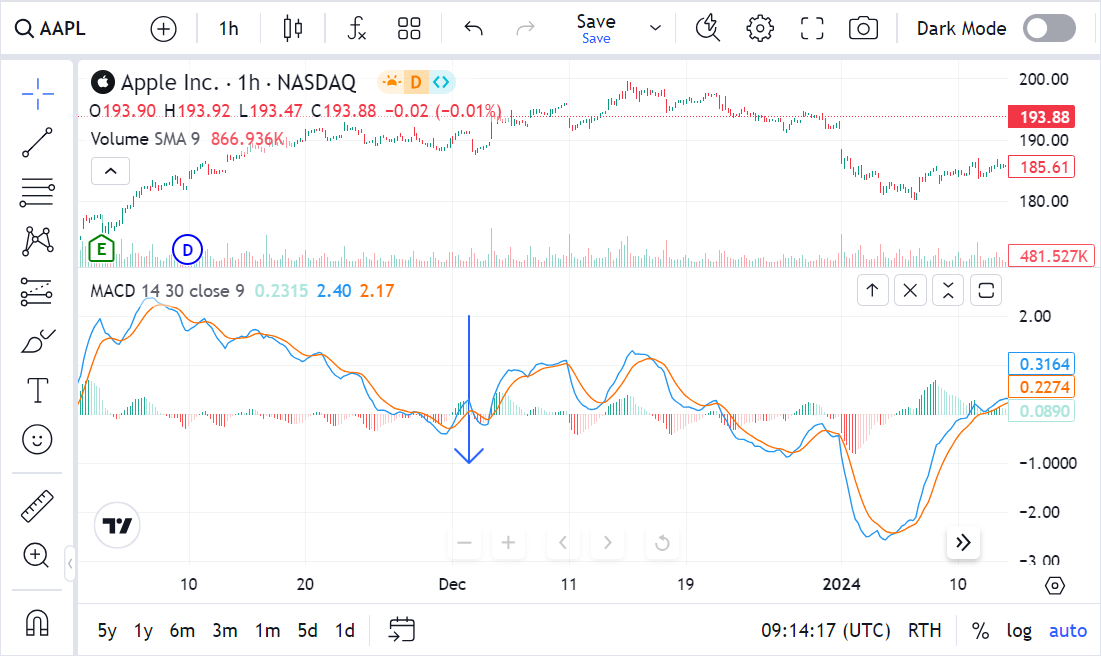
By default, drawings are displayed on the pane with the main series. You can use ownerStudyId to display a drawing on a separate pane that contains indicator. For example, the code sample below creates the Moving Average Convergence/Divergence (MACD) indicator and displays an arrow on the indicator's pane.
// Create the MACD indicator
const macdId = await widget.activeChart().createStudy('MACD', false, false, { in_0: 14, in_1: 30, in_3: 'close', in_2: 9 });
// Draw an arrow on the MACD pane
widget.activeChart().createMultipointShape(
    [
      {
          time: 1701698287,
          price: 2,
      },
      {
          time: 1701698287,
          price: -1,
      },
    ],
    {
        shape: 'arrow',
        text: "text",
        ownerStudyId: macdId
    }
)
Manage drawings
When you create a drawing using either createShape, createMultipointShape, or createAnchoredShape, the methods return the drawing's ID. You can use this ID to refer to the drawing and manage it. For example, you can specify if users can select the drawing in the UI
or change drawing properties.
To do this, use the getShapeById method and pass an ID as a parameter. getShapeById returns an instance of the ILineDataSourceApi interface that provides an extensive API for controlling the drawing.
The code sample below gets all drawing properties.
widget.activeChart().getShapeById(id).getProperties();
Get drawings
To get a list of all drawings on the chart and their IDs, use the getAllShapes method.
widget.activeChart().getAllShapes();
Remove drawings
removeEntity
When you create a drawing using either createShape, createMultipointShape, or createAnchoredShape, the methods return the drawing's ID via a Promise. You can use this ID to remove the drawing from the chart.
To do this, use the removeEntity method.
widget.activeChart().removeEntity(id);
removeAllShapes
To remove all drawings from the chart, use the removeAllShapes method.
widget.activeChart().removeAllShapes();
Drawing events
To handle an event raised when a drawing is added to the chart, call the subscribe method with the drawing parameter.
widget.subscribe('drawing', (event) => {
    console.log(event.value);
});
You can also handle action events, such as moving a drawing or changing its properties.
To do this, subscribe to drawing_event.
widget.subscribe('drawing_event', (id, type) => {
    console.log(id, type);
});
Drawing Groups API
You can combine drawings into groups and manage them as single objects using the group ID.
To do this, call the shapesGroupController method that returns an instance of the IShapesGroupControllerApi interface.
This interface provides methods for controlling the drawing groups.
For example, the code sample below creates a new group from the selected drawings.
widget.activeChart().shapesGroupController().createGroupFromSelection();
When working with groups, consider the following rules:
- Each drawing tool may or may not be part of a specific group. Drawings cannot be part of several groups at the same time.
- Only drawings of the same pane can be grouped.
- A group cannot be empty. Empty groups are automatically removed.
- All drawings in the group have sequential z-indexes. Thus, no other object can be placed between drawings in a group.
- Groups are bound with symbols.