GOLD → False breakout of resistance after a rally...FX:XAUUSD is emerging from consolidation and entering a distribution phase. Spot metal is testing the 4085 mark, facing strong resistance amid progress in ending the US shutdown and weak economic data...
The US Senate has approved a funding bill, but the process takes time (voting in the House of Representatives and Trump's signature).
China: Gold ETFs rose 164% in the first nine months of 2025.
The People's Bank of China has been increasing its reserves for the 11th consecutive month (to 2,303.5 tons).
However, China's temporary easing of trade restrictions (exports of rare metals) supported risk-on sentiment. The probability of a Fed rate cut in December is estimated at 66%.
Technically, we have bullish signals, but after strong growth, there may be a pullback...
Resistance levels: 4085, 4100
Support levels: 4050, 4046, 4030
Gold is testing resistance as part of its bullish run, which is temporarily halting its strong growth. The market may lack the potential to break through resistance, and in order to build up this potential, the price may form a pullback or consolidation...
Best regards, R. Linda!
Parallel Channel

BTCUSD: Bulls Eye Recovery Toward $104K Resistance ZoneHello everyone, here is my breakdown of the current Bitcoin setup.
Market Analysis
BTCUSD is currently showing signs of a potential bullish recovery after bouncing from the key $100,600–$101,200 Support Zone, which aligns with the Wedge Support Line on the chart. This area has acted as a Buyer Zone multiple times in the past, with each test triggering strong upward reactions. The recent fake breakouts below support suggest liquidity sweeps and show that sellers have been unable to sustain momentum to the downside.
Currently, price was moving within a falling wedge structure, reflecting a controlled corrective decline. Throughout this move, several fake breakouts occurred along both boundaries of the wedge, indicating seller exhaustion and possible accumulation by larger buyers. After touching the Support Zone again, BTCUSD formed a bullish reaction, signaling a shift from selling pressure to buying interest. BTCUSD is now approaching the $103,500–$105,000 Resistance Zone, which previously acted as a strong supply level where corrective upswings were rejected. This zone also aligns with the Wedge Resistance Line, making it a key decision area for the next directional move. If buyers can sustain momentum above support, the market may set up for a continued bullish recovery.
My Scenario & Strategy
As long as BTCUSD holds above the $100,600–$101,200 Support Zone, the bullish recovery outlook remains intact. I expect price to continue moving gradually higher toward the $103,500–$105,000 Resistance Zone as the next key target. A confirmed breakout above $105,000 and sustained holding would signal a shift in structure, potentially opening the path toward $110,000 in the medium term.
However, if price breaks back below the Support Zone, the bullish setup becomes invalid and BTCUSD may revisit deeper support levels before any new recovery attempt develops. For now, structure favors bullish continuation, and pullback-based long entries remain the most favorable approach while support holds.
That's the setup I'm tracking. Thank you for your attention, and always manage your risk.

EURUSD Retests Buyer Zone — Bullish Momentum Aiming for 1.1600Hello traders! I’d like to share my view on EURUSD. After an extended bearish trend inside a descending channel, the pair finally found strong buying interest around the 1.15300–1.15400 Buyer Zone, where price reacted multiple times in the past. This area aligns with both the horizontal Support Level and the ascending Support Line, which together form a solid base for potential bullish continuation. Recently, EURUSD broke above the descending resistance line, confirming a possible short-term trend reversal. The price is now retesting the breakout area, showing signs of accumulation above support. As long as price remains above 1.15300, the bullish structure stays valid. The immediate upside target (TP1) is seen around the 1.16000–1.16100 zone, which coincides with the previous consolidation and minor resistance area. A breakout and confirmed close above this zone could open the way toward the 1.16600 Resistance Level. However, a clear bearish rejection pattern near 1.16000–1.16100 might lead to another corrective pullback back into the Buyer Zone before further continuation. Please share this idea with your friends and click Boost 🚀

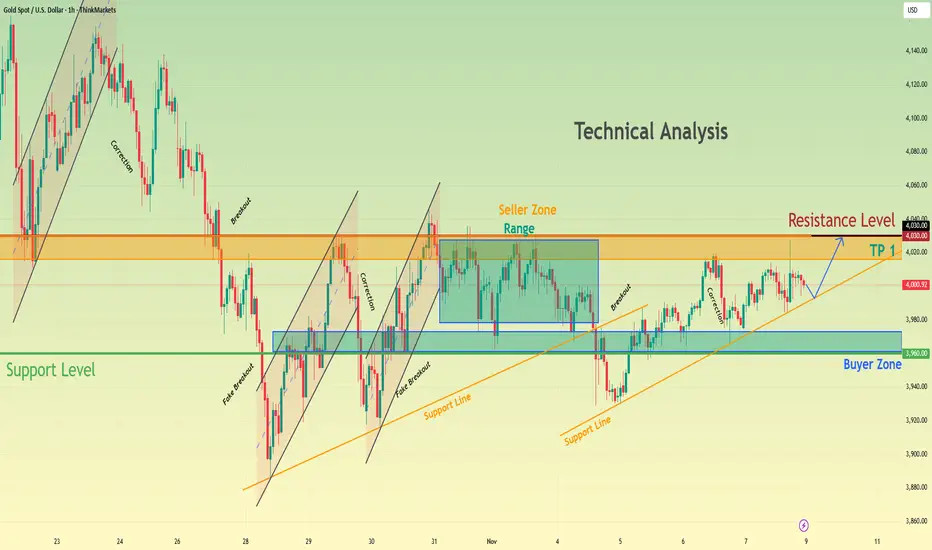
GOLD → Gold within the trading range...FX:XAUUSD is consolidating amid a pullback in the dollar and in anticipation of stronger key data as a driver for movement. Focus on the current trading range
On Friday, before the close of the session, the market formed a short squeeze, a strange volatility without news. It is important to monitor the Asian and European sessions and price behavior within the current trading range.
Earlier, we saw the dollar rise along with gold, indicating the strength of the metal and interest from the bulls. Let's assume that this situation has not yet run its course. In that case, after Friday's short squeeze, I expect MM to test liquidity in the 3985-3964 zone before a possible attempt to grow. Support from the upward channel may also affect the price. I still consider 4030 to be an important resistance level. If the bulls manage to break this barrier and keep the price above this level, gold will be able to end its correction and move into a growth phase. Otherwise, the market will tend to break out of the current consolidation downwards...
Resistance levels: 4020, 4030 - 4050
Support levels: 3985, 3963, 3931
Technically, while the price is within the trading range, it is worth considering trading relative to its boundaries. The fundamental background during the weekend is difficult to assess, so we will need to watch the situation during the European session...
Best regards, R. Linda!

EURUSD Long: Bullish Correction Toward 1.16100 ResistanceHello traders! EURUSD is showing signs of recovery after an extended period of bearish movement inside a descending channel, where sellers controlled the market structure. After several failed attempts to break above the upper boundary, the price has formed a Pivot Point near the Demand Zone around 1.15300, a level where buyers have previously shown strong reaction.
Currently, a rising Demand Line now supports the bullish correction, helping price break out of the descending channel to the upside. The pair is currently moving toward the Supply Zone located at 1.15900–1.16100, which aligns with a key resistance level that previously triggered reversals.For now, the 1.15300 area remains the critical support for buyers.
I expect, holding above this level may allow EURUSD to continue pushing toward the 1.16100 resistance. However, any bearish rejection pattern in the 1.15900–1.16100 zone would signal a potential pullback toward the Demand Line or a retest of 1.15300. On the other hand, a confirmed break and close above 1.16100 would indicate a possible shift toward a medium-term bullish structure. Manage your risk!

XAUUSD Holds Buyer Zone — Potential Recovery Toward $4,030Hello traders, I’d like to share my view on Gold (XAUUSD). The market has been holding a constructive bullish structure, developing higher lows along the rising Support Line. Each time price approached this trendline, buyers reacted strongly, confirming persistent demand. Meanwhile, the $3,960–$3,980 Buyer Zone has acted as a key accumulation area, where several fake breakouts occurred, but price quickly returned back above support — indicating seller failure and liquidity sweeps before bullish continuation. On the upper side, we have a clear Resistance Level and Seller Zone near $4,020–$4,040, where the market previously consolidated inside a range. Multiple rejections were seen in this zone, suggesting that sellers are active here and this remains the next significant reaction area for price. Recently, Gold has been gradually moving upward from the buyer zone, forming a steady corrective climb inside the current structure. At this stage, the trend remains bullish while price stays above the ascending Support Line and Buyer Zone. The immediate objective for buyers is a retest of the $4,020–$4,030 Resistance Level, where price may react again based on previous market behavior. A confirmed breakout above this zone would open the way for further continuation, while rejection could lead to another pullback into the support structure. Please share this idea with your friends and click Boost 🚀
Big Catalysts Behind Bitcoin’s Pump – Can BTC Hit $110K?Bitcoin ( BINANCE:BTCUSDT ) started pumping yesterday as I expected in my previous idea . Let's take a look at the fundamental reasons for Bitcoin .
Why the sudden BTC pump? Here are the 3 BIG catalysts hitting at once:
1-US Government Shutdown officially ending tomorrow (Nov 12)
Senate finally reached a budget deal. Treasury General Account (TGA) will start draining → hundreds of billions in fresh liquidity flooding markets. Same thing that ignited the 2020-2021 bull run.
2-Trump’s “Tariff Dividend”
President promised every American adult at least $2,000 from tariff revenue (potentially $400B+ total). Last time we got $1,200 stimulus checks, BTC went from $7K → $69K. Do the math.
3-Short squeeze + ETF flow reversal
Despite last week’s $1.22B ETF outflows, today we’re seeing fresh bids stacking. Bears who shorted the dip are now fuel for the rocket.
------------------------------------------------------------------------------
Let's take a look at Bitcoin’s technical analysis on the 1-hour timeframe .
Right now, Bitcoin is trading around a Resistance zone($107,600,980-$106,100) , and it looks like it might be forming a potential ascending channel , though the second top of that channel isn’t confirmed yet.
My expectation is that after a brief pullback to the Support zone($104,840-$103,600) —where there’s also Cumulative Long Liquidation Leverage($105,311-$104,111) —Bitcoin could start rising again and attempt to break through the Resistance lines. If BTC manages to break above those Resistance lines, then the next target could be around $110,000 .
Cumulative Long Liquidation Leverage: $99,865-$98,168
Cumulative Short Liquidation Leverage: $112,590-$111,459
New CME Gap: $104,565-$104,160
So what do you think? Can Bitcoin push up to $110,000, or will it turn back down again?
Note: These days, the market can be pretty volatile and unpredictable, so always remember to manage your risk and stick to your risk management strategy.
Please respect each other's ideas and express them politely if you agree or disagree.
Bitcoin Analysis (BTCUSDT), 1-hour time frame.
Be sure to follow the updated ideas.
Do not forget to put a Stop loss for your positions (For every position you want to open).
Please follow your strategy and updates; this is just my Idea, and I will gladly see your ideas in this post.
Please do not forget the ✅' like '✅ button 🙏😊 & Share it with your friends; thanks, and Trade safe.

DOGEUSDT weekly support hold strong wait for more pumpAs observed on the chart, the major weekly support for DOGEUSDT at $0.15 has demonstrated significant resilience, establishing a robust foundation for the asset. The subsequent bullish momentum we anticipated has indeed commenced, indicating a potential shift in market structure.
The critical technical level to monitor is the primary descending trendline resistance. A decisive and high-volume breakout above this resistance would serve as a strong confirmation of bullish strength, potentially invalidating the prior downtrend. Such a validated breakout could initiate a new bullish phase, with the potential to challenge previous cycle highs and establish new all-time highs on the chart.
DISCLAIMER: ((trade based on your own decision))
<<press like👍 if you enjoy💚

GOLD (XAUUSD): Support & Resistance Analysis for Next Week
Here is my structure analysis for Gold for next week.
Support 1: 3868 - 3927 area
Support 2: 3766 - 3830 area
Support 3: 3690 - 3736 area
Resistance 1: 4023 - 4109 area
Resistance 2: 4187 - 4245 area
Resistance 3: 4357 - 4383 area
As we discussed earlier, the price is stuck within a range now
and we see a consolidation.
With the absence of high impact fundamentals, a sideways price action
will likely continue.
❤️Please, support my work with like, thank you!❤️
I am part of Trade Nation's Influencer program and receive a monthly fee for using their TradingView charts in my analysis.

BTCUSD Long: Breakout From Descending Channel Targets $108KHello traders! Bitcoin is showing a potential continuation of bullish momentum after breaking out of the descending channel, where sellers had previously maintained control over the market structure. During the prolonged downtrend, the price consistently made lower highs and lower lows, until forming a strong Pivot Point near the $100,500–$101,000 Demand Zone — an area that has historically triggered solid bullish reactions.
Currently, after a fake breakout below this demand zone, the price quickly recovered, signaling liquidity sweeps and seller exhaustion. Since then, BTCUSD has rebounded strongly, confirming a structural shift from bearish to bullish control. The pair has now broken above the channel resistance, establishing a short-term bullish bias supported by steady higher lows. At the moment, Bitcoin is approaching the $107,500–$108,000 Supply Zone, which coincides with previous market consolidation and marks a potential reaction area where sellers might temporarily slow down the move. A clean breakout and close above $108,000 would open the door for a further rally toward the $111,000 Supply 2 Zone, reinforcing the medium-term bullish structure.
I expect the $104,500–$105,000 area to act as immediate support and a key retest level, allowing buyers to maintain momentum and target $108,000. Holding above this zone maintains the bullish scenario, while a confirmed break below it could trigger a pullback to the previous demand level before a new rally develops. Manage your risk!

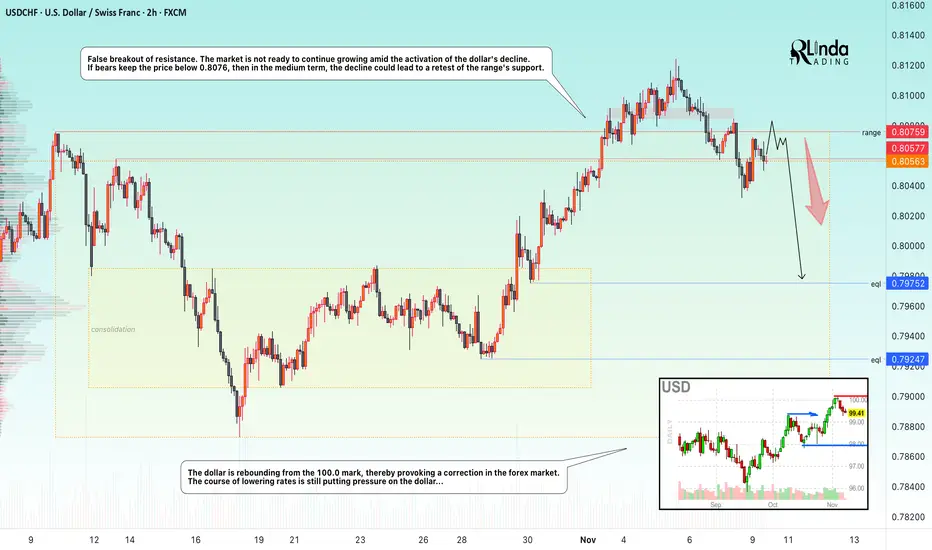
USDCHF → Manipulation? False breakout of resistance FX:USDCHF attempted to take advantage of the trend reversal opportunity after breaking out of a descending wedge, but the weak dollar hindered the rally...
The currency pair is facing resistance at 0.8076. There is no continuation of the momentum towards a breakout, and bearish pressure, which is intensifying as the dollar index declines, is negatively affecting the currency pair. The price has returned to the trading range, with an emphasis on 0.8057 - 0.8076. If the bears keep the price below this zone, this move could trigger further sell-offs.
Resistance levels: 0.8057, 0.8076
Support levels: 0.7957, 0.7925
The false breakout confirms that sellers currently have the upper hand and buyers lack the strength to push the price higher. Accordingly, consolidation below the key level could trigger a further decline towards the zone of interest at 0.7975.
Best regards, R. Linda!
USDCAD - Bulls Preparing to Reload!📈USDCAD has been moving within a clear ascending channel, maintaining a well-defined bullish structure over the past months.
After rejecting the upper bound, price is now pulling back toward a key confluence area, the intersection of the orange support zone and the lower trendline of the channel.
🏹This zone is crucial, as it has acted as a strong demand area in the past, where buyers consistently regained control. From here, I’ll be looking for long setups, aiming for a continuation toward the upper bound of the channel once more.
⚔️As long as the price holds above the orange zone, the overall bullish momentum remains intact.
⚠️ Disclaimer: This is not financial advice. Always do your own research and manage risk properly.
📊All Strategies Are Good; If Managed Properly!
~Richard Nasr

BTCUSD Tests Buyer Zone — Eyes Break Below $100KHello traders, here’s my current outlook on Bitcoin (BTCUSD). The market continues to trade within a broader bearish structure after breaking down from the previous rising channel. The price failed to hold above the $110,000–$111,000 Seller Zone, where multiple fake breakouts occurred, indicating strong bearish pressure and aggressive selling activity in that region. After the rejection from the Seller Zone, BTC shifted into a descending trend structure, forming lower highs along a clearly defined Resistance Trendline. Each corrective move to the upside has been capped by this trendline, confirming that sellers are maintaining control. Meanwhile, the Support Level around $100,200–$101,000 has acted as a key Buyer Zone, where price has repeatedly paused and reacted, suggesting that buyers are attempting to absorb selling pressure here. Currently, BTC is consolidating just above this Support Zone, but the overall momentum remains bearish. If the price fails to break above the descending Resistance Line, we could see a continuation of the downtrend, likely pushing toward a retest of the $100,200 Support Level. A confirmed breakdown below this level would expose the next downside support levels and reinforce the sellers’ dominance. However, if buyers manage to hold the price above $100,200 and force a breakout above the descending Resistance Line, a short-term corrective recovery could unfold toward the $103,000–$105,000 region. This area remains critical and is likely where sellers may look to re-enter the market based on previous reaction structure. For now, the market structure favors a bearish bias, with the trend down and sellers maintaining stronger control. I am watching for a reaction at the current support — if the level breaks, continuation lower becomes the primary expectation. Please share this idea with your friends and click Boost 🚀

SLPUSDT Major breakout and PUMP is ahead NOW!!!As detailed in our prior technical assessment, the price has conclusively broken above the descending channel's resistance and successfully retested it as support. This breakout is further validated by a notable increase in trading volume, confirming heightened bullish momentum. The structure suggests the completion of an accumulation phase, indicating a high probability of a sustained upward movement imminently.
DISCLAIMER: ((trade based on your own decision))
<<press like👍 if you enjoy💚

EURUSD: Bulls Aim for Recovery Toward 1.1580 ResistanceHello everyone, here is my breakdown of the current Euro setup.
Market Analysis
EURUSD has recently shown signs of recovery after bouncing from the key 1.1480–1.1500 Support Zone, which aligns with the lower boundary of the Support Structure highlighted on the chart. This area has acted as a strong Buyer Zone multiple times in the past, and once again, price reacted with a clear bullish impulse, indicating active accumulation from buyers.
Recently, before the rebound, EURUSD was moving inside a Downward Channel, with several fake breakouts that illustrated weakening bearish pressure and lack of continuation from sellers. Eventually, price broke above the downward resistance line, signaling a structural shift away from bearish momentum. Following the breakout, EURUSD began forming higher highs and higher lows, confirming the start of a short-term bullish structure. The pair is now trading above the breakout area and approaching the 1.1580 Resistance Zone, which previously acted as a strong Sell Zone and pivot level. If buyers maintain control above the Support Zone, the bullish scenario remains favorable, suggesting a continued recovery move.
My Scenario & Strategy
From my perspective, as long as EURUSD holds above the 1.1480–1.1500 Support Zone, the bullish setup remains valid. I expect price to continue moving upward toward the 1.1580 Resistance Level as the next key target. A confirmed breakout and hold above 1.1580 would likely open the path for further bullish continuation, potentially targeting 1.1650 and beyond in the medium term.
However, if EURUSD fails to hold above 1.1480 and breaks back below support, this would invalidate the bullish structure and could send price towards lower levels before any new recovery attempt develops. For now, the structure favors buyers, and I will be looking for pullback-based long entries while price remains above support.
That's the setup I'm tracking. Thank you for your attention, and always manage your risk.

PEPE BUY!Hello friends
Due to the good growth we had, the price has corrected and formed a flag pattern and this pattern has been broken by buyers and now with risk capital management and in a stepwise manner, you can buy and move with it to the specified targets.
*Trade safely with us*

XVGUSD Livermore Accumulation Cylinder - VERGEVerge is currently ranging through a Livermore Accumulation Cylinder pattern. A breakout is expected soon.
In my opinion, as the fractal projection suggests, the future bottom will be at the level of the current ATH, $0.25.
This is not a financial advice. Do you own research.

XAUUSD Long: Bullish Rebound Targeting $4,050 LevelHello traders! Gold (XAUUSD) is trading within a constructive bullish structure after rebounding from the $3,930–$3,960 Demand Zone, which aligns with the lower boundary of the Ascending Channel. This zone has acted as a strong accumulation area where buyers stepped in multiple times, confirming active defense and sustained demand. Earlier, price moved through a corrective phase shaped by the Fibonacci Arc, which guided the downside retracement before buyers regained control. Several Pivot Points formed along the channel, marking clear areas where momentum shifted back in favor of buyers. Additionally, a recent fake breakout below the channel support further emphasizes that sellers are failing to break structure, while liquidity sweeps continue to fuel bullish re-entry opportunities.
Currently, XAUUSD is moving steadily toward the channel midline, with the next key objective located at $4,050, which represents short-term resistance and a known reaction level. A confirmed breakout above $4,050 would open the door for a broader continuation toward the $4,130 Supply Zone, a region where a previous distributive phase occurred. As long as Gold holds above the $3,930–$3,960 Demand Zone, the bullish outlook remains intact.
I expect price to gradually continue higher within the ascending channel. At this stage, the market structure continues to favor buyers, and dips remain attractive opportunities to participate in the upward move. Manage your risk!

GBPJPY | Flag Breakout in Focus – Eyeing 207.00–209.00Technical Lens:
GBPJPY continues to trade within a well-defined ascending channel, with recent consolidation forming a clean flag pattern following the prior impulsive advance. Price is now pressing against the upper boundary of that flag near 204.00, hinting that momentum may be building for a breakout.
Scenarios:
If price breaks above the flag resistance and confirms, the next technical targets sit around 207.00–209.00 — aligning with the upper bound of the broader channel and key Fibonacci projections.
If rejection occurs at current levels, a pullback toward 201.50–202.00 could see the lower flag boundary retested before any continuation attempt.
Takeaway:
GBPJPY remains in a constructive structure within its ascending channel. A confirmed breakout above the flag could see the pair extend toward 207.00–209.00, where the next resistance cluster awaits.

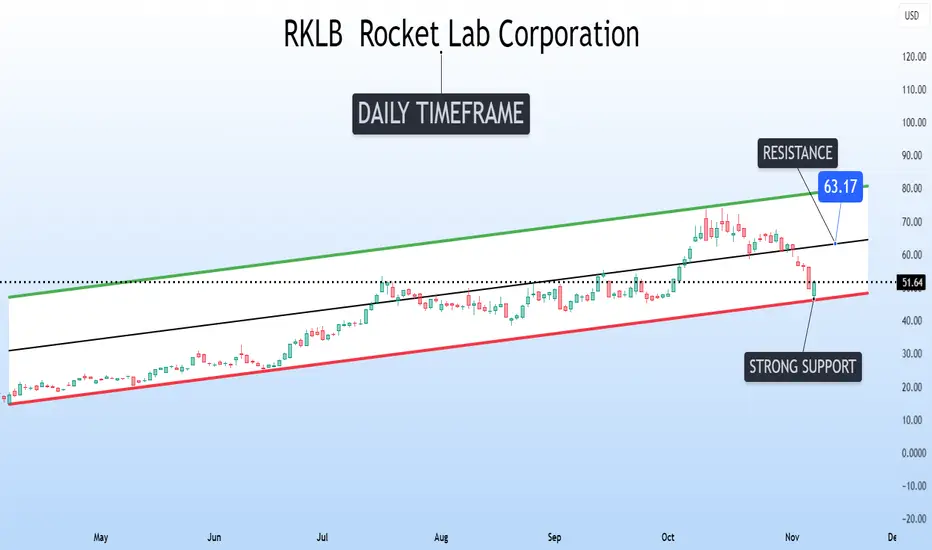
Rocket Lab is bouncing from the bottom of its ascending channelRocket Lab NASDAQ:RKLB is bouncing perfectly from the bottom of its ascending channel on the daily timeframe.
This level has acted as strong support multiple times before, and once again buyers stepped in right where they needed to.
If momentum continues, the next key area to watch is the mid-range resistance near $63.
A solid move toward that level could signal the start of another strong leg for the top of the channel around $80.
$OUST is sitting right on the bottom of its long-term channelNASDAQ:OUST is sitting right on the bottom of its long-term ascending channel, testing major trendline support around $23.
This zone has acted as a launchpad before, sparking strong rebounds each time price touched it.
If the channel holds, a move back toward the mid-range near $34 could unfold.

XAUUSD: Buyers Target $4,080 Resistance ZoneHello everyone, here is my breakdown of the current Gold setup.
Market Analysis
Gold (XAUUSD) has recently formed a constructive bullish structure after rebounding from the 3,930–3,960 Buyer Zone, which aligns with the lower boundary of the Upward Channel. This demand zone has consistently acted as a strong accumulation area, indicating that buyers are actively defending it. Prior to this rebound, price moved within a Downward Channel, where several fake breakouts occurred — showing that sellers were gradually losing momentum and failing to maintain downside pressure.
Currently, a breakout from the Downward Channel shifted the market tone, and since then, XAUUSD has started forming higher lows, signaling an early trend reversal. The price is now trading back inside a new Upward Channel, and the structure suggests buyers are preparing for a continuation move. At the moment, XAUUSD is approaching the mid-range of the channel, while the next major resistance sits near 4,130, which previously acted as a supply level and point of distribution.
My Scenario & Strategy
The current setup suggests that as long as price remains above the 3,930–3,960 demand region, the bullish setup remains intact. I expect Gold to continue moving gradually toward the 4,080–4,130 resistance zone in the short term. A confirmed breakout above 4,130 would likely signal strong bullish continuation, opening the way for a larger upward move toward 4,200 and beyond.
However, if XAUUSD breaks back below 3,930, the bullish structure would be invalidated, and price could revisit deeper support levels before attempting another upward leg. For now, I prefer to look for long entries on pullbacks within the channel, targeting a continuation toward the resistance levels mentioned above.
That's the setup I'm tracking. Thank you for your attention, and always manage your risk.

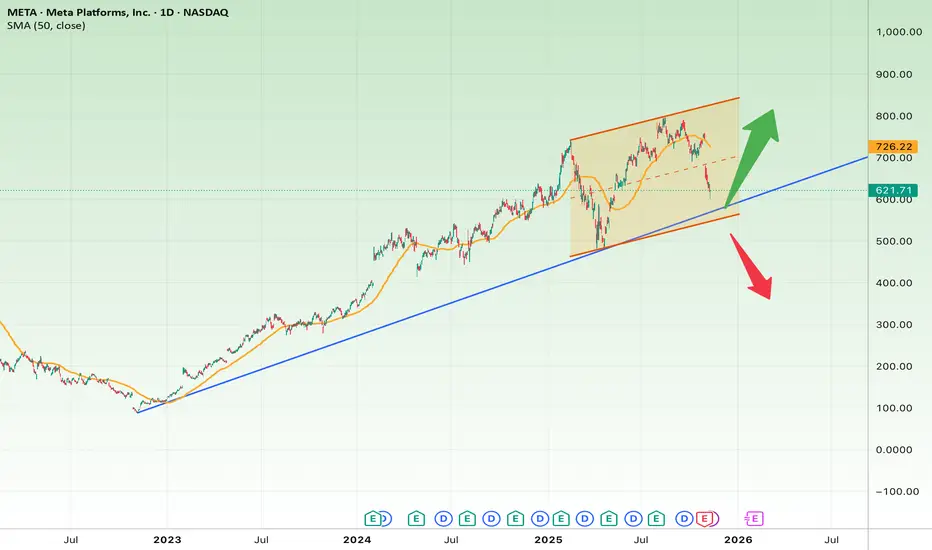
META - Approaching a Key Support ZoneOn the daily chart, META stock has been trading within a rising short-term channel after a strong uptrend from early 2023 to mid-2024. The price is now around $620, approaching the main long-term uptrend line (blue) drawn from the 2023 lows — a critical level that also aligns with the 50-day moving average (SMA50).
Bullish Scenario:
If META holds the $600–$630 support zone and forms a bullish reversal candle, a rebound toward $725 and potentially $800 could follow. This would confirm the continuation of the long-term uptrend.
Bearish Scenario:
If the trendline fails and the price closes below $580, a deeper correction toward $500 is likely. Such a breakdown would indicate the start of a medium-term consolidation phase.
Summary:
The $600 zone is the critical decision point — the line between trend continuation and correction.
As long as META trades above this level, the broader market structure remains bullish.