Key stats
About XVG

Verge on the Verge of a Big BangThis is not a financial advice. It is just my amateur observation as a result of playing around. I have zero experience in trading. So I don't take any liability for your profits or losses, whatsoever. Please always DYOR.
Now to the topic:
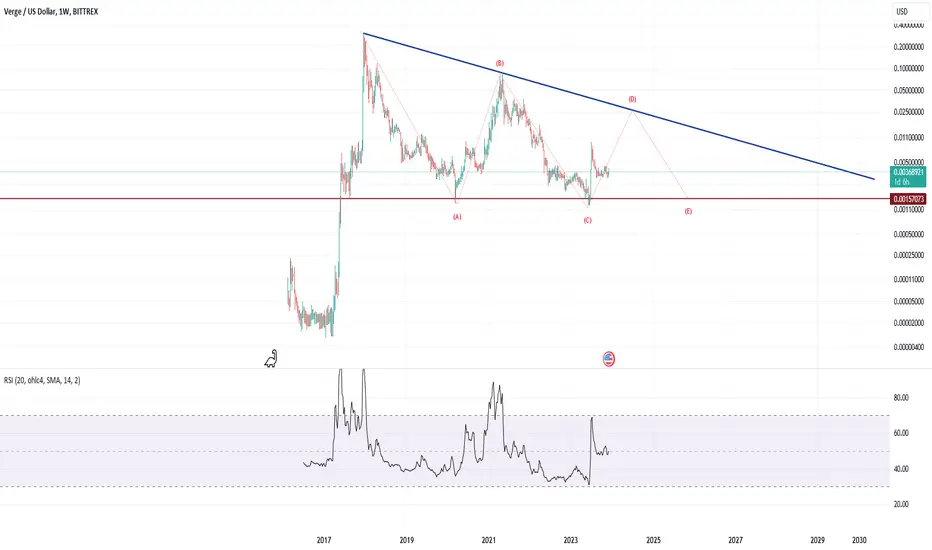
If history is about to repeat itself, its going be this

XVG still correcting- On monthly time frame the RSI is above its SMA. A slightly bullish scenario.
- This could lead us to the upper trendline, so something like ~0.02
- If we see some more momentum building up, for example a bullish diVERGEnce on the RSI, it could continue breaking the upper trendline with a body (n


XVGUSDT SWING TRADESwing trade opportunity. I'm going to keep it simple, XVG it's repeating the same pattern from 2020-2021 'History doesn't repeat itself, but it often rhymes'. Good luck #DYOR

XVG / USD - Breakout of 10 cents or death?It's worth watching for a potential test of the trending ellipse!

buy zone and retire by 2025 I've been following xvg for a long time, March 2020 is close to the support zone. I'm not in a rush to buy. Because even if everything is right, TIME can be a big problem. All shares of xvg are in circulation


See all ideas
Curated watchlists where XVGUSD is featured.

Frequently Asked Questions
The current price of XVG (XVG) is 0.00440550 USD — it has fallen 0.60% in the past 24 hours. Try placing this info into the context by checking out what coins are also gaining and losing at the moment and seeing XVG price chart.
The current market capitalization of XVG (XVG) is 72.79 M USD. To see this number in a context check out our list of crypto coins ranked by their market caps or see crypto market cap charts.
XVG (XVG) trading volume in 24 hours is 1.97 M USD. See how often other coins are traded in this list.
XVG price has fallen by 5.90% over the last week, its month performance shows a 6.76% increase, and as for the last year, XVG has decreased by 4.13%. See more dynamics on XVG price chart.
Keep track of coins' changes with our Crypto heatmap.
Keep track of coins' changes with our Crypto heatmap.
XVG (XVG) reached its highest price on May 1, 2018 — it amounted to 0.85000000 USD. Find more insights on the XVG price chart.
See the list of crypto gainers and choose what best fits your strategy.
See the list of crypto gainers and choose what best fits your strategy.
XVG (XVG) reached the lowest price of 0.00139180 USD on Jun 16, 2023. View more XVG dynamics on the price chart.
See the list of crypto losers to find unexpected opportunities.
See the list of crypto losers to find unexpected opportunities.
The current circulating supply of XVG (XVG) is 16.52 B USD. To get a wider picture you can check out our list of coins with the highest circulating supply, as well as the ones with the lowest number of tokens in circulation.
The safest choice when buying XVG is to go to a well-known crypto exchange. Some of the popular names are Binance, Coinbase, Kraken. But you'll have to find a reliable broker and create an account first. You can trade XVG right from TradingView charts — just choose a broker and connect to your account.
Crypto markets are famous for their volatility, so one should study all the available stats before adding crypto assets to their portfolio. Very often it's technical analysis that comes in handy. We prepared technical ratings for XVG (XVG): today its technical analysis shows the buy signal, and according to the 1 week rating XVG shows the sell signal. And you'd better dig deeper and study 1 month rating too — it's sell. Find inspiration in XVG trading ideas and keep track of what's moving crypto markets with our crypto news feed.
XVG (XVG) is just as reliable as any other crypto asset — this corner of the world market is highly volatile. Today, for instance, XVG is estimated as 0.75% volatile. The only thing it means is that you must prepare and examine all available information before making a decision. And if you're not sure about XVG, you can find more inspiration in our curated watchlists.
You can discuss XVG (XVG) with other users in our public chats, Minds or in the comments to Ideas.