Bitcoin Crash + Largest altcoin analysis requests! (ask me)Write a comment with your altcoin, and I will make an analysis for you in response! Also, please hit boost and follow for more ideas.
I start my analysis with Bitcoin. Currently, I expect a drop to 85k. We have a total of 3 unfilled FVGs (fair value gaps) below the current price, and this is a big deal. These gaps pretty much always tend to be filled. These are no gaps that occurred at the start of the uptrend (near 15k in 2022), but almost before the end of the uptrend (85k in 2024). This is a hugeeeee problem, and I assure you that bitcoin will go down sooner rather than later.
Today we also want to look at the RSI indicator. The RSI indicator is important mostly only on the 1m, 1H, 1D, 1W, and 1M charts. Do not use it on, for example, 15m or 2h charts. On the RSI indicator, we can see a bearish divergence because the price is making a higher high while the indicator is making a lower high. That's a huge sign of weakness.
Also, let's take a look at the moving averages. This is the daily chart, so let's use 50, 100, and 200. These periods are very popular among huge institutions and hedge funds. They mainly like to use 200 and 20. As we can see, the price is too far away from them, which is a sign that the market is overbought and we should wait for a correction. You want to buy at the support, not when the market has already made the move.
Currently I am bearish on Bitcoin. Profit target 1: 92,250, profit target 2: 85,350.
Write a comment with your altcoin, and I will make an analysis for you in response. Also, please hit boost and follow for more ideas. Trading is not hard if you have a good coach! This is not a trade setup, as there is no stop-loss or profit target. I share my trades privately. Thank you, and I wish you successful trades!
Chart Patterns

BIGGEST ALTCOIN RECAP FOR 2024We give glory to God Almighty for the gift of life and good health. As the year 2024 draws to a close, it's the perfect time to prepare our altcoin recap and reflect on the progress we've made.
A big shoutout to TradingView for providing this incredible platform that empowers traders to learn, share, and grow together. Thank you, TradingView, for all you do!
This post is dedicated to reviewing and revisiting all the altcoin requests submitted throughout the year, from January to December. The goal is to ensure clarity and provide updated insights as we wrap up the year and prepare for BIGGEST ALT SEASON 2025.
Links to the analyses can be found here:
December:
November:
October:
September:
August:
July:
June:
May:
April:
March:
February:
January:
Here’s how it works:
Visit any of my previous posts and locate the analysis of the altcoin you’re interested in. Copy the link to that analysis and paste it here in the comments, along with your specific question or request. Your questions can include:
Requesting an update to the existing analysis.
Asking for a fresh analysis from scratch.
Let’s dive in and collaboratively complete our final recap of 2024 altcoin analyses. This is a chance to refine strategies and prepare for the opportunities ahead.
Share your requests, and let’s get to work!

GOLD → Retest 2720. CPI ahead, what to expect?FX:XAUUSD is coming out of a long consolidation and testing 2688. Bulls are trying to keep the defense above this zone, but the risks are increased by the publication of CPI...
Gold was boosted by the escalation of the conflict in the Middle East and renewed buying of gold reserves by China. Amid looming tariffs announced by Trump and weakening labor market conditions, the US inflation report will be crucial in determining the Fed's easing trajectory in the coming months.
Further upside for gold prices hinges on the release of US CPI data, which is likely to set the pace for US Fed action early next year.
Technically, gold is heading towards broad range resistance as well as the 2720 liquidity zone. The chances of reaching the target are high, but a sharp approach and high news volatility could trigger a false breakout.
Resistance levels: 2705, 2720
Support levels: 2688, 2675, 2658
The CPI data may trigger both a rise in the dollar and a deep correction, depending on the interpretation of the current US economy. Gold may react accordingly, but it all depends on the actual data.
Regards R. Linda!

TSLA Wave3 Ends at 900 USD 100% upside BUY/HOLD🔸Hello traders, today let's review daily chart for TSLA. Bullish
impulse currently in progress, recent multiple gaps indicate
further strength with likely very limited downside on pullbacks.
🔸The structure is a 5 waves impulse, currently Wave3 in progress,
2.618 of wave one so expected to complete at/near 900 USD, from
current levels almost 100% upside.
🔸Recommended strategy bulls: BUY/HOLD at market / scoop up
any dips/pullbacks if available. Price target is 900 USD in Q1 2025
we are currently in wave3, which is the strongest bullish wave
of the entire 5 waves structure. PT is 900 USD, 100% upside.
BUY/HOLD setup for patient traders. good luck!
🎁Please hit the like button and
🎁Leave a comment to support our team!
RISK DISCLAIMER:
Trading Futures , Forex, CFDs and Stocks involves a risk of loss.
Please consider carefully if such trading is appropriate for you.
Past performance is not indicative of future results.
Always limit your leverage and use tight stop loss.

XAUUSD: Last Idea Gave Us 940+ Pips, What about Next?Dear Traders,
Hope you are doing well, our last entry moved well and better than what we had expected, due to that reason mainly and how price have moved and its behaviour gave us indication of bullish continuous dominance that will take price upwards of 2790$ region one more time before it reverse. Remember our bias will change depending on how price moves so if you see a different bias do not be shocked or confused. Please refer to the time when the chart was published.
Good luck.

Xrp - Another +100% Pump Is Starting!Xrp ( CRYPTO:XRPUSD ) is sill just getting started:
Click chart above to see the detailed analysis👆🏻
Xrp is so far perfectly following the repetition of cycles after we saw a beautiful breakout candle of November with an insane move of +280%. Looking at previous behaviour, it is now actually very likely that Xrp breaks the previous all time high and continues its strong rally.
Levels to watch: $3.0, $5.0
Keep your long term vision,
Philip (BasicTrading)

GOLD 4H CHART ROUTE MAP UPDATEHey Everyone,
After smashing our 1H chart idea this week, Please see update on our 4H chart idea.
This chart idea also played out to perfection with our cross and lock confirmation giving us plenty of time to get in for the action.
We started the week with our bearish target hit at 2629 with no lock confirming the rejection for the push up. We got our Bullish target hit at 2648, followed with ema5 cross and lock opening 2675, which was hit perfectly. We then saw ema5 cross and lock above 2675 opening 2701, also hit completing this target. We then finished off with ema5 cross and lock above 2701 opening 2726 completing it today. No further cross and lock above 2726 confirmed the rejection for the drop now.
We are now seeing support at 2675 for the bounce and can now continue to track and trade the move again using our weighted levels and cross and lock confirmation.
We will keep the above in mind when taking buys from dips. Our updated levels and weighted levels will allow us to track the movement down and then catch bounces up.
We will continue to buy dips using our support levels taking 30 to 40 pips. As stated before each of our level structures give 20 to 40 pip bounces, which is enough for a nice entry and exit. If you back test the levels we shared every week for the past 24 months, you can see how effectively they were used to trade with or against short/mid term swings and trends.
BULLISH TARGET
2648 - DONE
EMA5 CROSS AND LOCK ABOVE 2648 WILL OPEN THE FOLLOWING BULLISH TARGET
2675 - DONE
EMA5 CROSS AND LOCK ABOVE 2675 WILL OPEN THE FOLLOWING BULLISH TARGET
2701 - DONE
EMA5 CROSS AND LOCK ABOVE 2701 WILL OPEN THE FOLLOWING BULLISH TARGET
2726 - DONE
EMA5 CROSS AND LOCK ABOVE 2726 WILL OPEN THE FOLLOWING BULLISH TARGET
2749
BEARISH TARGETS
2629 - DONE
EMA5 CROSS AND LOCK BELOW 2729 WILL OPEN THE FOLLOWING BEARISH TARGET
2604
EMA5 CROSS AND LOCK BELOW 2604 WILL OPEN THE SWING RANGE
SWING RANGE
2583 - 2561
As always, we will keep you all updated with regular updates throughout the week and how we manage the active ideas and setups. Thank you all for your likes, comments and follows, we really appreciate it!
Mr Gold
GoldViewFX

Spy ShortSpy 597-600
Qqq 514-517
If we are not on path to hitting these levels by Tuesday Wednesday Open I Will Reconsider prolonging my short and just exit the market , To reinter my short at a better time I will Not be going long what so ever at this time will update Mondaay Open!! GoodLuck Traders

4 TRADE LEVELS XAUUSD - PRECISE PRICE LEVEL THEORY After a successful sell in our community at 2719-2726 , today we are presented with a tough perspective due to the fact that now the current market price is entangled between the Supply and Demand Levels of H4 & Daily indicating a market cool off scenario entering a passive sideways.
So best strategy for today is to let the eruption of the market happen first and attempt on a reversal trade rather than seeking for a continuation trend trade.

GOLD ROUTE MAP UPDATEHey Everyone,
Piptastic day on the charts once again, with our chart idea playing out to perfection!!!!
We were able to track and trade the entire move up from Monday confirmed with ema5 lock for each gap target. Yesterdays update finished off with ema5 cross and lock above 2679 opening 2697.
- This target was completed perfectly today followed with further cross and lock above 2697 opening 2712, which was also hit today completing this chart idea.
We can now move over to our 4H chart idea to continue to track the movement should it decide to push further up, until we share our new 1H chart idea on our Sunday update.
We will continue to buy dips using our support levels taking 30 to 40 pips. As stated before each of our level structures give 20 to 40 pip bounces, which is enough for a nice entry and exit. If you back test the levels we shared every week for the past 24 months, you can see how effectively they were used to trade with or against short/mid term swings and trends.
BULLISH TARGET
2645 - DONE
EMA5 CROSS AND LOCK ABOVE 2645 WILL OPEN THE FOLLOWING BULLISH TARGET
2661 - DONE
EMA5 CROSS AND LOCK ABOVE 2661 WILL OPEN THE FOLLOWING BULLISH TARGET
2679 - DONE
EMA5 CROSS AND LOCK ABOVE 2679 WILL OPEN THE FOLLOWING BULLISH TARGET
2697 - DONE
As always, we will keep you all updated with regular updates throughout the week and how we manage the active ideas and setups. Thank you all for your likes, comments and follows, we really appreciate it!
Mr Gold
GoldViewFX

EURO - Price can break resistance level and continue to riseHi guys, this is my overview for EURUSD, feel free to check it and write your feedback in comments👊
Some days ago price traded inside flat, where it declined to resistance area and then rose to top part of flat.
Also, when price rose to top part of flat, EUR made a first gap and then made downward impulse.
Price exited from flat and continued to decline inside falling channel, where it broke $1.0760 level and continued to fall.
Later price reached $1.0520 level, some time traded near, and then declined to $1.0335 points, exiting of falling channel.
Euro started to grow inside rising channel, where it made a second gap and some time traded between $1.0520 level.
Now price trying to break $1.0520 level, and I think it can break it and continue to grow to $1.0720 in channel.
If this post is useful to you, you can support me with like/boost and advice in comments❤️

Hellena | EUR/USD (4H): Long to Resistance area 1.06898.Dear Colleagues, I see a continuation of the upward movement in the coming week.
I believe that wave “1” and wave “2” of the higher order have been completed. Wave “2” of the lower order is either already completed or will be completed soon. I expect that either from the current positions or from the area of 1.04850 the price will start an upward movement to the resistance area of 1.06898.
Manage your capital correctly and competently! Only enter trades based on reliable patterns!

Will PPI add fuel to the fire?Buyers reenter the daily S&P 500 market on Wednesday based on CPI data. Now will PPI data be able to add fuel to the fire and continue this market higher the objective is 6120.

Hellena | GOLD (4H): Long to resistance area of 2717.733.Colleagues, the previous forecast is still active, but I decided to make a new one to show in more detail what exactly is going on.
I believe that the price is in a five-wave upward movement and now we are expecting a lower and middle-order wave “3”.
Therefore, I believe that the upward movement will continue and the price will reach the level of 2717.733.
Manage your capital correctly and competently! Only enter trades based on reliable patterns!

MANAUSD a 1-year parabolic rally is starting. DON'T MISS IT!Decentraland (MANAUSD) almost touched its 1W MA200 (orange trend-line) last week, following the bullish break-out above the Bear Cycle's Lower Highs trend-line 3 weeks ago. This is the last confirmation it needs before it validates the Cycle's parabolic rally as the 1W MA200 was were the price was rejected on March 04 2024.
This sequence resembles the bullish break-out pattern of August 03 2020 that also turned the 1W MA50 (blue trend-line) into Support and after a consolidation, by late December 2020 it initiated the parabolic rally.
This rally rose by +3390% before the first correction back to the 1W MA50, so if MANA continues to repeat that previous Cycle, it can rise as high as $18 before it corrects. The 1W RSI sequences between the two fractals also highlight their striking resemblance, as both are rising on Higher Highs on a Bullish Divergence against the price's Lower Highs.
-------------------------------------------------------------------------------
** Please LIKE 👍, FOLLOW ✅, SHARE 🙌 and COMMENT ✍ if you enjoy this idea! Also share your ideas and charts in the comments section below! This is best way to keep it relevant, support us, keep the content here free and allow the idea to reach as many people as possible. **
-------------------------------------------------------------------------------
💸💸💸💸💸💸
👇 👇 👇 👇 👇 👇

Maximize Your Portfolio with Baby Doge Coin for More GainHello and greetings to all the crypto enthusiasts, ✌
In several of my previous analyses, I have accurately identified and hit all of the gain targets. In this analysis, I aim to provide you with a comprehensive overview of the future price potential for Baby Doge Coin , 📚💣
The potential for Baby Doge Coin to experience significant growth is largely driven by its association with influential figures, notably Elon Musk. The strength and engagement of a coin's community directly impact its market interest and overall traction. Given recent trends in the coin’s chart and trading volume, I anticipate a price increase of at least 55% . 📚✌
Moreover, technical analysis indicates that the next support level, as identified by the Fibonacci retracement, suggests a strong foundation for continued upward momentum. This confluence of factors positions Baby Doge Coin for further growth. 📚🚀
The growing interest from both individual and institutional investors adds to its potential for long-term gains. As the market evolves, Baby Doge Coin appears well-positioned to capitalize on these dynamics. 📚🎇
🧨 Our team's main opinion is: 🧨
Baby Doge Coin's growth is driven by its connection to Elon Musk and a strong community, boosting market interest. With a projected 55% gain.
Thank you for your attention. If you have any questions or comments, I’m here to respond to you. 🐋💡

HelenP. I Bitcoin will break support level and fall to 98$Hi folks today I'm prepared for you Gold analytics. Some time ago, the price declined to support 2, which coincided with support zone, and some time traded between this level. After this, BTC later made a strong impulse up, breaking support 2, which coincided with the resistance zone and even rose a little higher. But soon, it turned around and made a strong impulse down to the trend line, breaking two support levels. Later, the price backed up, breaking support 2, and even rose to the resistance zone, after which some time traded below this area. Next, it declined to the support zone, which coincided with the trend line, and then rebounded and in a short time rose to the resistance zone, breaking support 1. At the moment, price trades inside the resistance zone in a triangle pattern, so, I expect that BTCUSDT will make movement up to the resistance line of this pattern. Next, it turned around and started to decline, breaking the support level, therefore I set my goal at 98000 points. If you like my analytics you may support me with your like/comment ❤️

$HIMS UPDATE! You asked, I delivered! 60% UpsideNYSE:HIMS UPDATE! You asked, I delivered! 60% Upside
In this video, we will discuss:
-Why NYSE:HIMS is pulling back this week
-Short/Long-term targets
-What the H5 and WCB strategies are telling us
-and more...
NFA
Check it out!

Bitcoin - Time to buy again!After this heavy drop, BITCOIN has now formed an ascending triangle in the 1-h time frame, which could be a sign of a bullish trend. Please note that this analysis is in the 1-h time frame.
Give me some energy !!
✨We spend hours finding potential opportunities and writing useful ideas, we would be happy if you support us.
Best regards CobraVanguard.💚
_ _ _ _ __ _ _ _ _ _ _ _ _ _ _ _ _ _ _ _ _ _ _ _ _ _ _ _ _ _ _ _
✅Thank you, and for more ideas, hit ❤️Like❤️ and 🌟Follow🌟!
⚠️Things can change...
The markets are always changing and even with all these signals, the market changes tend to be strong and fast!!

RIPPLE (XRPUSDT): Your Trading Plan to BuyFollowing a recent bearish movement, 📈XRP corrected to a significant support level that was previously broken.
Look out for a bullish flag pattern on the 4-hour chart for potential buying opportunities based on the current trend.
Confirmation of a potential upward movement will be a candle closing above the resistance level of the bullish flag
Once this occurs, consider buying the coin with the expectation of it reaching at least the 2.91 level.

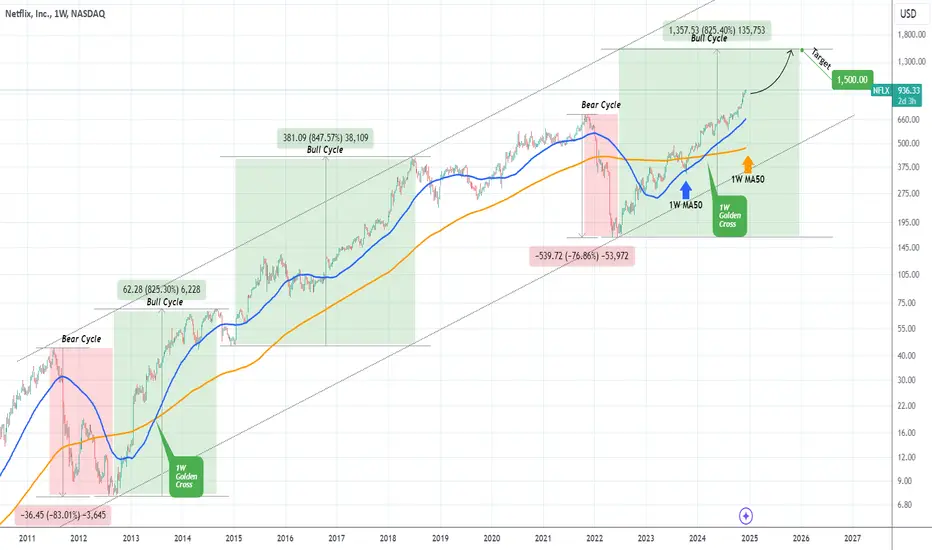
NETFLIX historic pattern targets $1500 in 2025.Last time we looked at Netflix (NFLX) was on its earnings release (October 21, see chart below), when we gave a strong bullish signal that easily hit our $840.00 Target:
Since 3 week ago, the price even broke above the dominant 1-year Channel Up and is now in search of a new pattern. This pattern can be found if we zoom out considerably on the 1W time-frame, where the underlying pattern since the U.S. Housing Crisis is a 25-year Channel Up.
The symmetry within this pattern is high and in fact since the June 2022 market bottom (which was a Higher Low on the Channel Up), the stock has been on a Bull Cycle. The Bear Cycle that preceded it had a massive decline of -77%. The last correction of this magnitude was the July 2011 - August 2012 Bear Cycle, which declined by -83%.
The two Bull Cycles that followed Netflix's golden years were identical (+825% and +847%). As a result, we assume that the current Bull Cycle will also rise by at least +825% from its bottom, which gives us a $1500 Target towards the end of 2025.
Notice also how both the 2012 - 2014 and 2022 - 2024 Bull Cycles had a 1W Golden Cross.
-------------------------------------------------------------------------------
** Please LIKE 👍, FOLLOW ✅, SHARE 🙌 and COMMENT ✍ if you enjoy this idea! Also share your ideas and charts in the comments section below! This is best way to keep it relevant, support us, keep the content here free and allow the idea to reach as many people as possible. **
-------------------------------------------------------------------------------
💸💸💸💸💸💸
👇 👇 👇 👇 👇 👇
Gold Supported by Fundamentals, Testing Key Technical ResistanceTechnical Analysis
Gold is trading at $2,719, approaching a critical resistance level at $2,735 (Fib 0.786). A breakout above this resistance could pave the way for further upside toward $2,743 and $2,758, marking significant levels for long-term trend continuation. On the daily chart, the price has held firmly above the 50-day SMA, supported by a bullish RSI, indicating the potential for continued strength.
- Key Resistances :
- $2,735 (Fib 0.786).
- $2,743 and $2,758.
- Key Supports :
- $2,700 (short-term support).
- $2,693 (Fib 0.618).
In the short term, gold has encountered resistance at $2,720 and shows signs of a possible pullback. The RSI in the overbought zone suggests that a correction toward $2,700 and potentially $2,693 is likely before any continuation to the upside.
---
Fundamental Analysis
Gold prices remain near two-week highs, supported by geopolitical tensions, central bank buying, and expectations for the Federal Reserve's (Fed) monetary policy. Markets are now pricing a 95% chance of a 25 bps rate cut by the Fed next week , per the CME FedWatch tool, with a further 22% chance of another cut in January.
Key Developments Driving Gold:
1. Chinese Central Bank Gold Buying:
The People's Bank of China resumed gold purchases in November, adding 160,000 fine troy ounces to its reserves. This significant move has bolstered global gold demand and added upward momentum to prices.
2. Middle East Geopolitical Tensions:
The collapse of the Syrian government and subsequent military actions by Israel have increased investor interest in gold as a safe-haven asset.
3. US Inflation Data (CPI):
November's CPI data showed a 2.7% YoY increase, aligning with expectations and reinforcing the case for rate cuts. The core inflation rate remained stable at 3.3%. These figures have kept gold's bullish momentum intact.
---
Upcoming Data to Watch
The Producer Price Index (PPI) for the US, scheduled for release tomorrow, will provide further clues about inflation trends.
- Forecasts:
- Core PPI m/m: 0.2% (previous: 0.3%).
- PPI m/m: 0.2% (previous: 0.2%).
- Unemployment Claims: 221K (previous: 224K).
Potential Scenarios for PPI:
1. Stronger-than-expected PPI (above 0.2%):
Higher PPI could indicate persistent inflationary pressures, potentially boosting the US Dollar and pressuring gold prices lower. In this case, gold may test short-term supports at $2,700 or $2,693.
2. Weaker-than-expected PPI (below 0.2%):
A weaker PPI could further strengthen the case for Fed rate cuts, weakening the US Dollar and providing additional upside for gold. A breakout above $2,735 would open the path toward $2,743 and $2,758.
---
Conclusion
Gold remains strong in the long term, with $2,735 as a critical resistance level. A breakout above this level could trigger a rally to $2,743 and $2,758. However, in the short term, the price is expected to correct to $2,700 or $2,693 before resuming its uptrend. The upcoming PPI report is pivotal and will shape market sentiment ahead of the Fed's rate decision next week.
Recommendation
Monitor the PPI report and Fed commentary closely. A pullback to $2,700 may offer a buying opportunity, with targets set at $2,743 and $2,758 if bullish momentum persists.

GBP-USD Bearish Wedge Breakout! Sell!
Hello,Traders!
GBP-USD is trading in a
Downtrend and the pair
Broke out of the bearish
Wedge pattern and the
Breakout is confirmed
So we will be expecting
A further move down
Sell!
Comment and subscribe to help us grow!
Check out other forecasts below too!
