GOLD Trending Higher - Can buyers push toward 3,238?OANDA:XAUUSD is trading within a well-defined ascending channel, with price action consistently respecting both the upper and lower boundaries. The recent bullish momentum indicates that buyers are in control, suggesting a potential continuation.
The price has recently broken above a key resistance zone and may come back for a retest. If this level holds as support, it would reinforce the bullish structure and increase the likelihood of a move toward the 3,238 target, which aligns with the channel’s upper boundary.
As long as the price remains above this support zone, the bullish outlook stays intact. However, a failure to hold above this level could invalidate the bullish scenario and increase the likelihood of a pullback toward the channel’s lower boundary.
Remember, always confirm your setups and trade with solid risk management.
Best of luck!
Parallel Channel

GOLD → It all depends on NFP and Powell....FX:XAUUSD got shaken by 600 pips on both sides. Technically, after such a move the price may go into consolidation, but the near-term outlook will depend on NFP and Powell.
Gold hit a high of 3168 and went into correction. President Trump's imposed duties on imports from China (up to 54%) and other countries caused a sharp drop in the dollar and bond yields, reinforcing expectations of a Fed rate cut. Traders turned to profit-taking, which led to a correction. Now the market is waiting for the NFP report and Powell's speech. Weak data may return the upward momentum to gold, especially if the dovish rate expectations are confirmed. However, volatility may persist after the publication, given the impact of Friday's flows and Powell's speech
Resistance levels: 3107, 3116, 3135
Support levels: 3086, 3067, 3055
Technically, it is difficult to determine a clear place from where to expect a move as there is news ahead (NFP, Powell's speech). But based on the falling dollar and high economic risks, we can bet on the continuation of the price growth from one of the mentioned support levels: 3086, 3067, 3055.
Exit from the channel and consolidation of the price above 3110 - 3116 will again attract increased interest in buying
Regards R. Linda!

Bitcoin Faces a "Resistance Lines WALL" – Breakout or Breakdown?Bitcoin ( BINANCE:BTCUSDT ) started to rise as I expected in my previous post and hit all targets . Will Bitcoin continue the upward trend of the past two days!?
Please stay with me.
First of all, I have to say that Bitcoin is facing a Wall of Resistance lines ( intersection of at least 4 Resistance lines ). Do you think Bitcoin can easily break these resistance lines with a single attack?
Bitcoin is trading near the Resistance zone($87,520_$85,840) , Potential Reversal Zone(PRZ) , and a Series of Resistance lines .
In terms of the Elliott Wave theory , Bitcoin appears to have completed Corrective waves . The corrective wave structure in the Ascending Channel is a Double Three Correction(WXY) .
I expect Bitcoin to drop to $85,000 in the first step in the coming hours. The Second target is $84,333 , and if the Support zone($84,430_$83,170) is broken, we should wait for the CME Gap($80,760_$80,380) to fill.
Do you think Bitcoin can break the wall of the Resistance lines, or will it start declining again?
Note: Donald Trump's speeches over the next hours could also affect the market, so trade a little more cautiously during this hour.
Trump’s Speech & Potential Tariffs
In today’s speech, Trump is expected to discuss new tariffs on imports from China, Mexico, and Canada, possibly ranging from 20-25%. If confirmed, this could impact global markets, strengthen the USD, and increase economic uncertainty.
Note: If Bitcoin touches $89,000, we should most likely expect more pumping.
Please respect each other's ideas and express them politely if you agree or disagree.
Bitcoin Analyze (BTCUSDT), 4-hour time frame.
Be sure to follow the updated ideas.
Do not forget to put a Stop loss for your positions (For every position you want to open).
Please follow your strategy and updates; this is just my Idea, and I will gladly see your ideas in this post.
Please do not forget the ✅' like '✅ button 🙏😊 & Share it with your friends; thanks, and Trade safe.


GOLD → Correction. Liquidity is the target. News aheadFX:XAUUSD on the background of yesterday's news reaches the target of 3166 and enters the phase of deep correction on the background of profit-taking. The level of economic risks is still high
Despite the pullback, the gold price retains much of its recent record high, thanks to rising risks of a global trade war and a US recession.
Gold corrects from record $3,168 but remains strong amid trade and recession risks. The correction is due to the following nuances: Profit taking ahead of key US jobs data. Waiting for jobless claims and services PMI.
But, Trump's new tariffs, a weaker dollar and lower bond yields are driving gold buying.
Resistance levels: 3116, 3135
Support levels: 3107, 3097
Against the background of high economic risks, falling dollar index, gold still has chances to continue its growth. False breakdown of support may give such a chance.
Regards R. Linda!

Bitcoin may continue grow inside upward channel to seller zoneHello traders, I want share with you my opinion about Bitcoin. Looking at the chart, we can observe how Bitcoin corrected down to the support level, which also aligned with the buyer zone. From there, the price started to rise. It didn’t take long for BTC to reach the resistance level, which matched up with the seller zone. After breaking through that level, the price began consolidating within a range. Throughout this range, Bitcoin tested the upper boundary several times, but on the last attempt, it reversed and began to decline. The drop continued until it broke through the 86500 level, effectively exiting the range and pushing lower toward the next support. Once the price reached that area, it broke below the level and even dipped under the buyer zone, but quickly reversed and started climbing within an ascending channel. Inside this channel, BTC pushed up to the 83500 level, broke through it again, and maintained bullish momentum. At the moment, Bitcoin is trading within the channel, and I anticipate a potential correction back to the lower boundary of the channel, followed by continued growth toward the seller zone and a break of the resistance. For this scenario, my target is set at 87000 points. Please share this idea with your friends and click Boost 🚀

BITCOIN - Price can correct to support area and rise to $86000Hi guys, this is my overview for BTCUSDT, feel free to check it and write your feedback in comments👊
Some days ago, the price moved inside rising channel and then made breakout, reaching upper resistance area.
After that, Bitcoin dropped sharply and entered a flat pattern between support and resistance boundaries.
It tested $82300 support level several times, bouncing from this zone without a clear downward breakout.
Recently, the price again touched the support area between $82300 and $81500 and bounced from this demand zone.
Now BTC trades near the middle of the flat and shows signs of strength after holding a support area.
In my opinion, Bitcoin can rise from current range and reach $86000 resistance level in the next move.
If this post is useful to you, you can support me with like/boost and advice in comments❤️

HelenP. I Euro will rise a little and then drop to support levelHi folks today I'm prepared for you Euro analytics. After breaking the structure of the previous downtrend, Euro showed a powerful bullish impulse, which allowed the price to exit the downward channel and move confidently higher. This breakout was supported by the trend line, which began to act as dynamic support throughout the rise. The bullish movement reached a local high near the 1.11 area before losing momentum. Soon after reaching that high, the price began to decline, pulling back to the area of the trend line and testing the support zone between 1.0950 and 1.0970. This zone aligns with Support 1 at the 1.0950 level and was already tested multiple times in recent price action. Although the trend line provided some temporary support, the strength of buyers has clearly faded. Currently, EUR/USD is trading just above the trend line, but price action suggests pressure is shifting back to the downside. Given the rejection from higher levels and the repeated tests of support, I expect the pair to decline further toward the 1.0950 target — my current goal. If you like my analytics you may support me with your like/comment ❤️

LTC - Bulls Getting Ready!Hello TradingView Family / Fellow Traders. This is Richard, also known as theSignalyst.
📈 Long-term, LTC has been overall bullish, trading within the rising channel marked in red.
📍 As it retests the lower bound of the channel — perfectly intersecting with the blue support—I will be looking for medium-term longs.
🚀 For the bulls to take over long-term and initiate the next bullish phase, a breakout above the last major high marked in orange at $97 is needed.
📚 Always follow your trading plan regarding entry, risk management, and trade management.
Good luck!
All Strategies Are Good; If Managed Properly!
~Rich

GOLD → Consolidation. News. False breakdown. Growth?FX:XAUUSD and TVC:DXY in consolidation ahead of important news and Trump's speech. Economic risks are rising and the future outlook depends on fundamental data...
Trade tensions support gold demand. Trump may impose global tariffs of up to 20% which will increase risks to the economy. Investors are piling into gold in anticipation, pushing its price to a record $3,150
A key factor is the details of the tariffs. If tariffs are softer than expected, gold could fall to intermediate support zones. If the trade war escalates, the rise could continue beyond 3150
Economic risks are rising and gold may test 3107 - 3100 support before rising further. Technically, 3100 - 3107 is a zone of interest and liquidity. If bulls hold the support, gold will continue to rise. Otherwise, gold may form a correction towards 3075 - 3065
Resistance levels: 3126, 3135, 3147
Support levels: 3107, 3100, 3091
The price is correcting to consolidation support in the moment. A strong and sharp fall is fraught with the risk of a liquidity grab and a false breakdown. In this case, gold may strengthen to one of the key resistances. But the further and medium-term development of events depends on the evening news....
Regards R. Linda!

GOLD - Price can decline to support area and then start to growHi guys, this is my overview for XAUUSD, feel free to check it and write your feedback in comments👊
Some time ago price traded inside a flat pattern, where it moved between support and resistance levels.
Then gold made fake breakout to the downside, but soon returned back and started to grow strongly.
It broke the upper line of the flat and entered a rising channel, forming a steady bullish movement.
Later price touched $3160 resistance and bounced down, making correction to $3070 support area.
Now gold trades inside rising channel and near $3070 level, showing signs of slowing the decline.
In my opinion, gold can bounce from support and reach $3160 resistance as the next upward target.
If this post is useful to you, you can support me with like/boost and advice in comments❤️

DOGEUSDT from two major daily supports can pumpAs we can see two major daily supports now are ahead:
A. 0.135$
B. 0.090$
We are looking for rise and pump from these supports so we set our buy pending and still watching chart also remember because of breakout to the upside here pump may start sooner.
DISCLAIMER: ((trade based on your own decision))
<<press like👍 if you enjoy💚

BTC sign of weakness & more drop coming BTC Struggles to Break Trendline Resistance: Signs of Weakness on 1D Timeframe
Bitcoin is currently facing strong resistance on the daily (1D) timeframe, struggling to break above the trendline. This indicates potential weakness, with BTC showing signs of a downside move towards the $70K–$75K range. While we cannot pinpoint an exact support level, this zone serves as a potential drop area. Additionally, a sharp wick could extend lower, possibly touching $69K or even FWB:67K , as liquidity is swept from below before a potential recovery.
On the bullish side, a bullish RSI divergence is forming, which suggests that sooner or later, BTC could experience a strong upward move. This could lead to a significant rally in the market.
Given the current market structure, it’s a good time to position yourself in high-quality utility projects rather than meme coins. Focusing on fundamentally strong assets can lead to massive gains in the next bullish phase. Stay strategic, manage your risk, and be prepared for future opportunities.

Gold Wave Analysis – 4 April 2025
- Gold broke daily up channel
- Likely to fall to support level 3000.00
Gold recently reversed down from the resistance level 3150.00 (which formed the daily Bearish Engulfing) and broke the sharp daily up channel from February.
The breakout of this up channel added to the bearish pressure on Gold – accelerating the active downward correction to the higher-order impulse wave (3) from November.
Gold can be expected to fall to the next round support level 3000.00 (which stopped the previous short-term correction iv).

EOSUSDT → False Breakeout of resistance (counter-trend )BINANCE:EOSUSDT.P within the consolidation distribution 0.54 - 0.6 reaches the key resistance and forms a false breakdown without the possibility of continued growth.
The cryptocurrency market is showing weakness, especially after yesterday's Trump speech and the approval of new Tariffs, which creates risks and pressure on the cryptocurrency market. Bitcoin is back in the red zone after rallying, while altcoins will continue to look for a new bottom. EOS stands out in this list, which strengthened quite strongly and the purpose of this maneuver was countertrend accumulation and liquidity capture relative to the range of 0.7 - 0.8. The distribution is tempered by a false breakout of the level 0.82 - 0.86
Resistance levels: 0.82, 0.86
Support levels: 0.793, 0.666
If the bears hold the resistance 0.82 - 0.86 and the consolidation under the level will end with the breakout of the trigger 0.793 and price consolidation in the selling zone, it may provoke a reversal and fall to the zones of interest: fvg, 0.64, 0.541.
Regards R. Linda!

SEI/USDT:BUY LIMITHello dear friends
Given the price drop we had in the specified support range, the price has been able to create higher ceilings and floors.
Now, given the good support of buyers for the price, we can buy in steps with capital and risk management and move towards the specified goals.
*Trade safely with us*

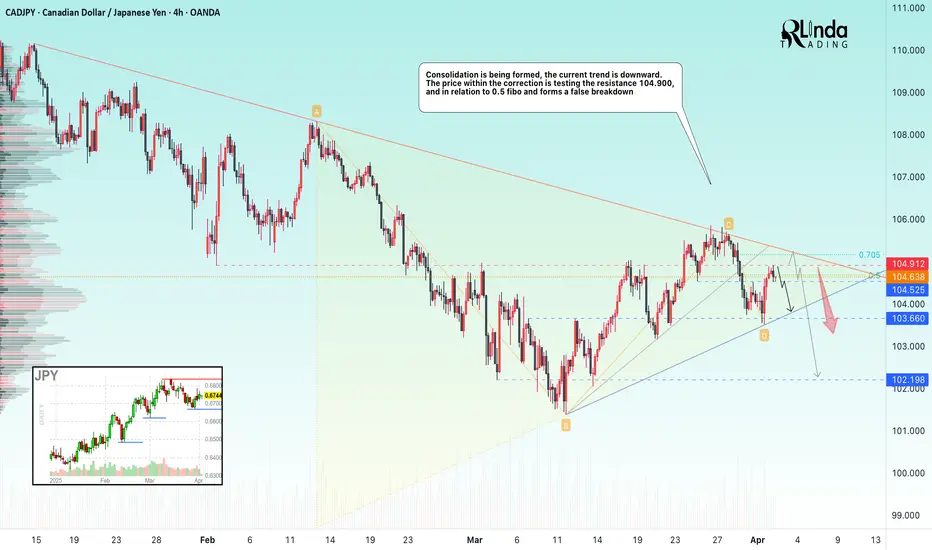
CADJPY → Consolidation before the news. DowntrendFX:CADJPY continues to forge a downtrend, but within the current movement a symmetrical triangle of accumulative nature is forming
The currency pair may continue its decline due to the strengthening of the Japanese Yen, while the Canadian is consolidating in a narrow range.
The situation may be accelerated by today's news, namely Trump's speech, where he may announce new tariff measures.
Technically, the price is correcting after the false break of 103.56, being below the previously broken upside support. Price is testing key resistance at 104.90, and against 0.5 Fibo is forming a false breakout. A consolidation below 104.69, a break of 104.525 could trigger further decline.
Resistance levels: 104.900, 105.36, 105.74
Support levels: 104.525, 103.56
There are important news ahead, high volatility is possible, especially at the moment of Trump's speech, which may set a medium-term tone in the market.
The currency pair is in consolidation on the background of the downtrend and the priority is to expect a continuation of the fall
Regards R. Linda!
AUDJPY - Follow The Bears!Hello TradingView Family / Fellow Traders. This is Richard, also known as theSignalyst.
📈AUDJPY has been bearish trading within the falling channel in red.
Currently, AUDJPY is approaching the upper bound of the channel.
Moreover, it is retesting a strong structure marked in orange.
🏹 Thus, the highlighted red circle is a strong area to look for sell setups as it is the intersection of the structure and upper red trendline.
📚 As per my trading style:
As #AUDJPY is around the red circle zone, I will be looking for bearish reversal setups (like a double top pattern, trendline break , and so on...)
📚 Always follow your trading plan regarding entry, risk management, and trade management.
Good luck!
All Strategies Are Good; If Managed Properly!
~Rich
Disclosure: I am part of Trade Nation's Influencer program and receive a monthly fee for using their TradingView charts in my analysis.

US500 CHANNELHello friends
Given that the price is in an ascending channel, now that we have a strong wave to the channel ceiling, we have corrected the price by 50%, after which we can expect the price to succeed in hitting a higher ceiling again.
*Trade safely with us*

CRV/USDT: BUYHello dear friends
Due to the good price growth
Now we can buy in stages with capital and risk management and move towards the specified goals.
*Trade safely with us*

Bitcoin Wave Analysis – 3 April 2025
- Bitcoin reversed from resistance level 87785.00
- Likely to fall to support level 78650.00
Bitcoin cryptocurrency recently reversed down from the resistance level 87785.00 (which stopped wave A at the end of March), intersecting with the daily down channel from January and the upper daily Bollinger Band.
The downward reversal from the resistance level 87785.00 will form the daily Japanese candlesticks reversal pattern Evening Star – if the price closes today near the current levels.
Bitcoin cryptocurrency can be expected to fall to the next support level 78650.00 (which has been reversing the price from February).

GOLD - New All-Time High Again? Where Will This End? Current Price Action:
Gold (XAUUSD) has reached another record high at 3,175.06 on the 4-hour chart, showing strong bullish momentum. The price is currently hovering around 3,127.07 after a minor pullback from the peak.
Key Levels:
Resistance: The all-time high at 3,175.06 is now the key level to watch. A break above could signal continuation of the rally.
Support: Immediate support sits at 3,127.20, with 3,150.00 acting as additional support. A drop below 3,127 could indicate a deeper correction.
Market Context:
The repeated tests of new highs suggest strong buying pressure, though the recent pullback shows some profit-taking. The 3,150 level has flipped from resistance to support, which is a bullish sign.
Trading Considerations:
- Long positions may consider entries near 3,127-3,150 with stops below 3,120, targeting 3,175 and beyond
- Short-term traders might watch for rejection at 3,175 for potential reversal plays
- The overall trend remains strongly bullish, but extended moves often see sharp corrections
Volume and Momentum:
The current pullback appears on relatively low volume, suggesting this may be a temporary pause rather than a trend reversal.
Final Thoughts:
Gold continues its historic rally with no clear resistance in sight. While the trend favors buyers, traders should remain cautious of potential profit-taking at these elevated levels.
Disclaimer: This analysis is for informational purposes only and not investment advice. Always conduct your own research before trading.

BTC DOMINANCE in Rising wedge Pattern BTC Dominance Showing Signs of Weakness – Altseason Incoming?
BTC dominance is finally topping out, displaying clear signs of weakness. Rising wedge Pattern forming on weekly time frame which is also bearish. Despite reaching new highs, momentum appears to be fading, with bearish RSI divergence further confirming the exhaustion. All indicators point towards an imminent breakdown in BTC dominance, potentially triggering a long-awaited Altseason in the coming days. Stay prepared for major moves in the altcoin market!
1. Weakness in the uptrend =Bearish
2. Rising wedge Pattern = Bearish
3. RSI divergence on weekly = Bearish
All things indicating towards upcoming Bearish trend for BTC Dominance.
What do you think share your thoughts in the comments.
🚀 🚀 🚀 🚀
This is not a Financial Advise

Nikkei 225 Wave Analysis – 4 April 2025
- Nikkei 225 broke support zone
- Likely to fall to support level 30600.00
The Nikkei 225 index recently broke the support zone located at the intersection of the support level 35000.00 (former monthly low from September) and the support trendline of the daily down channel from January.
The breakout of this support zone accelerated the active downward impulse wave 3 of the higher-order impulse wave (C) from January.
The Nikkei 225 index can be expected to fall to the next support level 30600.00 (former major support from August of 2024).
