CADJPY - Following The Bulls!Hello TradingView Family / Fellow Traders. This is Richard, also known as theSignalyst.
📈 CADJPY has been overall bullish , trading within the rising channel marked in red.
Currently, CADJPY is undergoing a correction phase.
Moreover, it is retesting massive support zone in green.
🏹 Thus, the hi
About Canadian Dollar / Japanese Yen
The Canadian Dollar vs. the Japanese Yen. When a trader is unsure about trading the US Dollar, the CADJPY is often determined to be a suitable replacement. However, the historically higher yield of the Canadian dollar in the past has made the CADJPY more sensitive to market wide sentiment changes than the USDJPY. Also, Canada’s large amount of energy exports, most notable oil, causes it to be affected by crude oil prices.

CADJPY: Bullish Pinbar candle could push CADJPY higher againCADJPY: Bullish Pinbar candle could push CADJPY higher again
Technical Analysis:
Price created a "Bullish Pinbar Canle" on a daily time frame thus indication for a lose in
the bearish momentum.
On the 60 minute chart, we can see that CADJPY is forming an "Inverse Head & Shoulder" pattern.
A

CADJPY Short Term Sell IdeaH4 - Bearish convergence
Currently it looks like a pullback is happening.
H1 - Bearish trend pattern followed by a pullback
Until the strong resistance zone holds I expect the price to move lower further in the short term.

CADJPYCADJPY price is near the support zone. 113.559-113.216 If the price cannot break through the 113.216 level, it is expected that in the short term there is a chance that the price will rebound. Consider buying a red zone.
>>GooD Luck 😊
❤️ Like and subscribe to never miss a new idea!
*Always follow

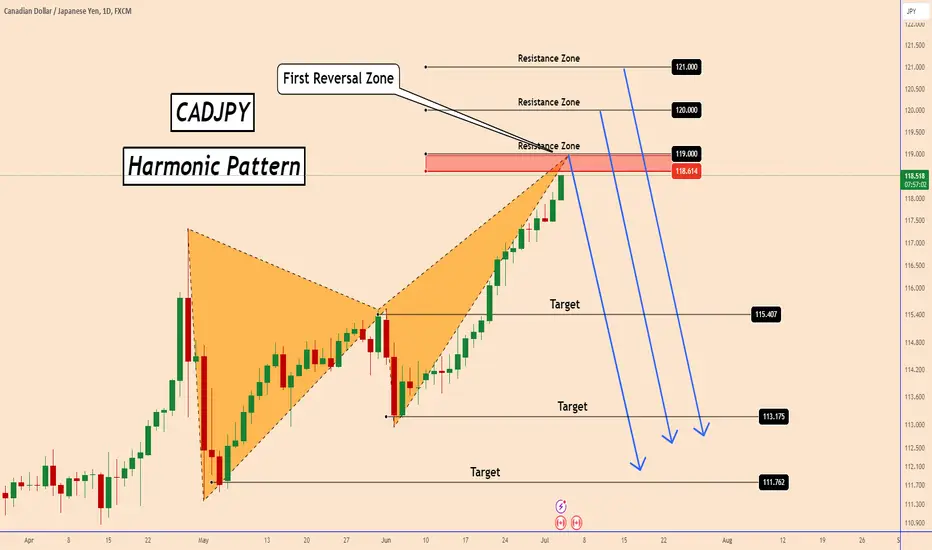
CADJPY: Three Potential Reversal Areas to Focus onCADJPY: Three Potential Reversal Areas to Focus on
CADJPY is about to complete a harmonic bearish pattern near 190.00
This strong psychological zone also corresponds to the completion of the pattern.
if the price crosses 190.00 , then two other possible retracement zones are 120.00 and 121.00
A
Heading into 38.2% Fibonacci resistance?CAD/JPY is rising towards the pivot and could potentially reverse from this level to the 1st support.
Pivot: 115.50
1st Support: 113.82
1st Resistance: 116.23
Risk Warning:
Trading Forex and CFDs carries a high level of risk to your capital and you should only trade with money you can afford to

CADJPY Technical Analysis and Trade Idea 👉🔍 In this video, we analyze CADJPY. It's evident that CADJPY has been showing bearish momentum recently. However, I anticipate a retracement as it has traded into a key support level. My strategy involves monitoring the 15-minute and 5-minute charts for signs of a retrace, sideways movement, and a

CADJPY ShortTechnicals
Trend : Bearish (printing LL and LH)
Continuation Pattern : Bearish flag
Bias :Bearish
Scenario Details : Take entry on breakout of Flag
Fundamentals:
JPY : Strong
CAD : Weak
for educational purpose only

eye on the Factors Behind Long CADJPY: A Detailed ExplorationTechnical Outlook:
According to the technical outlook for CADJPY, the current trend is bullish, and the sentiment is oversold based on the 7-period RSI indicator .
The market is approaching a significant support area at 115.742, which indicates a highly probable bullish movement .
Another technical

BUY CAD/JPYAttention Traders!
Here's an exciting trade setup for the CAD/JPY currency pair. This opportunity involves a buy trade with a well-defined entry range and profit targets to maximize your potential gains.
Trade Details:
Buy Range : Enter the trade when the price is between 114.88 and 114.90 .

See all ideas
Trade directly on the supercharts through our supported, fully-verified and user-reviewed brokers.


Related symbols
Frequently Asked Questions
The current rate of CADJPY is 111.076 JPY — it has decreased by 0.17% in the past 24 hours. See more of CADJPY rate dynamics on the detailed chart.
The value of the CADJPY pair is quoted as 1 CAD per x JPY. For example, if the pair is trading at 1.50, it means it takes 1.5 JPY to buy 1 CAD.
The term volatility describes the risk related to the changes in an asset's value. CADJPY has the volatility rating of 1.13%. Track all currencies' changes with our live forex heatmap and prepare for markets volatility.
The CADJPY showed a 3.21% fall over the past week, the month change is a 5.31% fall, and over the last year it has increased by 5.37%. Track live rate changes on the CADJPY chart.
Learn how you can make money on rate changes in numerous trading ideas created by our community.
Learn how you can make money on rate changes in numerous trading ideas created by our community.
CADJPY is a minor currency pair, i.e. a popular pair that is not associated with USD. Such pairs are also called cross currency pairs.
Currencies are usually traded through forex brokers — choose the one that suits your needs and go ahead. You can trade CADJPY right from TradingView charts — just log in to you broker account. Check out the list of our integrated brokers and find the best one for your needs and strategy.
When deciding to buy or sell currency one should keep in mind many factors including current geopolitical situation, interest rates, and other. But before plunging into a deep research, you can start with CADJPY technical analysis. The technical rating for the pair is sell today, but don't forget that markets can be very unstable, so don't stop here. According to our 1 week rating the CADJPY shows the sell signal, and 1 month rating is buy. See more of CADJPY technicals for a more comprehensive analysis.