Bitcoin Dominance Theory: Why It May Shrink More Than EverBitcoin dominance — the percentage of total crypto market cap held by BTC — has followed a fascinating evolution, each cycle telling a different story.
2017: The Altcoin Wild West
In early 2017, BTC dominance was a whopping 96%, but it plummeted to 35% by the peak of the bull run. Why?
Back then,
Key data points
Previous close
60.49
Open
60.48
Day's range
60.47 — 60.85
About Market Cap BTC Dominance, %
Coin
On crypto market, a coin dominance is a ratio of its market cap to cumulative market cap of cryptocurrencies. It's a great way to see how big a coin is relative to the whole crypto market — the value of everything is in comparison. It's calculated by dividing a coin market cap by the overall market cap of the top 125 coins and then multiplying it by 100. The result of these calculations and how it changes over time you can see on the dominance chart — calculated for you by TradingView.
No news here
Looks like there's nothing to report right now

BTCD Bear Market Confirmed · Altcoins Bull Market ConfirmedThis is a rising wedge pattern and it broke for the first time after 792 days. We are looking at Bitcoin Dominance (BTC.D) on the monthly timeframe, super long-term.
A classic long-term double-bottom in 2022 launched a massive uptrend. This uptrend developed within a perfect rising wedge. Last mont


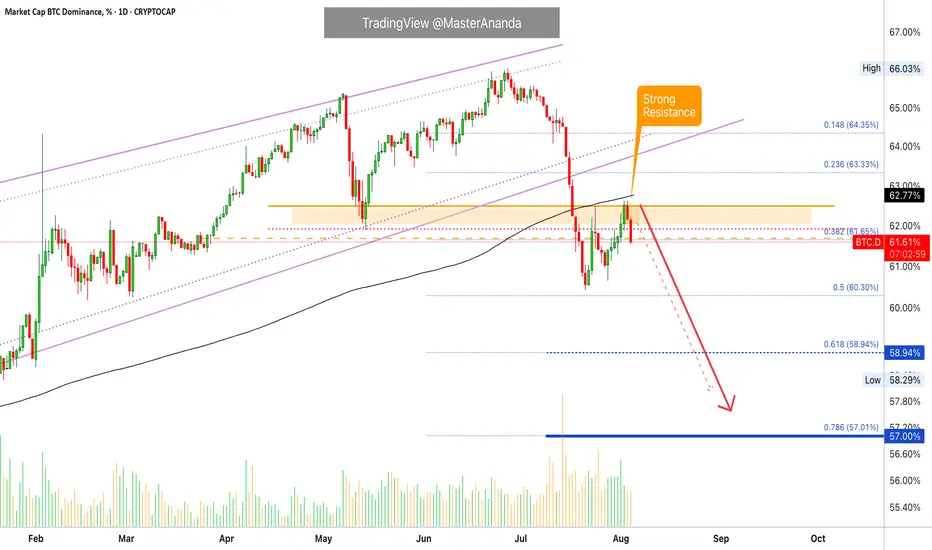
Bitcoin Dominance Update · Daily TimeframeThe rejection is happening right at "strong resistance." Notice that this is the same drawing from my previous update so it was drawn before the fact. Since resistance has been confirmed and the action is happening just as we expected, we can continue to follow our map as it is working.
The next lo
BTC.D , Bitcoin Dominance Ready to RiseAfter a descending wedge pattern, Bitcoin Dominance has shown the first signs of an upward move. A CHoCH (Change of Character) has formed on the 4-hour timeframe, signaling a potential trend reversal.
We are now awaiting a retest of the broken resistance level before continuation of the bullish tre

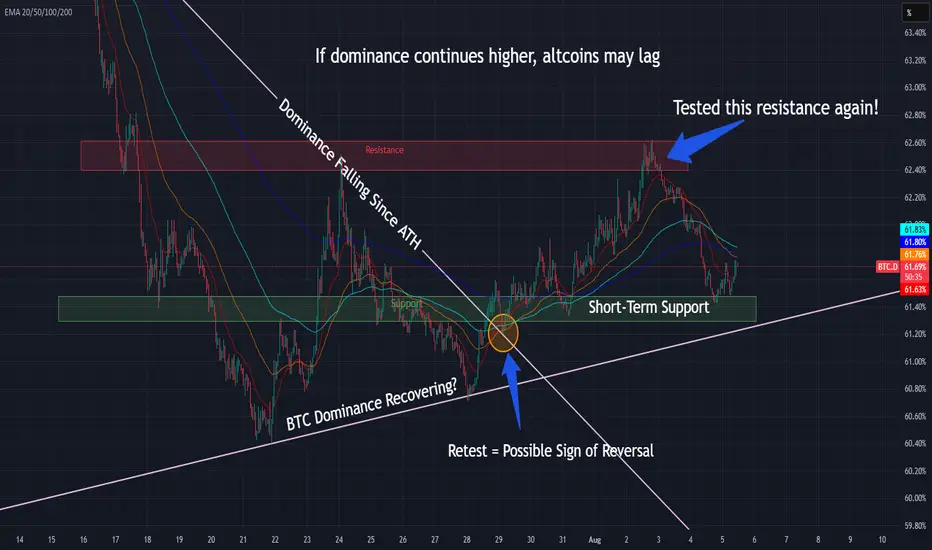
(updated) BTC Dominance Playing Out As ExpectedBTC Dominance broke the downtrend, retested the breakout line, and just rejected the resistance zone again — all exactly as charted.
📌 Structure is still bullish above ~61.4%
📌 Altcoins may stay suppressed if dominance holds higher
⏱️ Timeframe: 1H
#btcd #bitcoin #dominance #marketcycle #altseason
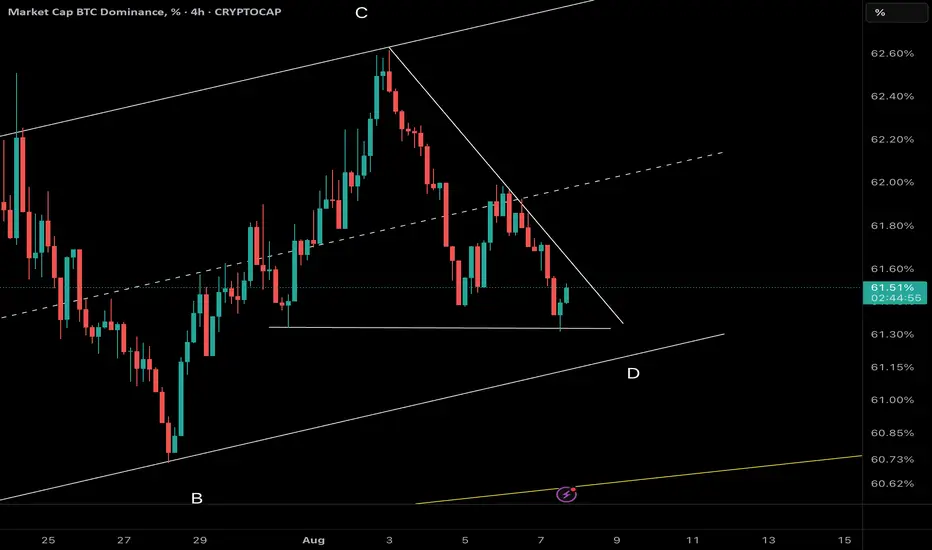
Bitcoin Dominance at Critical Juncture – Triangle Breakout Could🔍 Technical Overview
Bitcoin Dominance has declined from 62.6% to around 61.3%, forming a clear corrective leg within a rising channel. This drop has currently paused at a major static support, where price action is consolidating in a contracting triangle pattern near the channel’s lower boundary.
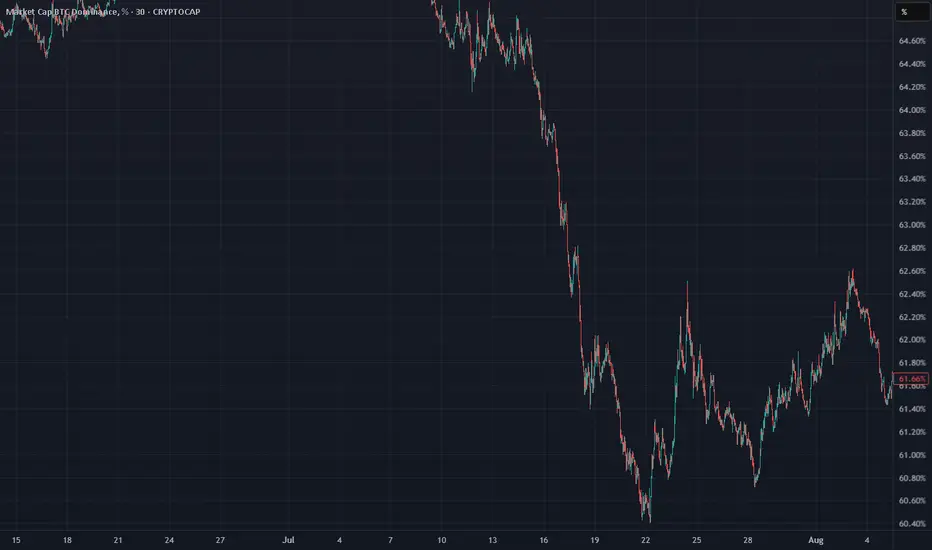
BTC DOMINANCE Analysis (4H)The previous analysis, which was for a higher timeframe, did not play out. The price bounced upward from higher support levels, which suggests that after the current sideways movement is over, we are likely to see another move to the downside in the coming weeks.
But what's happening on the lower t

Hoho BTCBitcoin’s recent consolidation above key support levels suggests strong buyer interest, with market sentiment shifting toward accumulation.
Technical indicators like rising moving averages and bullish RSI momentum reinforce the potential for an upward breakout.
Macro factors, including institutional
See all ideas
Summarizing what the indicators are suggesting.
Oscillators
Neutral
SellBuy
Strong sellStrong buy
Strong sellSellNeutralBuyStrong buy
Oscillators
Neutral
SellBuy
Strong sellStrong buy
Strong sellSellNeutralBuyStrong buy
Summary
Neutral
SellBuy
Strong sellStrong buy
Strong sellSellNeutralBuyStrong buy
Summary
Neutral
SellBuy
Strong sellStrong buy
Strong sellSellNeutralBuyStrong buy
Summary
Neutral
SellBuy
Strong sellStrong buy
Strong sellSellNeutralBuyStrong buy
Moving Averages
Neutral
SellBuy
Strong sellStrong buy
Strong sellSellNeutralBuyStrong buy
Moving Averages
Neutral
SellBuy
Strong sellStrong buy
Strong sellSellNeutralBuyStrong buy
Displays a symbol's price movements over previous years to identify recurring trends.