Release notes
This page contains release notes of notable changes in Pine Script.
July 2021
tostring now accepts “bool” and “string” types.
New argument for time and time_close functions was added:
timezone- timezone of thesessionargument, can only be used when a session is specified. Can be written out in GMT notation (e.g. “GMT-5”) or as an IANA time zone database name (e.g. “America/New_York”).
It is now possible to place a drawing object in the future with
xloc = xloc.bar_index.
New argument for study and strategy functions was added:
explicit_plot_zorder- specifies the order in which the indicator’s plots, fills, and hlines are rendered. If true, the plots will be drawn based on the order in which they appear in the indicator’s code, each newer plot being drawn above the previous ones.
June 2021
New variable was added:
barstate.islastconfirmedhistory- returnstrueif script is executing on the dataset’s last bar when market is closed, or script is executing on the bar immediately preceding the real-time bar, if market is open. Returnsfalseotherwise.
New function was added:
round_to_mintick(x)- returns the value rounded to the symbol’s mintick, i.e. the nearest value that can be divided bysyminfo.mintick, without the remainder, with ties rounding up.
Expanded tostring() functionality. The function now accepts three new
formatting arguments:
format.mintickto format to tick precision.format.volumeto abbreviate large values.format.percentto format percentages.
May 2021
Improved backtesting functionality by adding the Leverage mechanism.
Added support for table drawings and functions for working with them. Tables are unique objects that are not anchored to specific bars; they float in a script’s space, independently of the chart bars being viewed or the zoom factor used. For more information, see our User Manual page on tables.
New functions were added:
color.rgb(red, green, blue, transp)- creates a new color with transparency using the RGB color model.color.from_gradient(value, bottom_value, top_value, bottom_color, top_color)- returns color calculated from the linear gradient between bottom_color to top_color.color.r(color),color.g(color),color.b(color),color.t(color)- retrieves the value of one of the color components.array.from- takes a variable number of arguments with one of the types:int,float,bool,string,label,line,color,box,tableand returns an array of the corresponding type.
A new box drawing has been added to Pine, making it possible to draw
rectangles on charts using the Pine syntax. For more details see the
Pine Script
reference
and the User Manual page on
drawings
.
The color.new function can now accept series and input arguments, in
which case, the colors will be calculated at runtime. For more
information about this, see our User Manual page on
colors.
April 2021
New math constants were added:
math.pi- is a named constant for Archimedes’ constant. It is equal to 3.1415926535897932.math.phi- is a named constant for the golden ratio. It is equal to 1.6180339887498948.math.rphi- is a named constant for the golden ratio conjugate. It is equal to 0.6180339887498948.math.e- is a named constant for Euler’s number. It is equal to 2.7182818284590452.
New math functions were added:
round(x, precision)- returns the value ofxrounded to the nearest integer, with ties rounding up. If the precision parameter is used, returns a float value rounded to that number of decimal places.median(source, length)- returns the median of the series.mode(source, length)- returns the mode of the series. If there are several values with the same frequency, it returns the smallest value.range(source, length)- returns the difference between theminandmaxvalues in a series.todegrees(radians)- returns an approximately equivalent angle in degrees from an angle measured in radians.toradians(degrees)- returns an approximately equivalent angle in radians from an angle measured in degrees.random(min, max, seed)- returns a pseudo-random value. The function will generate a different sequence of values for each script execution. Using the same value for the optional seed argument will produce a repeatable sequence.
New functions were added:
session.ismarket- returnstrueif the current bar is a part of the regular trading hours (i.e. market hours),falseotherwise.session.ispremarket- returnstrueif the current bar is a part of the pre-market,falseotherwise.session.ispostmarket- returnstrueif the current bar is a part of the post-market,falseotherwise.str.format- converts the values to strings based on the specified formats. Accepts certainnumbermodifiers:integer,currency,percent.
March 2021
New assignment operators were added:
+=- addition assignment-=- subtraction assignment*=- multiplication assignment/=- division assignment%=- modulus assignment
New parameters for inputs customization were added:
inline- combines all the input calls with the same inline value in one line.group- creates a header above all inputs that use the same group string value. The string is also used as the header text.tooltip- adds a tooltip icon to theInputsmenu. The tooltip string is shown when hovering over the tooltip icon.
New argument for fill function was added:
fillgaps- controls whether fills continue on gaps when one of theplotcalls returns annavalue.
A new keyword was added:
varip- is similar to thevarkeyword, but variables declared withvaripretain their values between the updates of a real-time bar.
New functions were added:
tonumber- converts a string value into a float.time_close- returns the UNIX timestamp of the close of the current bar, based on the resolution and session that is passed to the function.dividends- requests dividends data for the specified symbol.earnings- requests earnings data for the specified symbol.splits- requests splits data for the specified symbol.
New arguments for the study() function were added:
resolution_gaps- fills the gaps between values fetched from higher timeframes when usingresolution.format.percent- formats the script output values as a percentage.
February 2021
New variable was added:
time_tradingday- the beginning time of the trading day the current bar belongs to.
January 2021
The following functions now accept a series length parameter:
- bb
- bbw
- cci
- cmo
- cog
- correlation
- dev
- falling
- mfi
- percentile_linear_interpolation
- percentile_nearest_rank
- percentrank
- rising
- roc
- stdev
- stoch
- variance
- wpr
A new type of alerts was added - script alerts. More information can be found in our Help Center.
December 2020
New array types were added:
array.new_linearray.new_labelarray.new_string
New functions were added:
str.length- returns number of chars in source string.array.join- concatenates all of the elements in the array into a string and separates these elements with the specified separator.str.split- splits a string at a given substring separator.
November 2020
- New
max_labels_countandmax_lines_countparameters were added to the study and strategy functions. Now you can manage the number of lines and labels by setting values for these parameters from 1 to 500.
New function was added:
array.range- return the difference between the min and max values in the array.
October 2020
The behavior of rising and falling functions have changed. For
example, rising(close,3) is now calculated as following:
September 2020
Added support for input.color to the input() function. Now you can
provide script users with color selection through the script’s
“Settings/Inputs” tab with the same color widget used throughout the
TradingView user interface. Learn more about this feature in our
blog:
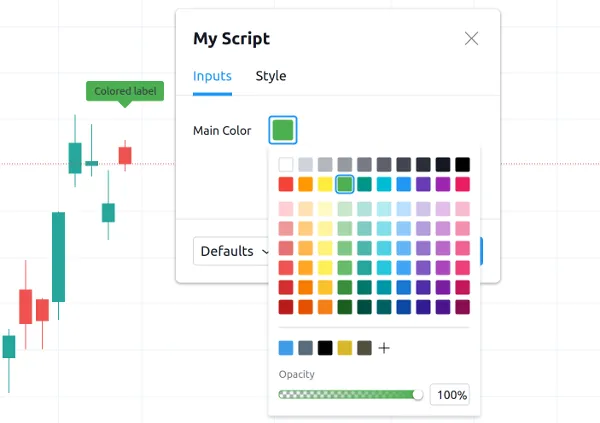
Added support for arrays and functions for working with them. You can now use the powerful new array feature to build custom datasets. See our User Manual page on arrays and our blog:
The following functions now accept a series length parameter. Learn more about this feature in our blog:
August 2020
- Optimized script compilation time. Scripts now compile 1.5 to 2 times faster.
July 2020
- Minor bug fixes and improvements.
June 2020
- New
resolutionparameter was added to thestudyfunction. Now you can add MTF functionality to scripts and decide the timeframe you want the indicator to run on.
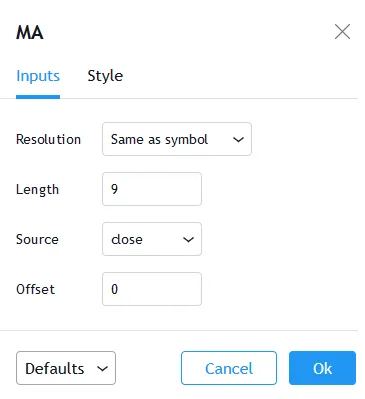
Please note that you need to reapply the indicator in order for the [resolution] parameter to appear.
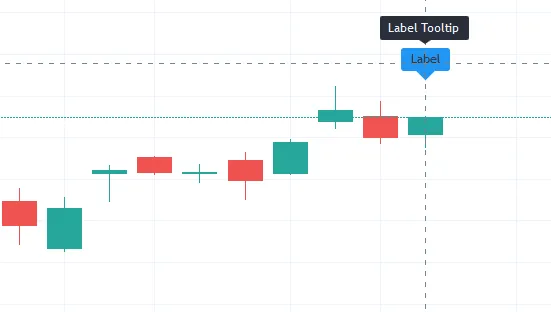
- The
tooltipargument was added to thelabel.newfunction along with thelabel.set_tooltipfunction:
- Added an ability to create alerts on strategies.
- A new function line.get_price can be used to determine the price level at which the line is located on a certain bar.
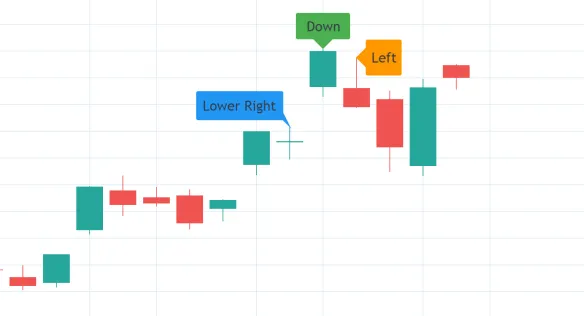
- New label styles allow you to position the label pointer in any direction.
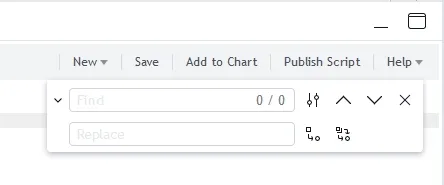
- Find and Replace was added to Pine Editor. To use this, press CTRL+F (find) or CTRL+H (find and replace).
timezoneargument was added for time functions. Now you can specify timezone forsecond,minute,hour,year,month,dayofmonth,dayofweekfunctions:
syminfo.basecurrencyvariable was added. Returns the base currency code of the current symbol. For EURUSD symbol returns EUR.
May 2020
else ifstatement was added- The behavior of
securityfunction has changed: theexpressionparameter can be series or tuple.
April 2020
New function was added:
quandl- request quandl data for a symbol
March 2020
New function was added:
financial- request financial data for a symbol
New functions for common indicators were added:
cmo- Chande Momentum Oscillatormfi- Money Flow Indexbb- Bollinger Bandsbbw- Bollinger Bands Widthkc- Keltner Channelskcw- Keltner Channels Widthdmi- DMI/ADXwpr- Williams % Rhma- Hull Moving Averagesupertrend- SuperTrend
Added a detailed description of all the fields in the Strategy Tester Report
February 2020
-
New Pine indicator VWAP Anchored was added. Now you can specify the time period: Session, Month, Week, Year.
-
Fixed a problem with calculating
percentrankfunction. Now it can return a zero value, which did not happen before due to an incorrect calculation. -
The default
transparencyparameter for theplot,plotshape, andplotcharfunctions is now 0%. -
For the functions
plot,plotshape,plotchar,plotbar,plotcandle,plotarrow, you can set thedisplayparameter, which controls the display of the plot. The following values can be assigned to it:display.none- the plot is not displayeddisplay.all- the plot is displayed (Default)
-
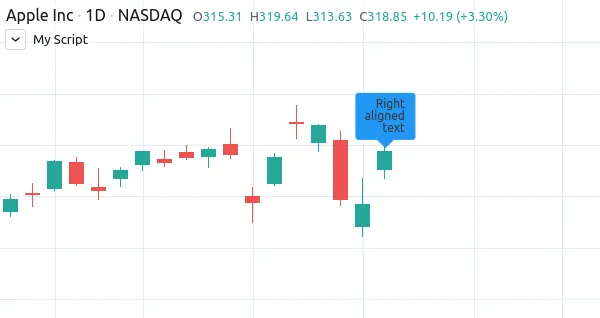
The
textalignargument was added to thelabel.newfunction along with thelabel.set_textalignfunction. Using those, you can control the alignment of the label’s text:
January 2020
New built-in variables were added:
iii- Intraday Intensity Indexwvad- Williams Variable Accumulation/Distributionwad- Williams Accumulation/Distributionobv- On Balance Volumepvt- Price-Volume Trendnvi- Negative Volume Indexpvi- Positive Volume Index
New parameters were added for strategy.close:
qty- the number of contracts/shares/lots/units to exit a trade withqty_percent- defines the percentage of entered contracts/shares/lots/units to exit a trade withcomment- addtional notes on the order
New parameter was added for strategy.close_all:
comment- additional notes on the order
December 2019
-
Warning messages were added.
For example, if you don’t specify exit parameters for
strategy.exit-profit,limit,loss,stopor one of the following pairs:trail_offsetandtrail_price/trail_points- you will see a warning message in the console in the Pine editor. -
Increased the maximum number of arguments in
max,min,avgfunctions. Now you can use up to ten arguments in these functions.
October 2019
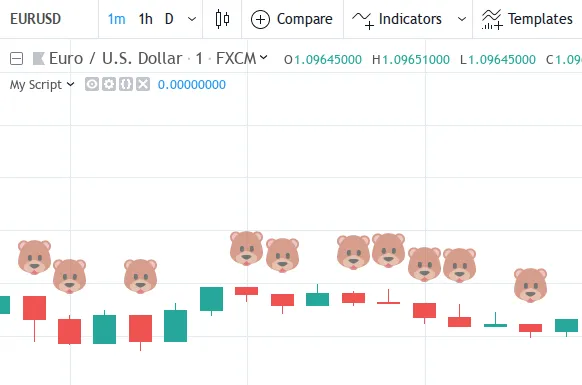
plotcharfunction now supports most of the Unicode symbols:
- New
bordercolorargument of theplotcandlefunction allows you to change the color of candles’ borders:
-
New variables added:
syminfo.description- returns a description of the current symbolsyminfo.currency- returns the currency code of the current symbol (EUR, USD, etc.)syminfo.type- returns the type of the current symbol (stock, futures, index, etc.)
September 2019
New parameters to the strategy function were added:
process_orders_on_closeallows the broker emulator to try to execute orders after calculating the strategy at the bar’s closeclose_entries_ruleallows to define the sequence used for closing positions
Some fixes were made:
fillfunction now works correctly withnaas thecolorparameter valuesignfunction now calculates correctly for literals and constants
str.replace_all (source, target, replacement) function was added. It
replaces each occurrence of a target string in the source string
with a replacement string
July-August 2019
New variables added:
timeframe.issecondsreturns true when current resolution is in secondstimeframe.isminutesreturns true when current resolution is in minutestime_closereturns the current bar’s close time
The behavior of some functions, variables and operators has changed:
-
The
timevariable returns the correct open time of the bar for more special cases than before -
An optional seconds parameter of the
timestampfunction allows you to set the time to within seconds -
securityfunction:-
Added the possibility of requesting resolutions in seconds:
1, 5, 15, 30 seconds (chart resolution should be less than or equal to the requested resolution)
-
Reduced the maximum value that can be requested in some of the other resolutions:
from 1 to 1440 minutes
from 1 to 365 days
from 1 to 52 weeks
from 1 to 12 months
-
-
Changes to the evaluation of ternary operator branches:
In Pine v3, during the execution of a ternary operator, both its branches are calculated, so when this script is added to the chart, a long position is opened, even if the long() function is not called:
Pine v4 contains built-in functions with side effects ( line.new
and label.new ). If calls to these functions are present in both
branches of a ternary operator, both function calls would be
executed following v3 conventions. Thus, in Pine v4, only the branch
corresponding to the evaluated condition is calculated. While this
provides a viable solution in some cases, it will modify the
behavior of scripts which depended on the fact that both branches of
a ternary were evaluated. The solution is to pre-evaluate
expressions prior to the ternary operator. The conversion utility
takes this requirement into account when converting scripts from v3
to v4, so that script behavior will be identical in v3 and v4.
June 2019
- Support for drawing objects. Added label and line drawings
varkeyword for one time variable initialization- Type system improvements:
- series string data type
- functions for explicit type casting
- syntax for explicit variable type declaration
- new input type forms
- Renaming of built-ins and a version 3 to 4 converter utility
max_bars_backfunction to control series variables internal history buffer sizes- Pine Script documentation versioning
October 2018
- To increase the number of indicators available to the whole community, Invite-Only scripts can now be published by Premium users only.
April 2018
- Improved the Strategy Tester by reworking the Maximum Drawdown calculation formula.
August 2017
- With the new argument
show_lastin the plot-type functions, you can restrict the number of bars that the plot is displayed on.
June 2017
- A major script publishing improvement: it is now possible to update your script without publishing a new one via the Update button in the publishing dialog.
May 2017
- Expanded the type system by adding a new type of constants that can be calculated during compilation.
April 2017
- Expanded the keyword argument functionality: it is now possible to use keyword arguments in all built-in functions.
- A new
barstate.isconfirmedvariable has been added to the list of variables that return bar status. It lets you create indicators that are calculated based on the closed bars only. - The
optionsargument for theinput()function creates an input with a set of options defined by the script’s author.
March 2017
- Pine Script v3 is here! Some important changes:
- Changes to the default behavior of the
security()function: it can no longer access the future data by default. This can be changes with thelookaheadparameter. - An implicit conversion of boolean values to numeric values was replaced with an implicit conversion of numeric values (integer and float) to boolean values.
- Self-referenced and forward-referenced variables were removed. Any PineScript code that used those language constructions can be equivalently rewritten using mutable variables.
- Changes to the default behavior of the
February 2017
- Several improvements to the strategy tester and the strategy report:
- New Buy & Hold equity graph — a new graph that lets you compare performance of your strategy versus a “buy and hold”, i.e if you just bought a security and held onto it without trading.
- Added percentage values to the absolute currency values.
- Added Buy & Hold Return to display the final value of Buy & Hold Equity based on last price.
- Added Sharpe Ratio — it shows the relative effectiveness of the investment portfolio (security), a measure that indicates the average return minus the risk-free return divided by the standard deviation of return on an investment.
- Slippage lets you simulate a situation when orders are filled at
a worse price than expected. It can be set through the
Properties dialog or through the slippage argument in the
strategy()function. - Commission allows yot to add commission for placed orders in
percent of order value, fixed price or per contract. The amount
of commission paid is shown in the Commission Paid field. The
commission size and its type can be set through the Properties
dialog or through the commission_type and commission_value
arguments in the
strategy()function.
December 2016
- Added invite-only scripts. The invite-only indicators are visible in the Public Library, but nobody can use them without explicit permission from the author, and only the author can see the source code.
October 2016
- Introduded indicator revisions. Each time an indicator is saved, it gets a new revision, and it is possible to easily switch to any past revision from the Pine Editor.
September 2016
- It is now possible to publish indicators with protected source code. These indicators are available in the public Script Library, and any user can use them, but only the author can see the source code.
July 2016
- Improved the behavior of the
fill()function: one call can now support several different colors.
March 2016
- Color type variables now have an additional parameter to set default
transparency. The transparency can be set with the
color.new()function, or by adding an alpha-channel value to a hex color code.
February 2016
- Added
forloops and keywordsbreakandcontinue. - Pine now supports mutable variables! Use the
:=operator to assign a new value to a variable that has already been defined. - Multiple improvements and bug fixes for strategies.
January 2016
- A new
alertcondition()function allows for creating custom alert conditions in Pine-based indicators.
October 2015
- Pine has graduated to v2! The new version of Pine Script added
support for
ifstatements, making it easier to write more readable and concise code.
September 2015
- Added backtesting functionality to Pine. It is now possible to create trading strategies, i.e. scripts that can send, modify and cancel orders to buy or sell. Strategies allow you to perform backtesting (emulation of strategy trading on historical data) and forward testing (emulation of strategy trading on real-time data) according to your algorithms. Detailed information about the strategy’s calculations and the order fills can be seen in the newly added Strategy Tester tab.
July 2015
- A new
editableparameter allows hiding the plot from the Style menu in the indicator settings so that it is not possible to edit its style. The parameter has been added to all the following functions: all plot-type functions,barcolor(),bgcolor(),hline(), andfill().
June 2015
- Added two new functions to display custom barsets using PineScipt:
plotbar()andplotcandle().
April 2015
- Added two new shapes to the
plotshape()function: shape.labelup and shape.labeldown. - PineScipt Editor has been improved and moved to a new panel at the bottom of the page.
- Added a new
stepargument for theinput()function, allowing to specify the step size for the indicator’s inputs.
March 2015
- Added support for inputs with the
sourcetype to theinput()function, allowing to select the data source for the indicator’s calculations from its settings.
February 2015
- Added a new
textargument toplotshape()andplotchar()functions. - Added four new shapes to the
plotshape()function: shape.arrowup, shape.arrowdown, shape.square, shape.diamond.
August 2014
- Improved the script sharing capabilities, changed the layout of the Indicators menu and separated published scripts from ideas.
July 2014
- Added three new plotting functions,
plotshape(),plotchar(), andplotarrow()for situations when you need to highlight specific bars on a chart without drawing a line. - Integrated QUANDL data into Pine Script. The data can be accessed by
passing the QUANDL ticker to the
securityfunction.
June 2014
- Added Pine Script sharing, enabling coders and traders to share their scripts with the rest of the TradingView community.
April 2014
- Added line wrapping.
February 2014
- Added support for inputs, allowing users to edit the indicator inputs through the properties window, without needing to edit the Pine script.
- Added self-referencing variables.
- Added support for multiline functions.
- Implemented the type-casting mechanism, automatically casting constant and simple float and int values to series when it is required.
- Added several new functions and improved the existing ones:
barssince()andvaluewhen()allow you to check conditions on historical data easier.- The new
barcolor()function lets you specify a color for a bar based on filling of a certain condition. - Similar to the
barcolor()function, thebgcolor()function changes the color of the background. - Reworked the
security()function, further expanding its functionality. - Improved the
fill()function, enabling it to be used more than once in one script. - Added the
round()function to round and convert float values to integers.
December 2013
- The first version of Pine is introduced to all TradingView users, initially as an open beta, on December 13th.