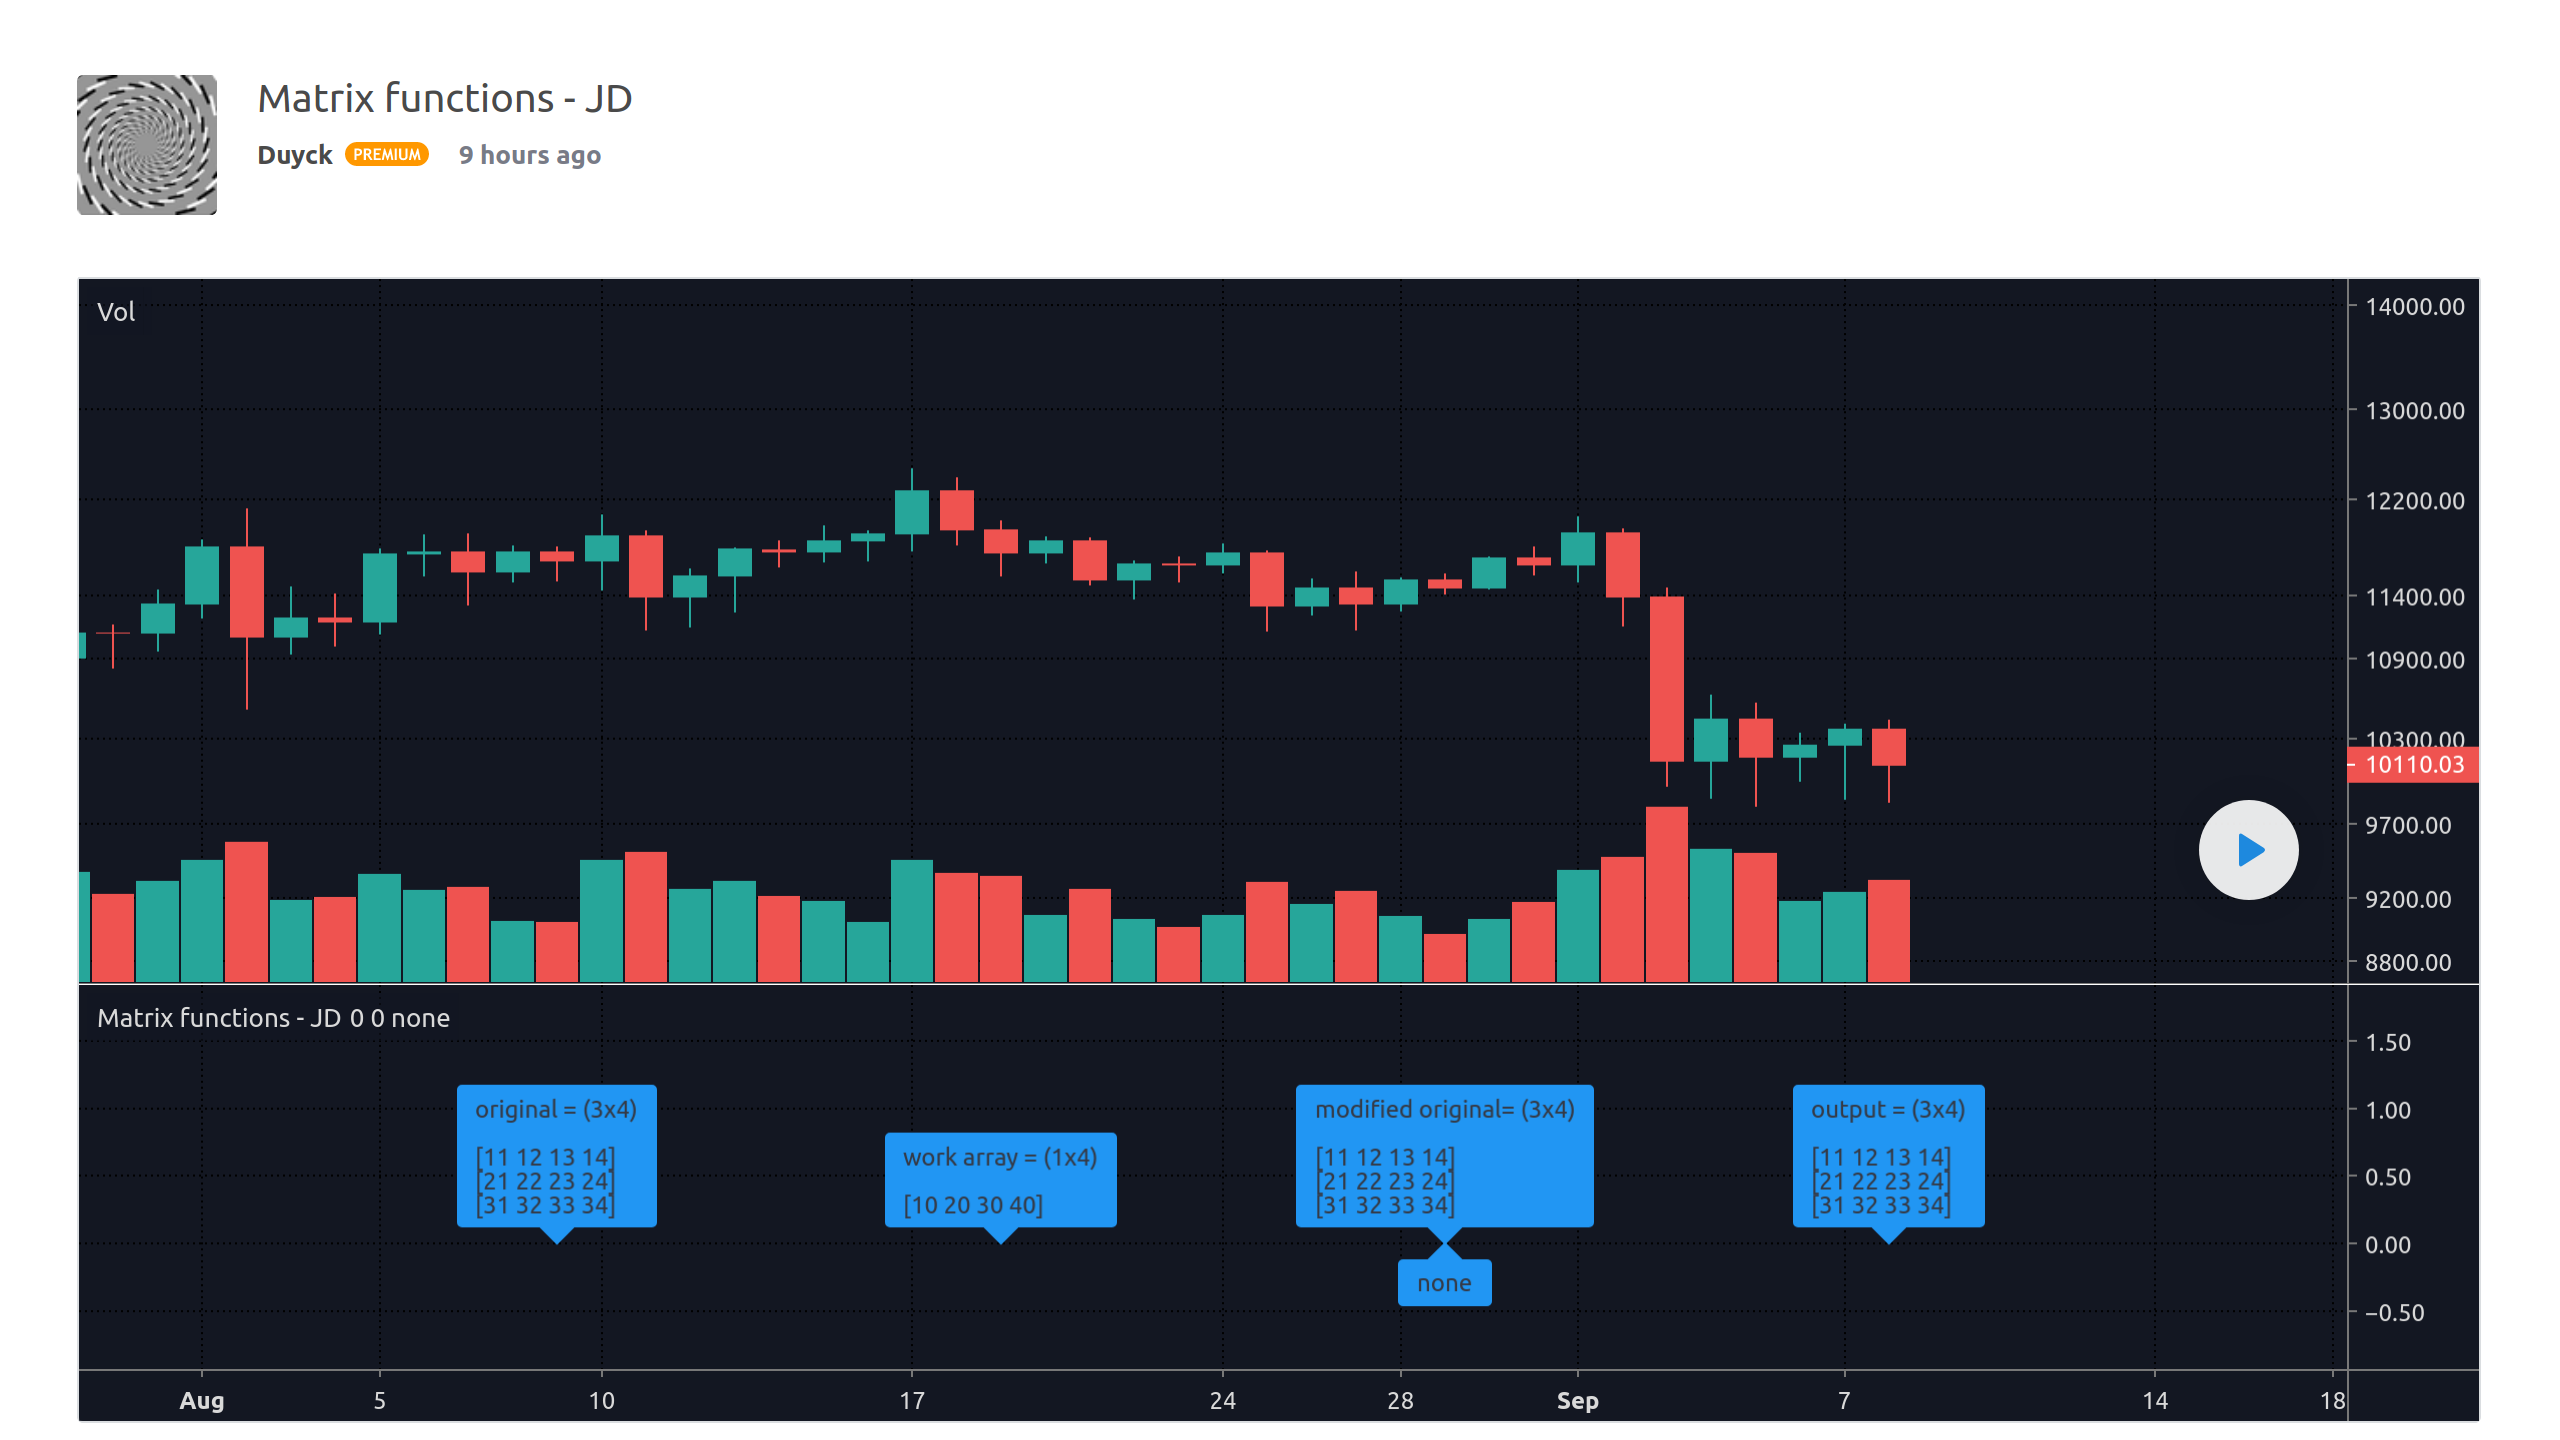
파인 스크립트에서 파워풀한 어레이로 커스텀 데이터셋을 만들 수 있게 되었습니다. 다음 타입의 일차원 어레이를 쓸 수 있습니다: float, int, bool, or color.
다음 라인은 na 밸류로 초기화된 세 개의 float 엘리먼트가 들어 있는 levels 라는 어레이를 만듭니다:
levels = array.new_float(size = 3, initial_value = na)
어레이는 다이내믹하게 리사이즈할 수 있습니다. 카피, 소트, 슬라이스 등의 스페셜 어레이 펑크션이 있습니다. 스페셜 매쓰 펑크션도 어레이에 쓸 수 있습니다: array.min(), array.max(), array.stdev(), array.avg(), array.median(), 등.
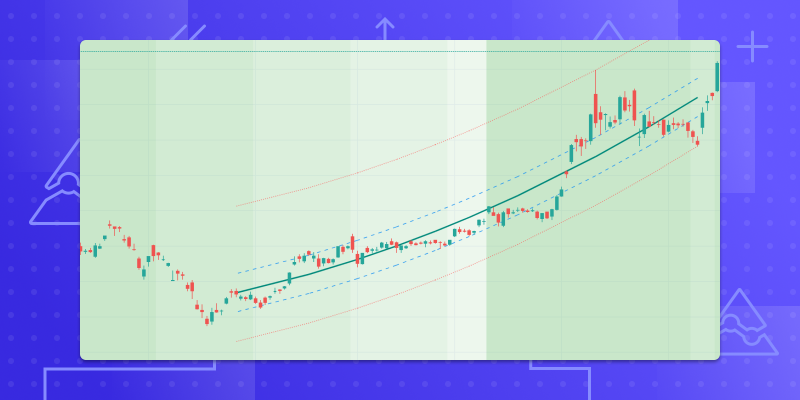
아래 보기는 어레이를 써서 볼륨이 늘어나는 바만의 프라이스 레벨을 갖는 데이터셋을 만든 뒤 이들 밸류의 애버리지를 플롯합니다. 여기 쓰이는 어레이는 FIFO (first in, first out) 스트럭쳐를 만듭니다:
//@version=4
study("Price Avg Of Increasing Volume Bars", "", true)
i_levels = input(20,   "Levels")
i_src    = input(hlc3, "Source")

// Initialize array of user-selected size with `na` values.
var levels = array.new_float(i_levels)

if rising(volume, 1)
    // Remove the oldest level from the beginning of the array.
    array.shift(levels)

    // Add the new level to the end of the array.
    array.push(levels, i_src)

// Calculate the avg of levels in the array, excluding any `na` values.
level = array.avg(levels)
plot(level, "Level", close > level ? color.lime : color.fuchsia)
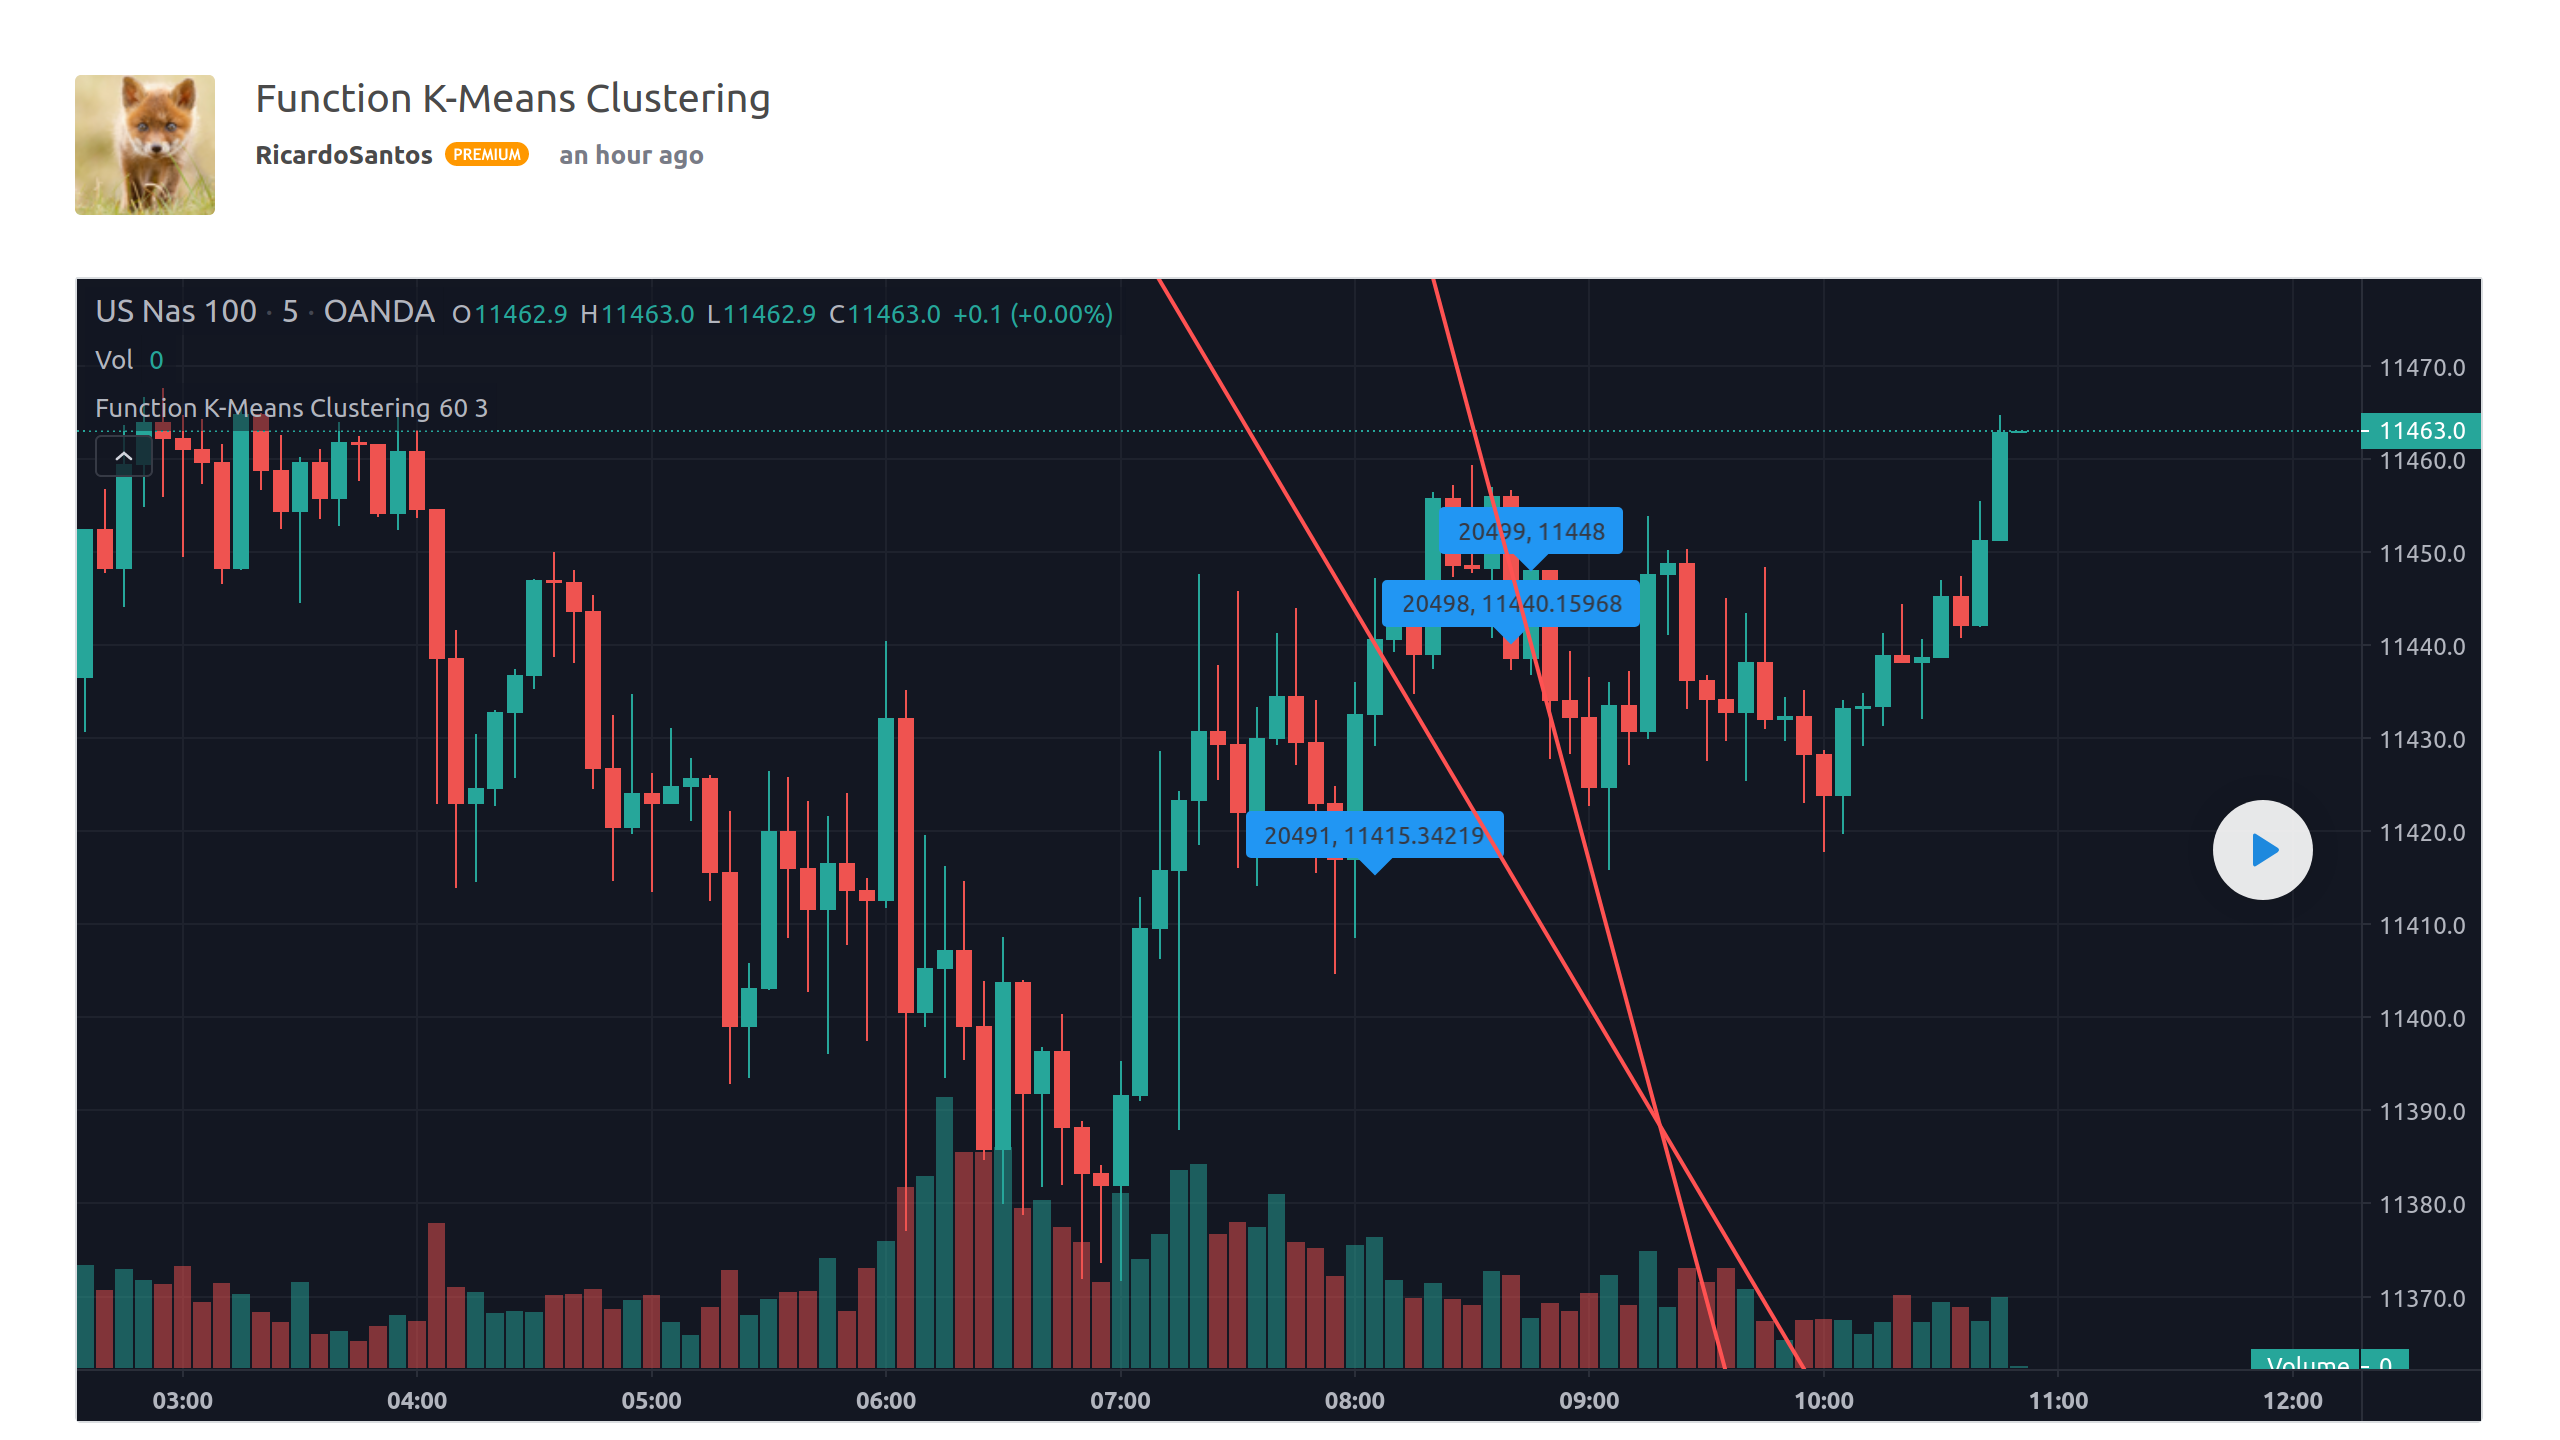
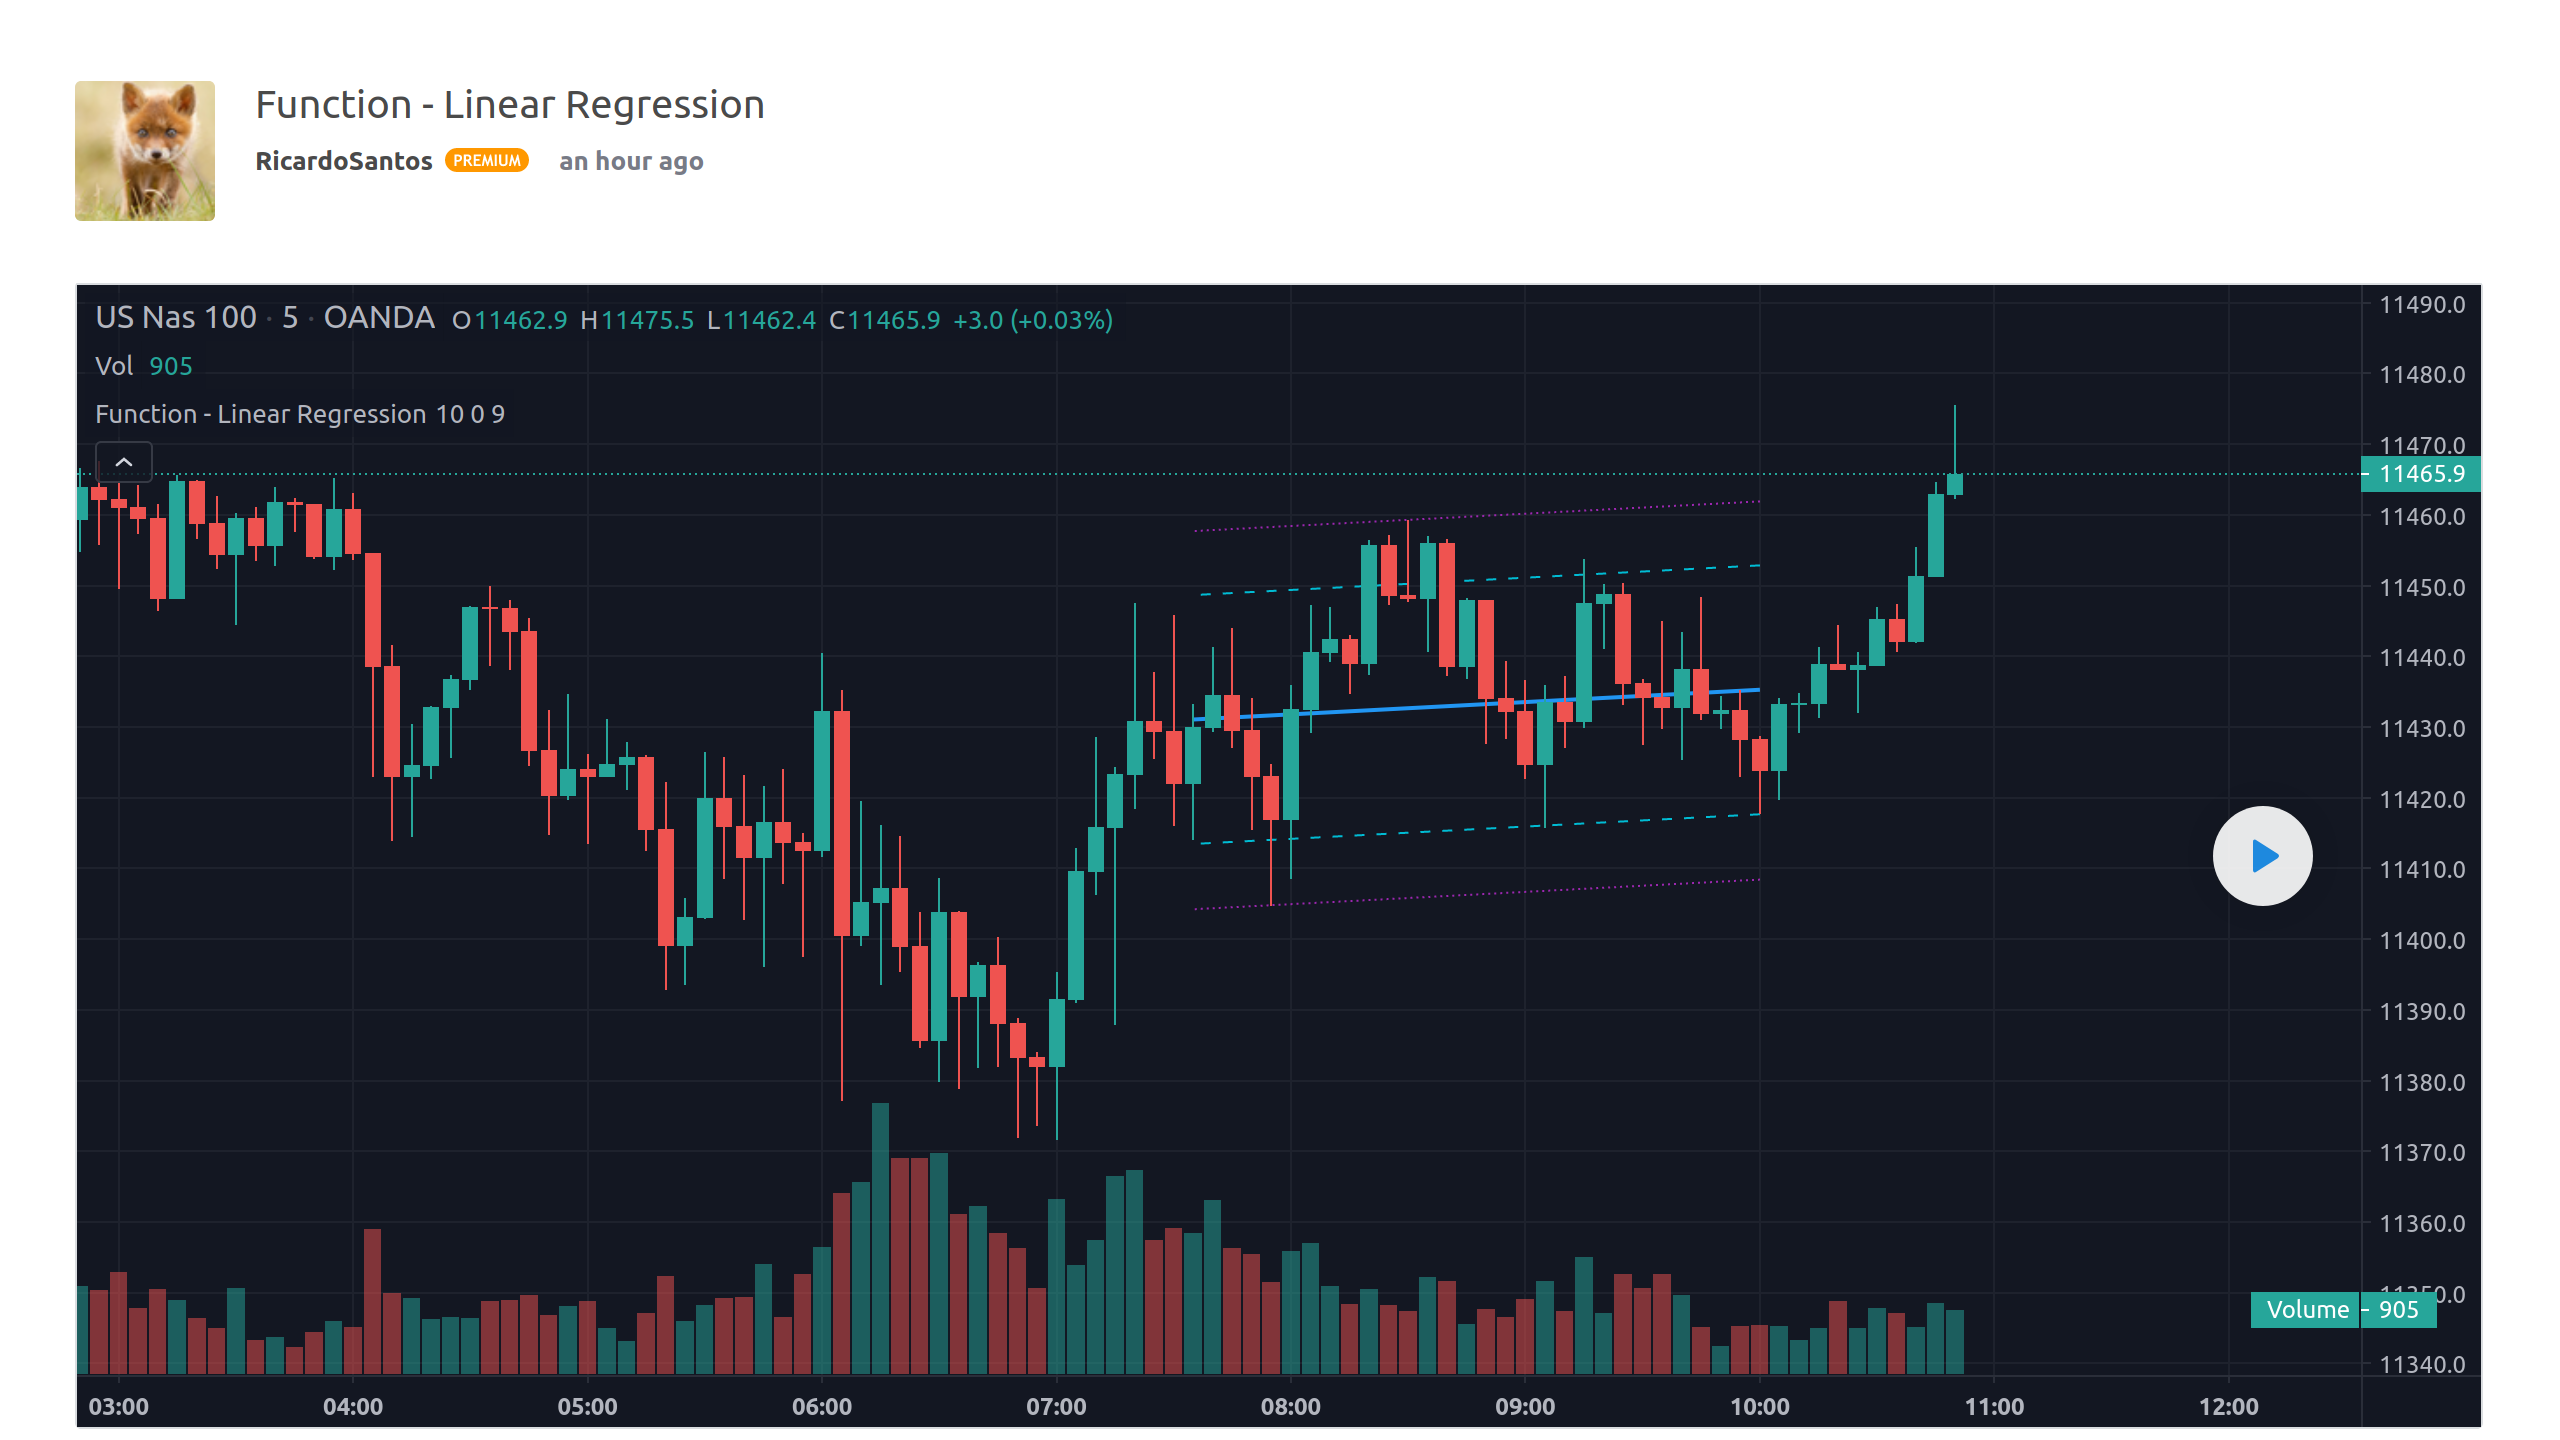
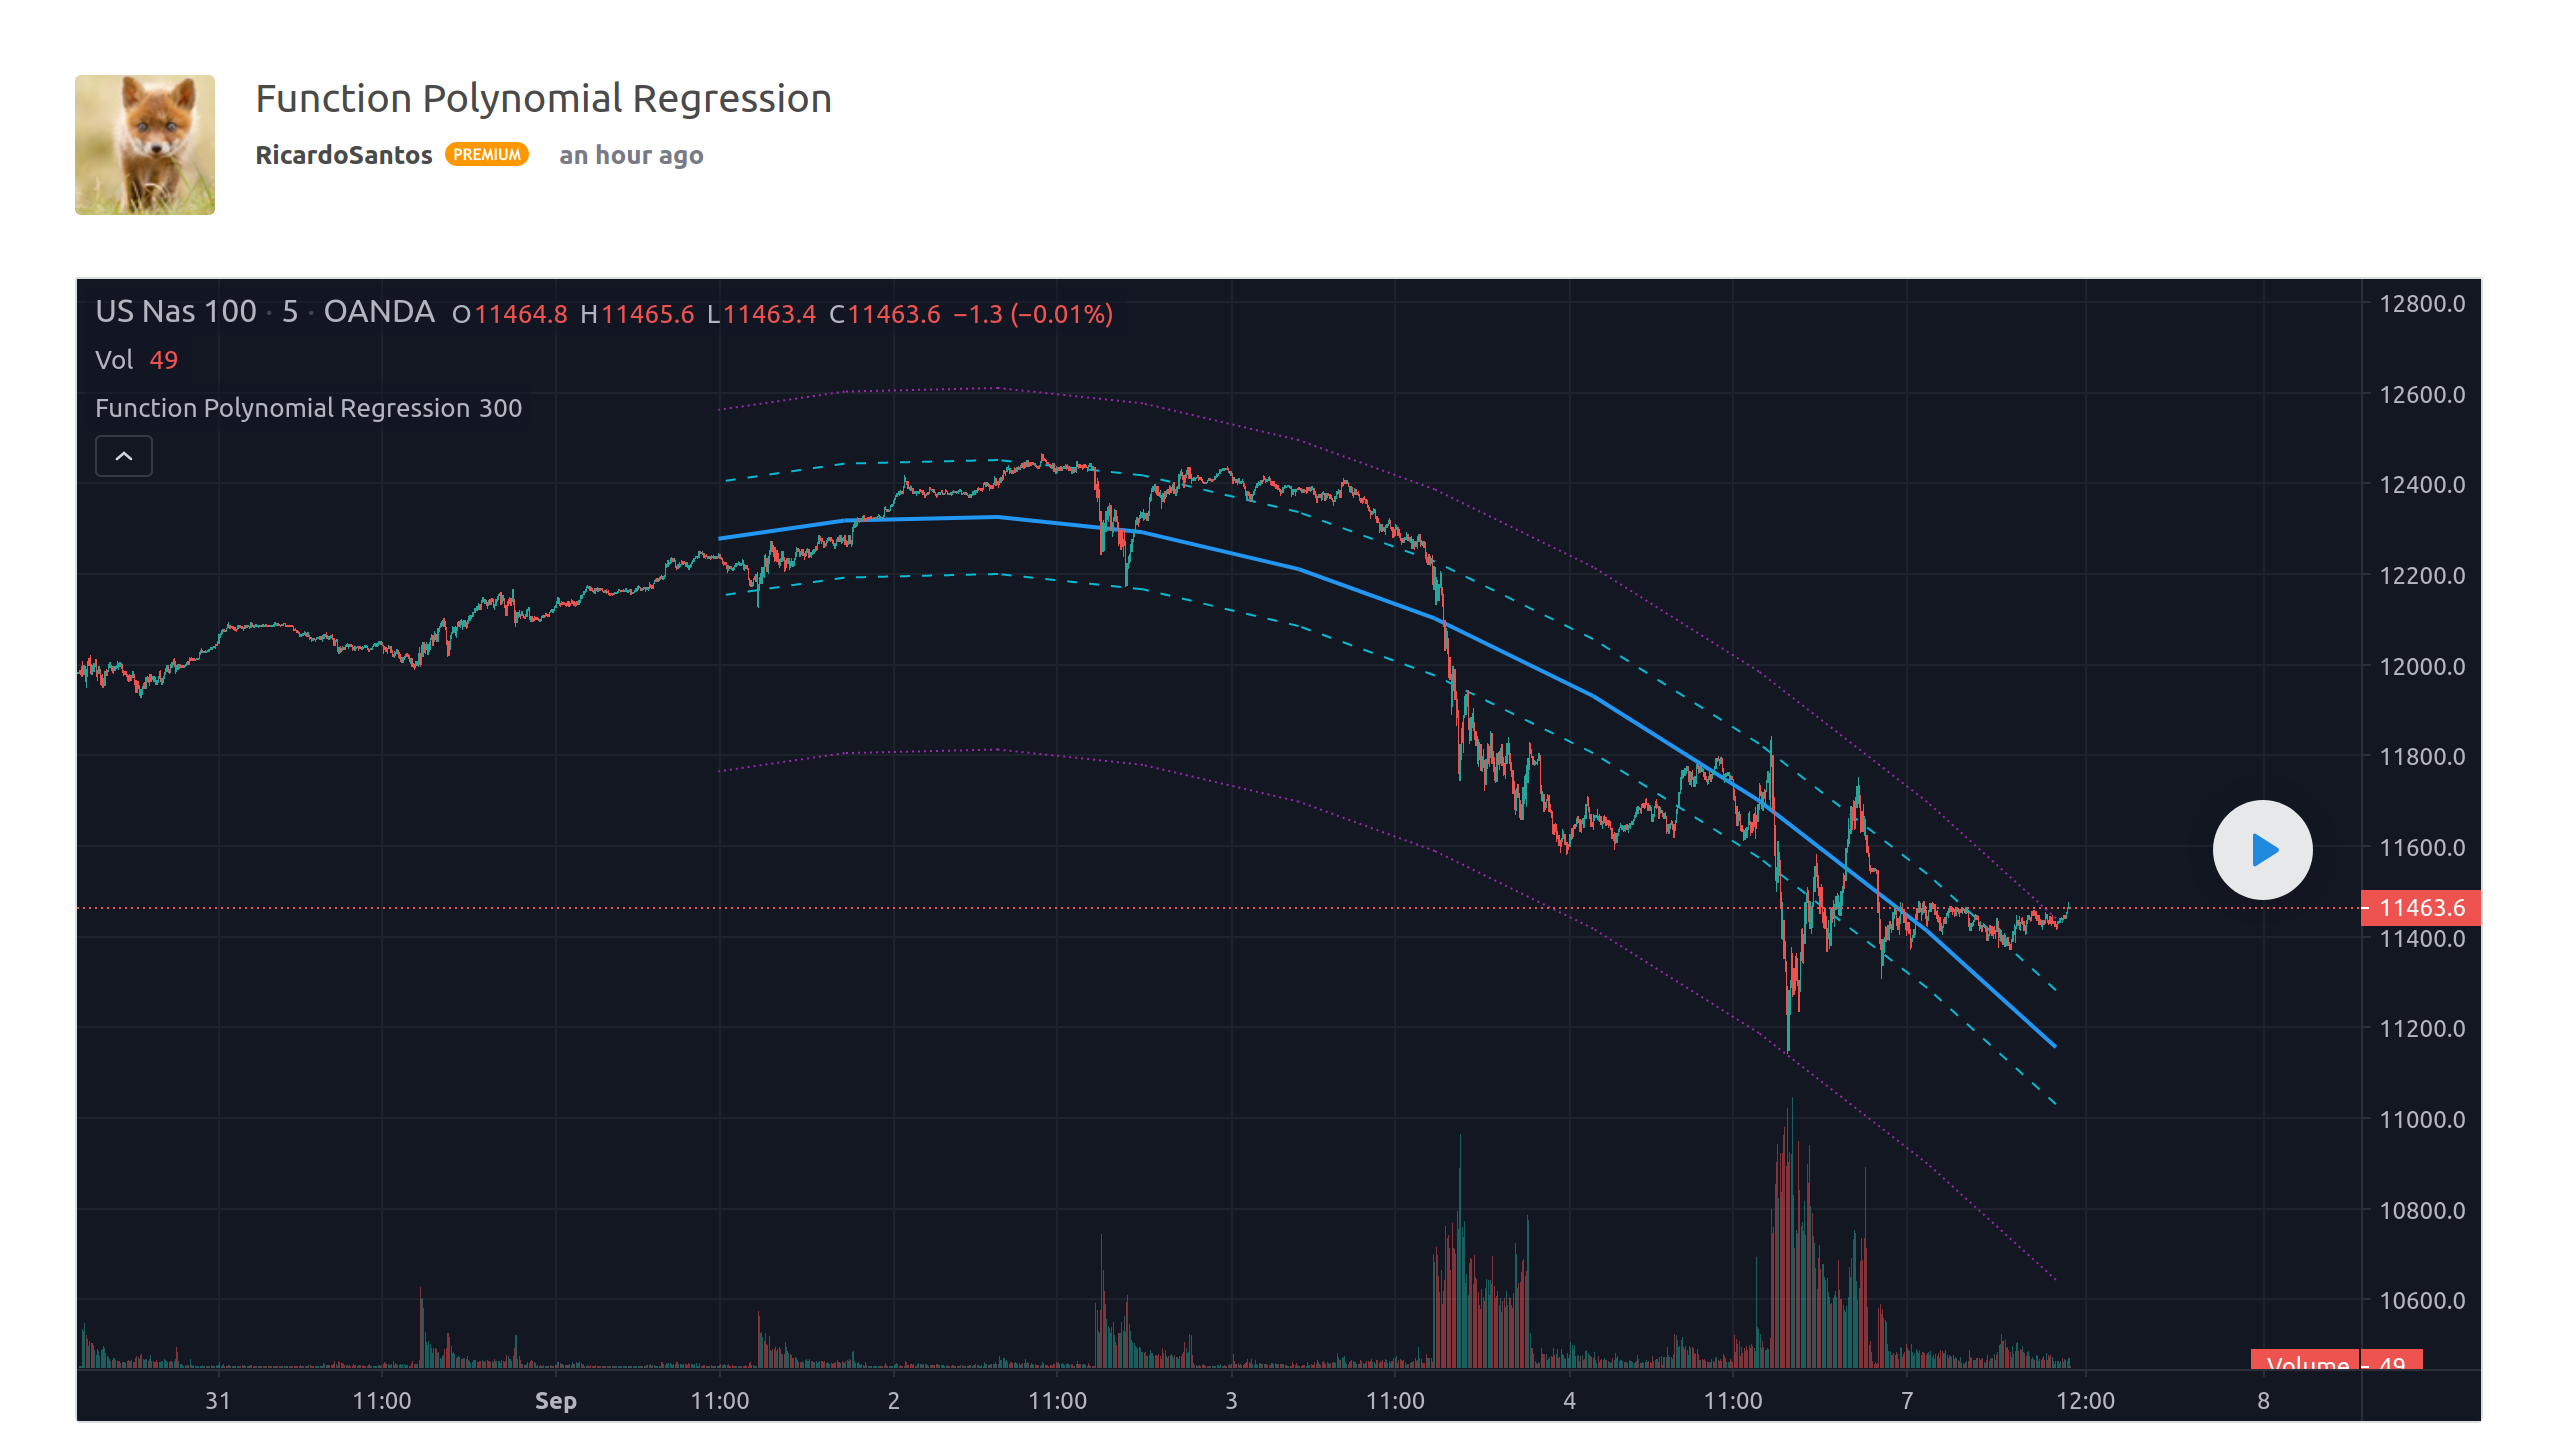
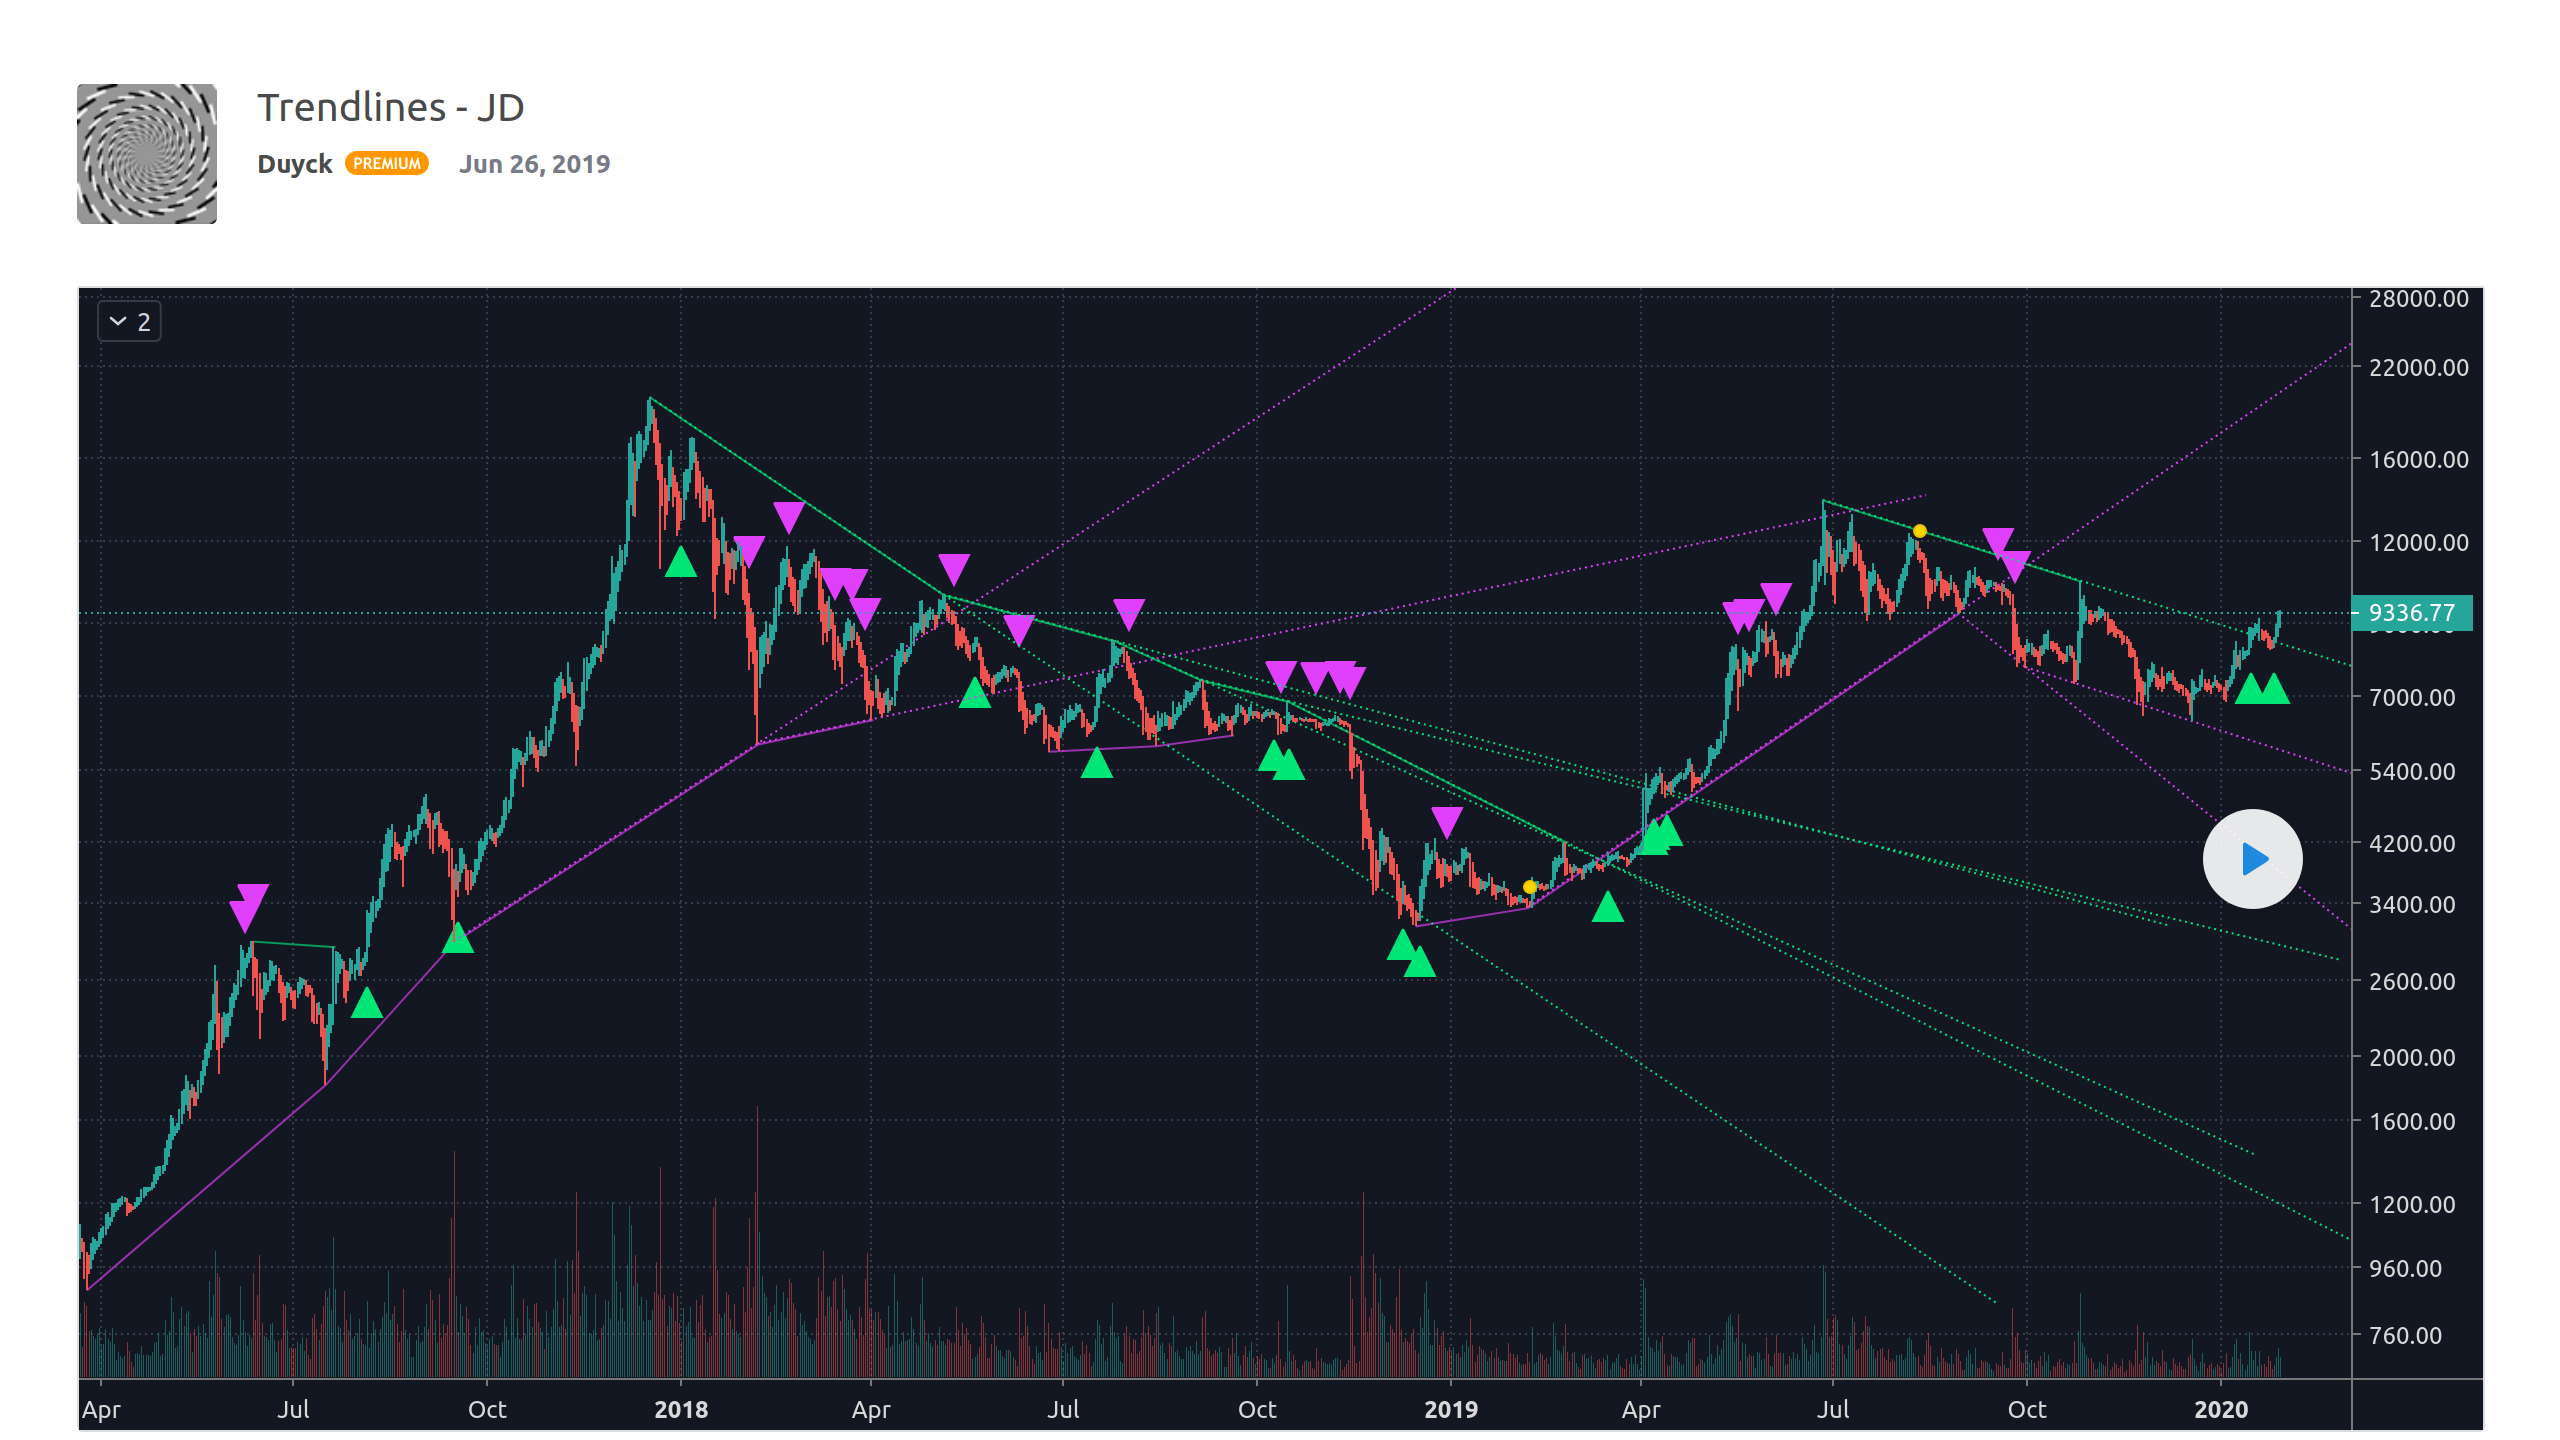
어레이에 대한 파인 유저 매뉴얼 페이지에서 여러분의 첫 걸음을 도와줄 것입니다. 또한 다음 스크립트들에 나오는 어레이를 보시기 바랍니다. 도움을 주신 RicardoSantos 와 Duyck 에게 고마움을 전합니다:
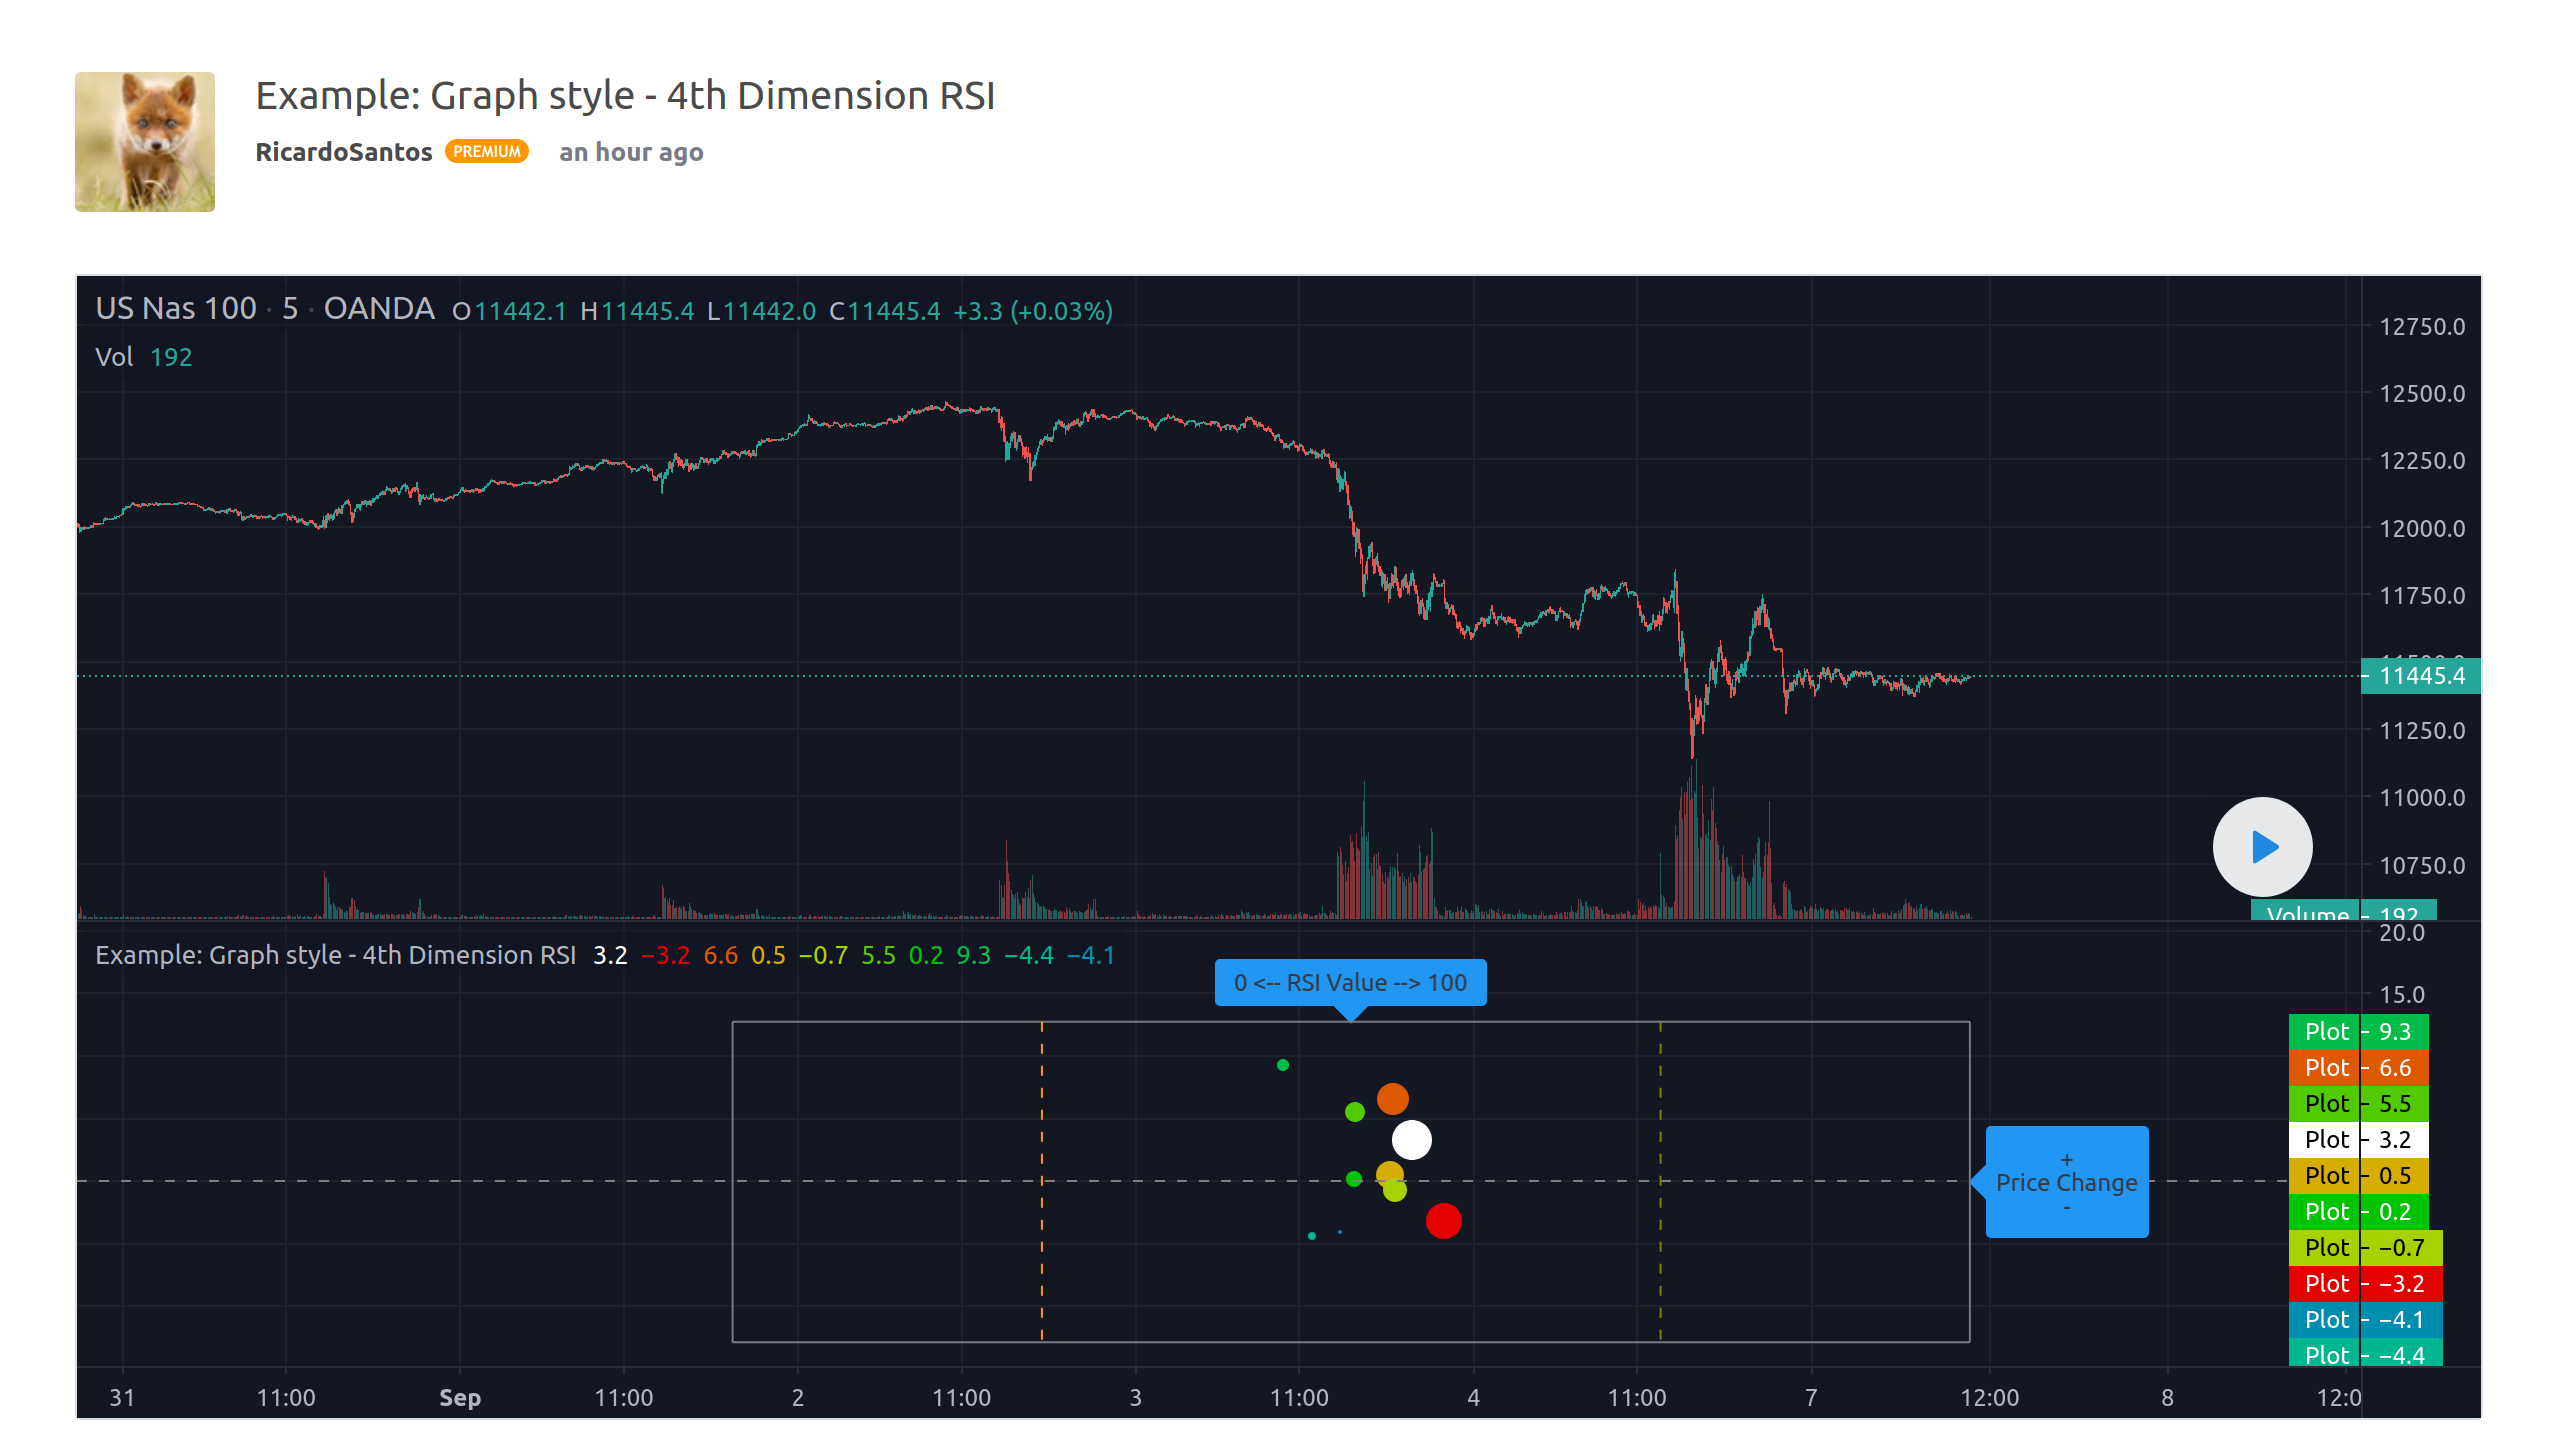
Graph style – 4th Dimension RSI
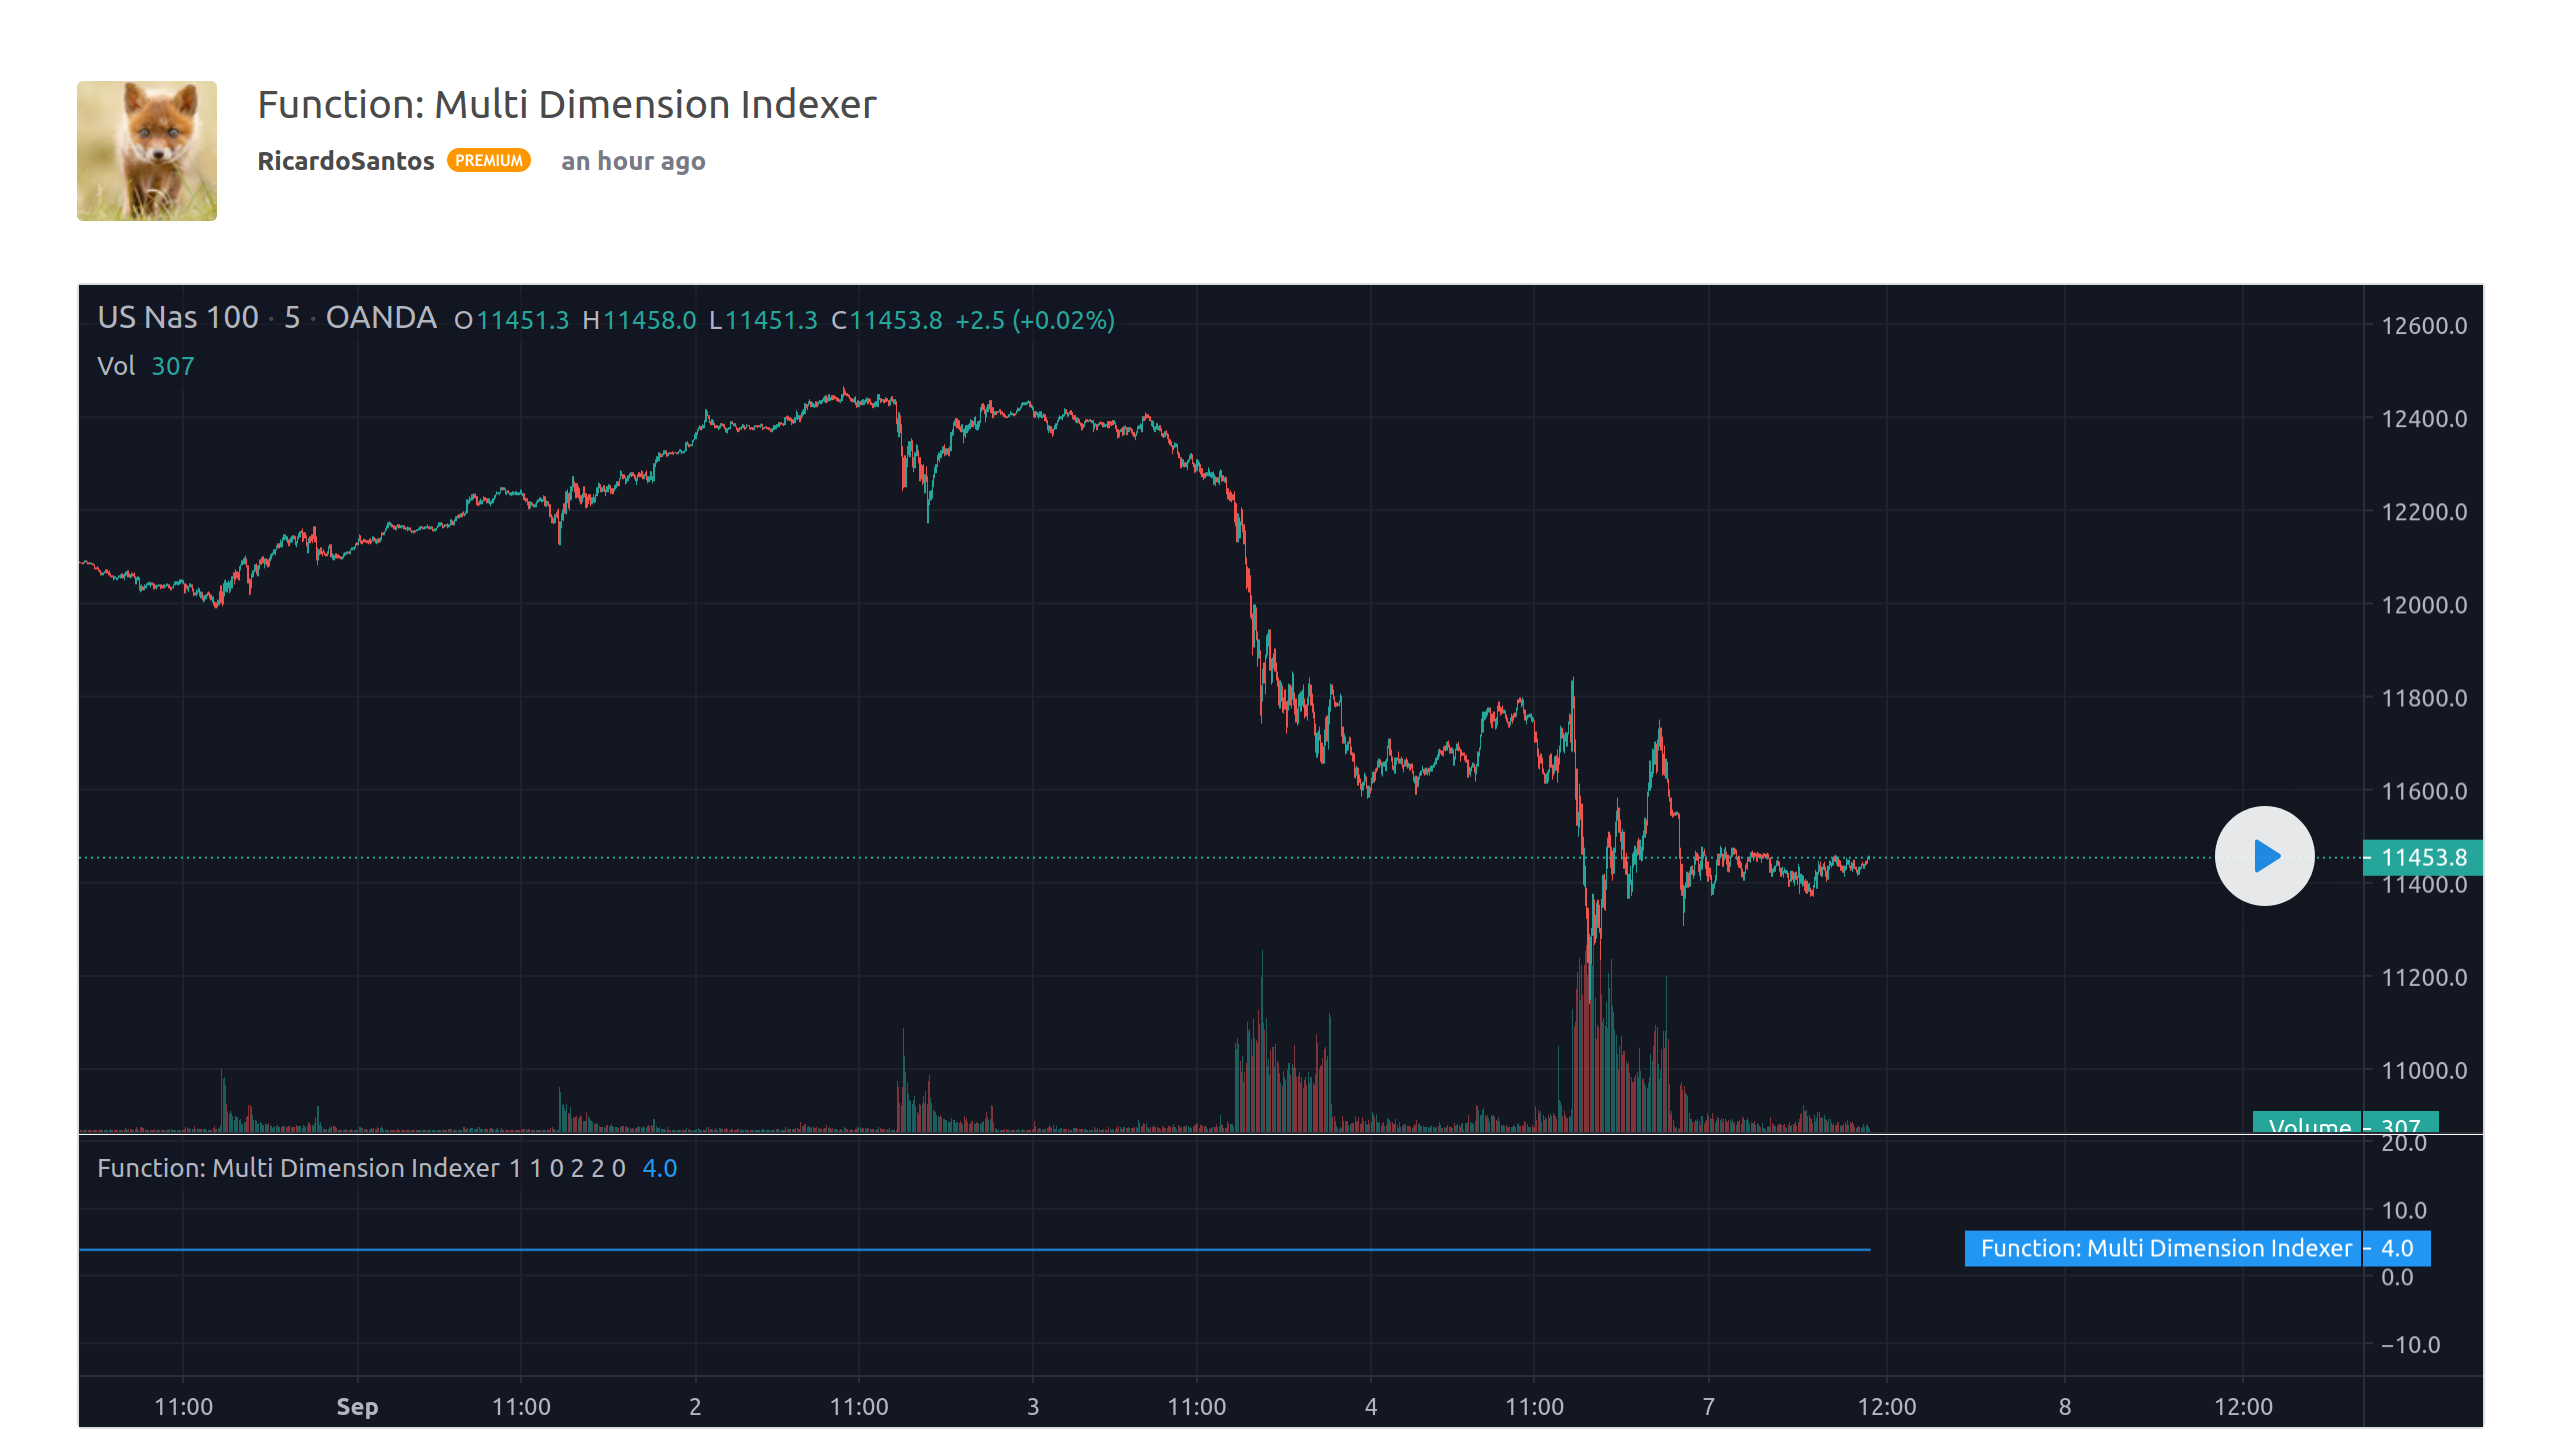
Function – Multi Dimension Indexer
Function – Polynomial Regression
모든 트레이딩뷰 트레이더를 위해 위 스크립트를 통해 파인에서 어레이가 좀 더 파워풀한 인디케이터 및 스트래티지를 만들 수 있도록 앞길을 열어 줄 것입니다.
여러분의 피드백을 계속 보내 주시기 바랍니다. 여러분의 의견을 들어 트레이딩뷰를 개선하도록 하겠습니다.