█ Why Prices Move Up or Down: Understanding Order Flow and Liquidity
Most traders are told that prices rise because “there are more buyers than sellers,” and that prices fall because “there are more sellers than buyers.” But that’s not how markets actually work. In every transaction, there’s always one buyer and one seller; what really matters is which side is more aggressive and how liquidity responds to that aggression.
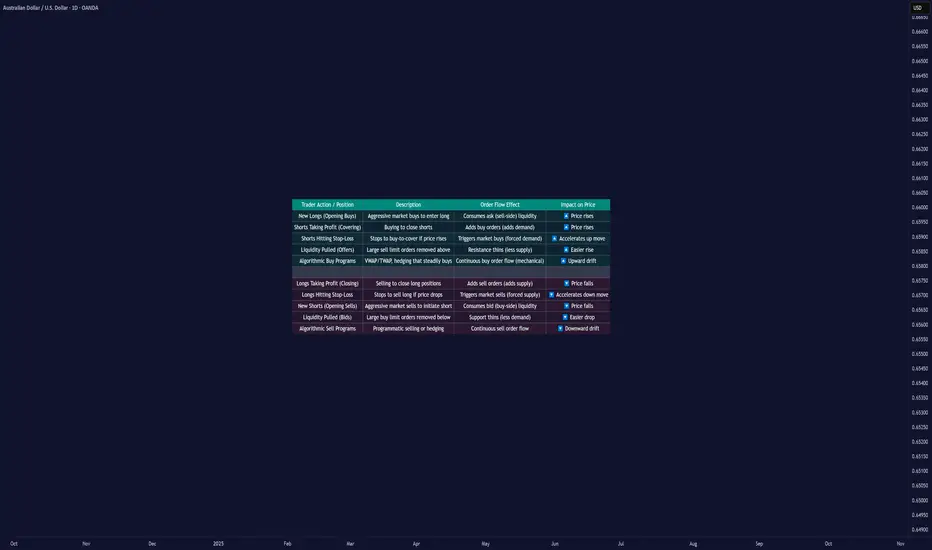
Price movement is the result of order flow interacting with liquidity. When buyers use market orders and aggressively lift the available sell orders (the ask), the price moves up. When sellers hit the bid with market orders, the price moves down.

█ The Engine Behind Price Movement
When buyers and sellers agree on price, the market ranges, there’s a balance. When one side becomes more aggressive, an imbalance occurs, and the price must adjust until new liquidity appears.
Imagine the market like a ladder made of buy and sell orders. Each rung shows where traders are waiting, buyers below the current price, and sellers above it. These waiting orders are what we call liquidity.
When a trader sends a market buy order, they’re not waiting; they want to buy immediately. That order takes the best available sell price (the ask). If more traders keep doing this — buying aggressively — those sell orders get used up faster than new ones appear. As a result, the next available sell price is higher, and the price moves up until new sellers fill the gap.
The same logic applies in reverse: when aggressive market sell orders hit the bids, they consume the buy-side liquidity. Once those bids are gone, the next available buyer is lower, and the price moves down.
█ Why Prices Move Up
1. Aggressive Buying (New Longs)
When new participants enter with market buys, they lift the offers, consuming sell-side liquidity. If this continues, the price climbs until enough new sellers appear to absorb demand. This is the cleanest form of demand-driven uptrend, with new buyers initiating positions.

2. Short Covering
The price moves higher as short sellers buy back positions. This can happen when stops are triggered after a price rise or when shorts take profits after a decline. In both cases, their buying adds upward pressure. When many cover at once, the move can accelerate into a short squeeze — higher prices trigger stops, which trigger even more buy orders, creating a self-reinforcing rally.
Profit Taking Phase

Short Squeeze Phase

3. Stop-Loss Triggers
Clusters of stop-loss orders above previous highs act as “fuel.” When price breaks those levels, automatic buy orders fire off. These aren’t new investors; they’re forced buyers closing shorts. The result is a fast, often exaggerated upward burst.

4. Thin Liquidity and Pulled Offers
Sometimes, price surges not because of huge buying, but because there’s nobody selling. If the sell side of the order book is thin, or if large resting orders get canceled, even small buys can sweep multiple levels. This creates those “air pockets” where price jumps several ticks in seconds.

5. Algorithmic and Institutional Flows
Institutions use automated execution algorithms like VWAP or TWAP to buy steadily throughout the day. These constant flows absorb liquidity over time, creating a slow upward bias. Similarly, option dealers who are short gamma must buy as prices rise to stay hedged, adding even more mechanical buying pressure.

█ Why Prices Move Down
1. Aggressive Selling (New Shorts)
When traders use market sells, they consume buy-side liquidity. If this persists, the price naturally ticks lower as bids disappear, and the next buyer will be willing only at a cheaper level.

2. Long Profit-Taking
At some point, long traders sell to realize profits. These sales add supply, which can cap or reverse an uptrend. It’s not bearish conviction; it’s simply existing longs exiting their positions.

3. Long Stop-Loss Cascades
If prices fall to where many long traders placed stops, those automatic sell orders trigger, creating a chain reaction of forced selling. This is the mirror image of a short squeeze — a long liquidation cascade.

4. Thin Bid Liquidity or Pulled Bids
When buy orders disappear, the market has no floor. Even modest selling pressure can make the price fall through several levels until new bids emerge. This is how “flash drops” occur during low-liquidity periods.

5. Algorithmic and Mechanical Selling
Negative news or risk events can activate automated sell programs, from funds rebalancing to dealers hedging short options exposure. These trades can intensify selling, even without new bearish sentiment.

█ New Positions vs. Exits — The Hidden Difference
Not every up-move means new buyers are coming in, and not every down-move means new shorts.
Some moves happen because existing positions are being closed, not opened. and that distinction matters.
One way to tell the difference is through open interest (in futures or options):
█ The Real Takeaway
Price doesn’t rise because “buyers beat sellers.” It rises because buyers were more aggressive, consuming available sell orders faster than they were replaced. It falls when sellers become more aggressive, taking out the bids.
Both entries and exits can push the price the same way:
To truly understand a move, traders must ask:
Once you start thinking in these terms, price becomes more than a random chart line; it becomes a story of liquidity and intent unfolding in real time.
█ Multiple Forces in Motion
While each example above highlights a single mechanism in isolation, the market rarely moves for one reason alone. In real trading, several of these forces often act simultaneously, new longs entering, shorts covering, stops triggering, algorithms executing, and liquidity thinning.
When multiple flows align in the same direction, the result is acceleration, price moves rapidly as liquidity vanishes, and reactions compound. When opposing forces meet, price can stall, consolidate, or violently whip as both sides compete for control.
In essence, market movement is the sum of overlapping liquidity events, not isolated causes. Understanding how these factors interact in real time is key to reading true intent behind every move.
█ In summary:
Markets move not because of “more buyers” or “more sellers,” but because one side becomes impatient, consumes liquidity, and forces repricing until balance returns.
-----------------
Disclaimer
The content provided in my scripts, indicators, ideas, algorithms, and systems is for educational and informational purposes only. It does not constitute financial advice, investment recommendations, or a solicitation to buy or sell any financial instruments. I will not accept liability for any loss or damage, including without limitation any loss of profit, which may arise directly or indirectly from the use of or reliance on such information.
All investments involve risk, and the past performance of a security, industry, sector, market, financial product, trading strategy, backtest, or individual's trading does not guarantee future results or returns. Investors are fully responsible for any investment decisions they make. Such decisions should be based solely on an evaluation of their financial circumstances, investment objectives, risk tolerance, and liquidity needs.
Most traders are told that prices rise because “there are more buyers than sellers,” and that prices fall because “there are more sellers than buyers.” But that’s not how markets actually work. In every transaction, there’s always one buyer and one seller; what really matters is which side is more aggressive and how liquidity responds to that aggression.
Price movement is the result of order flow interacting with liquidity. When buyers use market orders and aggressively lift the available sell orders (the ask), the price moves up. When sellers hit the bid with market orders, the price moves down.
In short, price moves in the direction of the side that consumes liquidity.
█ The Engine Behind Price Movement
When buyers and sellers agree on price, the market ranges, there’s a balance. When one side becomes more aggressive, an imbalance occurs, and the price must adjust until new liquidity appears.
Imagine the market like a ladder made of buy and sell orders. Each rung shows where traders are waiting, buyers below the current price, and sellers above it. These waiting orders are what we call liquidity.
When a trader sends a market buy order, they’re not waiting; they want to buy immediately. That order takes the best available sell price (the ask). If more traders keep doing this — buying aggressively — those sell orders get used up faster than new ones appear. As a result, the next available sell price is higher, and the price moves up until new sellers fill the gap.
The same logic applies in reverse: when aggressive market sell orders hit the bids, they consume the buy-side liquidity. Once those bids are gone, the next available buyer is lower, and the price moves down.
This continuous back-and-forth, liquidity being consumed, replaced, or withdrawn, is the real engine of every price movement.
█ Why Prices Move Up
1. Aggressive Buying (New Longs)
When new participants enter with market buys, they lift the offers, consuming sell-side liquidity. If this continues, the price climbs until enough new sellers appear to absorb demand. This is the cleanest form of demand-driven uptrend, with new buyers initiating positions.
2. Short Covering
The price moves higher as short sellers buy back positions. This can happen when stops are triggered after a price rise or when shorts take profits after a decline. In both cases, their buying adds upward pressure. When many cover at once, the move can accelerate into a short squeeze — higher prices trigger stops, which trigger even more buy orders, creating a self-reinforcing rally.
Profit Taking Phase
Short Squeeze Phase
3. Stop-Loss Triggers
Clusters of stop-loss orders above previous highs act as “fuel.” When price breaks those levels, automatic buy orders fire off. These aren’t new investors; they’re forced buyers closing shorts. The result is a fast, often exaggerated upward burst.
4. Thin Liquidity and Pulled Offers
Sometimes, price surges not because of huge buying, but because there’s nobody selling. If the sell side of the order book is thin, or if large resting orders get canceled, even small buys can sweep multiple levels. This creates those “air pockets” where price jumps several ticks in seconds.
5. Algorithmic and Institutional Flows
Institutions use automated execution algorithms like VWAP or TWAP to buy steadily throughout the day. These constant flows absorb liquidity over time, creating a slow upward bias. Similarly, option dealers who are short gamma must buy as prices rise to stay hedged, adding even more mechanical buying pressure.
█ Why Prices Move Down
1. Aggressive Selling (New Shorts)
When traders use market sells, they consume buy-side liquidity. If this persists, the price naturally ticks lower as bids disappear, and the next buyer will be willing only at a cheaper level.
2. Long Profit-Taking
At some point, long traders sell to realize profits. These sales add supply, which can cap or reverse an uptrend. It’s not bearish conviction; it’s simply existing longs exiting their positions.
3. Long Stop-Loss Cascades
If prices fall to where many long traders placed stops, those automatic sell orders trigger, creating a chain reaction of forced selling. This is the mirror image of a short squeeze — a long liquidation cascade.
4. Thin Bid Liquidity or Pulled Bids
When buy orders disappear, the market has no floor. Even modest selling pressure can make the price fall through several levels until new bids emerge. This is how “flash drops” occur during low-liquidity periods.
5. Algorithmic and Mechanical Selling
Negative news or risk events can activate automated sell programs, from funds rebalancing to dealers hedging short options exposure. These trades can intensify selling, even without new bearish sentiment.
█ New Positions vs. Exits — The Hidden Difference
Not every up-move means new buyers are coming in, and not every down-move means new shorts.
Some moves happen because existing positions are being closed, not opened. and that distinction matters.
- New Positions (Initiative Flow): Create real trends, since they bring new demand or supply.
- Position Exits (Reactive Flow): Often short-lived, they relieve pressure rather than add it.
One way to tell the difference is through open interest (in futures or options):
- Price up + Open Interest up → new longs entering (sustainable).
- Price up + Open Interest down → short covering (temporary).
- Price down + Open Interest down → long liquidation (often near exhaustion).
- Price down + Open Interest up → new shorts entering (trend formation).
█ The Real Takeaway
Price doesn’t rise because “buyers beat sellers.” It rises because buyers were more aggressive, consuming available sell orders faster than they were replaced. It falls when sellers become more aggressive, taking out the bids.
Both entries and exits can push the price the same way:
- New longs and shorts covering both create buy pressure.
- New shorts and longs taking profit both create sell pressure.
To truly understand a move, traders must ask:
- Who initiated it, new positions or forced exits?
- Was liquidity added or withdrawn?
- Did open interest confirm new participation or show a squeeze?
Once you start thinking in these terms, price becomes more than a random chart line; it becomes a story of liquidity and intent unfolding in real time.
█ Multiple Forces in Motion
While each example above highlights a single mechanism in isolation, the market rarely moves for one reason alone. In real trading, several of these forces often act simultaneously, new longs entering, shorts covering, stops triggering, algorithms executing, and liquidity thinning.
When multiple flows align in the same direction, the result is acceleration, price moves rapidly as liquidity vanishes, and reactions compound. When opposing forces meet, price can stall, consolidate, or violently whip as both sides compete for control.
In essence, market movement is the sum of overlapping liquidity events, not isolated causes. Understanding how these factors interact in real time is key to reading true intent behind every move.
█ In summary:
Markets move not because of “more buyers” or “more sellers,” but because one side becomes impatient, consumes liquidity, and forces repricing until balance returns.
Understanding who’s moving the market and why — new positioning, forced exits, or vanished liquidity — is the foundation of reading true market intent.
-----------------
Disclaimer
The content provided in my scripts, indicators, ideas, algorithms, and systems is for educational and informational purposes only. It does not constitute financial advice, investment recommendations, or a solicitation to buy or sell any financial instruments. I will not accept liability for any loss or damage, including without limitation any loss of profit, which may arise directly or indirectly from the use of or reliance on such information.
All investments involve risk, and the past performance of a security, industry, sector, market, financial product, trading strategy, backtest, or individual's trading does not guarantee future results or returns. Investors are fully responsible for any investment decisions they make. Such decisions should be based solely on an evaluation of their financial circumstances, investment objectives, risk tolerance, and liquidity needs.
Access my indicators at: zeiierman.com/
Join Our Free Discord: discord.gg/zeiiermantrading
Join Our Free Discord: discord.gg/zeiiermantrading
Related publications
Disclaimer
The information and publications are not meant to be, and do not constitute, financial, investment, trading, or other types of advice or recommendations supplied or endorsed by TradingView. Read more in the Terms of Use.