Tactical View / Opinions (if trading intraday)
Bias: marginally bearish in Bank Nifty. Prefer short / put setups (Commonly Used Thought), but keep reversal triggers in mind.
If price rallies toward resistance zone (54,7500–54900), look for shorting opportunities with tight stops.
On a breakdown of support (below ~54,080), follow through on downside momentum. May be REVERSED.
Use tight stops; banking names tend to be volatile, so traps and reversals are common.
Monitor individual heavyweights (HDFC Bank, ICICI Bank, SBI, Axis, etc.) for leadership direction.
Intraday Probabilities & Scenarios
Here’s a rough probability model for Bank Nifty on 29-Sep:
Downside close (below today’s open / weaker): 50%
(Momentum bias, negative sectoral cues in banking, flow pressure)
Upside / recovery close: 30%
(If broader markets bounce or a relief rally in financials)
Volatile / whipsaw day (both sides, ends flatish): 20%
Scenarios ((BROADER Sense)):
Bear continuation: Break below 54,000 → move toward 53,500 / 53,000
Bounce attempt: Recover toward 54,800 / 55,000, but likely to meet resistance
Choppy range: 54,200 – 54,800 as intraday range, without a clear trend
Level & Comments / Importance (BROADER Sense)
Resistance zone: 54,800 – 55,000 If the index tries a recovery, this is likely the first stiff supply zone.
Intermediate resistance: 55,300-55,550 Secondary upper barrier if strong bounce.
Immediate support ~ 54,080 A break below this could lead to acceleration downward.
Lower support / target 53,600- 53270 Stronger base zone, psychological and historically relevant.
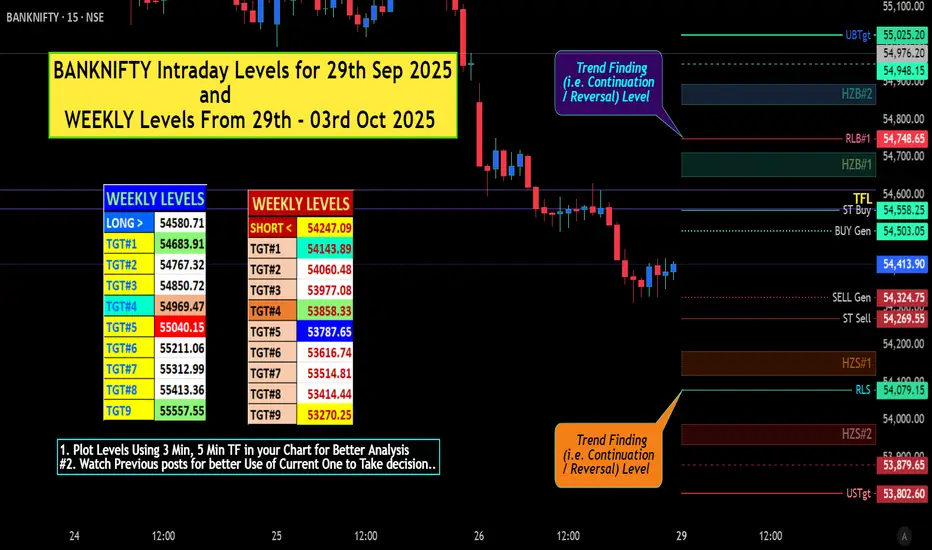
# "WEEKLY Levels" mentioned in BOX format.
^^^^^^^Plot Levels Using 3 Min, 5 Min Time frame in your Chart for Better Analysis^^^^^^^
L#1: If the candle crossed & stays above the “Buy Gen”, it is treated / considered as Bullish bias.
L#2: Possibility / Probability of REVERSAL near RLB#1 & UBTgt
L#3: If the candle stays above “Sell Gen” but below “Buy Gen”, it is treated / considered as Sidewise. Aggressive Traders can take Long position near “Sell Gen” either retesting or crossed from Below & vice-versa i.e. can take Short position near “Buy Gen” either retesting or crossed downward from Above.
L#4: If the candle crossed & stays below the “Sell Gen”, it is treated / considered a Bearish bias.
L#5: Possibility / Probability of REVERSAL near RLS#1 & USTgt
HZB (Buy side) & HZS (Sell side) => Hurdle Zone,
*** Specialty of “HZB#1, HZB#2 HZS#1 & HZS#2” is Sidewise (behaviour in Nature)
Rest Plotted and Mentioned on Chart
Color code Used:
Green =. Positive bias.
Red =. Negative bias.
RED in Between Green means Trend Finder / Momentum Change
/ CYCLE Change and Vice Versa.
Notice One thing: HOW LEVELS are Working.
Use any Momentum Indicator / Oscillatoror as you "USED to" to Take entry.
⚠️ DISCLAIMER:
The information, views, and ideas shared here are purely for educational and informational purposes only. They are not intended as investment advice or a recommendation to buy, sell, or hold any financial instruments. I am not a SEBI-registered financial adviser.
Trading and investing in the stock market involves risk, and you should do your own research and analysis. You are solely responsible for any decisions made based on this research.
"As HARD EARNED MONEY IS YOUR's, So DECISION SHOULD HAVE TO BE YOUR's".
Do comment if Helpful.
Bias: marginally bearish in Bank Nifty. Prefer short / put setups (Commonly Used Thought), but keep reversal triggers in mind.
If price rallies toward resistance zone (54,7500–54900), look for shorting opportunities with tight stops.
On a breakdown of support (below ~54,080), follow through on downside momentum. May be REVERSED.
Use tight stops; banking names tend to be volatile, so traps and reversals are common.
Monitor individual heavyweights (HDFC Bank, ICICI Bank, SBI, Axis, etc.) for leadership direction.
Intraday Probabilities & Scenarios
Here’s a rough probability model for Bank Nifty on 29-Sep:
Downside close (below today’s open / weaker): 50%
(Momentum bias, negative sectoral cues in banking, flow pressure)
Upside / recovery close: 30%
(If broader markets bounce or a relief rally in financials)
Volatile / whipsaw day (both sides, ends flatish): 20%
Scenarios ((BROADER Sense)):
Bear continuation: Break below 54,000 → move toward 53,500 / 53,000
Bounce attempt: Recover toward 54,800 / 55,000, but likely to meet resistance
Choppy range: 54,200 – 54,800 as intraday range, without a clear trend
Level & Comments / Importance (BROADER Sense)
Resistance zone: 54,800 – 55,000 If the index tries a recovery, this is likely the first stiff supply zone.
Intermediate resistance: 55,300-55,550 Secondary upper barrier if strong bounce.
Immediate support ~ 54,080 A break below this could lead to acceleration downward.
Lower support / target 53,600- 53270 Stronger base zone, psychological and historically relevant.
# "WEEKLY Levels" mentioned in BOX format.
^^^^^^^Plot Levels Using 3 Min, 5 Min Time frame in your Chart for Better Analysis^^^^^^^
L#1: If the candle crossed & stays above the “Buy Gen”, it is treated / considered as Bullish bias.
L#2: Possibility / Probability of REVERSAL near RLB#1 & UBTgt
L#3: If the candle stays above “Sell Gen” but below “Buy Gen”, it is treated / considered as Sidewise. Aggressive Traders can take Long position near “Sell Gen” either retesting or crossed from Below & vice-versa i.e. can take Short position near “Buy Gen” either retesting or crossed downward from Above.
L#4: If the candle crossed & stays below the “Sell Gen”, it is treated / considered a Bearish bias.
L#5: Possibility / Probability of REVERSAL near RLS#1 & USTgt
HZB (Buy side) & HZS (Sell side) => Hurdle Zone,
*** Specialty of “HZB#1, HZB#2 HZS#1 & HZS#2” is Sidewise (behaviour in Nature)
Rest Plotted and Mentioned on Chart
Color code Used:
Green =. Positive bias.
Red =. Negative bias.
RED in Between Green means Trend Finder / Momentum Change
/ CYCLE Change and Vice Versa.
Notice One thing: HOW LEVELS are Working.
Use any Momentum Indicator / Oscillatoror as you "USED to" to Take entry.
⚠️ DISCLAIMER:
The information, views, and ideas shared here are purely for educational and informational purposes only. They are not intended as investment advice or a recommendation to buy, sell, or hold any financial instruments. I am not a SEBI-registered financial adviser.
Trading and investing in the stock market involves risk, and you should do your own research and analysis. You are solely responsible for any decisions made based on this research.
"As HARD EARNED MONEY IS YOUR's, So DECISION SHOULD HAVE TO BE YOUR's".
Do comment if Helpful.
Related publications
Disclaimer
The information and publications are not meant to be, and do not constitute, financial, investment, trading, or other types of advice or recommendations supplied or endorsed by TradingView. Read more in the Terms of Use.
Related publications
Disclaimer
The information and publications are not meant to be, and do not constitute, financial, investment, trading, or other types of advice or recommendations supplied or endorsed by TradingView. Read more in the Terms of Use.