**Technical Analysis**
**Current Trend (requires interpretation with real-time charts):**
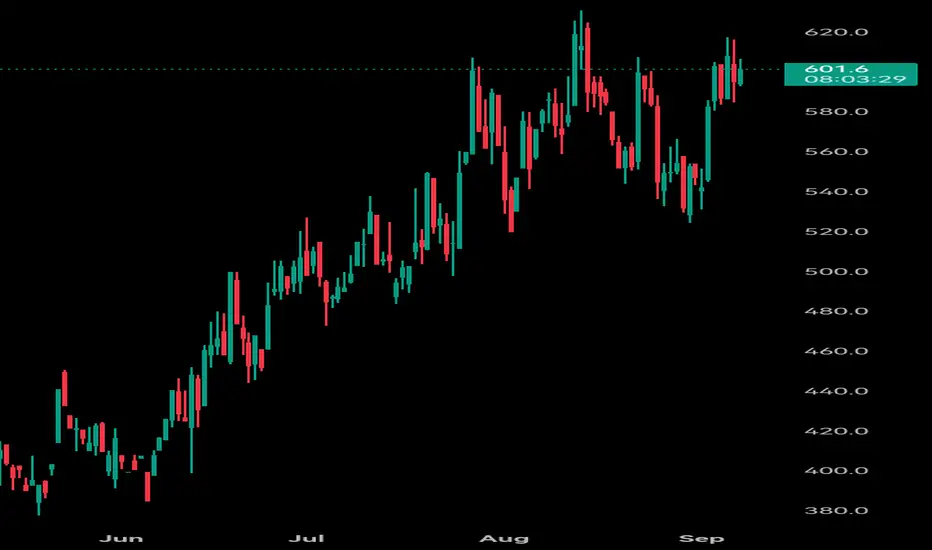
The price of BCH is currently at a critical level. Looking at the daily chart, it may be testing a **key support level** (such as a previous low or a crucial moving average, like the 200-day moving average). If it breaks below this level on high volume, it could initiate a new downward trend, potentially targeting the next major support level.
Conversely, if it finds strong support at this level accompanied by increased trading volume, it might form a short-term bottom and attempt to challenge the nearest resistance level (such as a previous high or the 50-day moving average).
**Key Indicator Signals:**
* **Volume:** Whether recent price increases are supported by high volume or declines occur on low volume is crucial for determining momentum strength.
* **RSI (Relative Strength Index):** If it is in the oversold zone below 30 and forms a bullish divergence, it might suggest an impending rebound. If it is in the overbought zone above 70, be cautious of a potential pullback.
* **MACD:** Watch for whether the DIF and DEA lines form a golden cross below the zero axis, which is one of the short-term bullish signals.
**Conclusion:**
BCH is nearing a short-term directional decision. It is essential to closely monitor its breakthrough of key support/resistance levels. The overall trend is still influenced by the broader Bitcoin market. When trading, strictly control risks and wait for high-volume confirmation of directional signals.
**Current Trend (requires interpretation with real-time charts):**
The price of BCH is currently at a critical level. Looking at the daily chart, it may be testing a **key support level** (such as a previous low or a crucial moving average, like the 200-day moving average). If it breaks below this level on high volume, it could initiate a new downward trend, potentially targeting the next major support level.
Conversely, if it finds strong support at this level accompanied by increased trading volume, it might form a short-term bottom and attempt to challenge the nearest resistance level (such as a previous high or the 50-day moving average).
**Key Indicator Signals:**
* **Volume:** Whether recent price increases are supported by high volume or declines occur on low volume is crucial for determining momentum strength.
* **RSI (Relative Strength Index):** If it is in the oversold zone below 30 and forms a bullish divergence, it might suggest an impending rebound. If it is in the overbought zone above 70, be cautious of a potential pullback.
* **MACD:** Watch for whether the DIF and DEA lines form a golden cross below the zero axis, which is one of the short-term bullish signals.
**Conclusion:**
BCH is nearing a short-term directional decision. It is essential to closely monitor its breakthrough of key support/resistance levels. The overall trend is still influenced by the broader Bitcoin market. When trading, strictly control risks and wait for high-volume confirmation of directional signals.
Disclaimer
The information and publications are not meant to be, and do not constitute, financial, investment, trading, or other types of advice or recommendations supplied or endorsed by TradingView. Read more in the Terms of Use.
Disclaimer
The information and publications are not meant to be, and do not constitute, financial, investment, trading, or other types of advice or recommendations supplied or endorsed by TradingView. Read more in the Terms of Use.