Of course. Here is the technical analysis of Bitcoin translated into English:
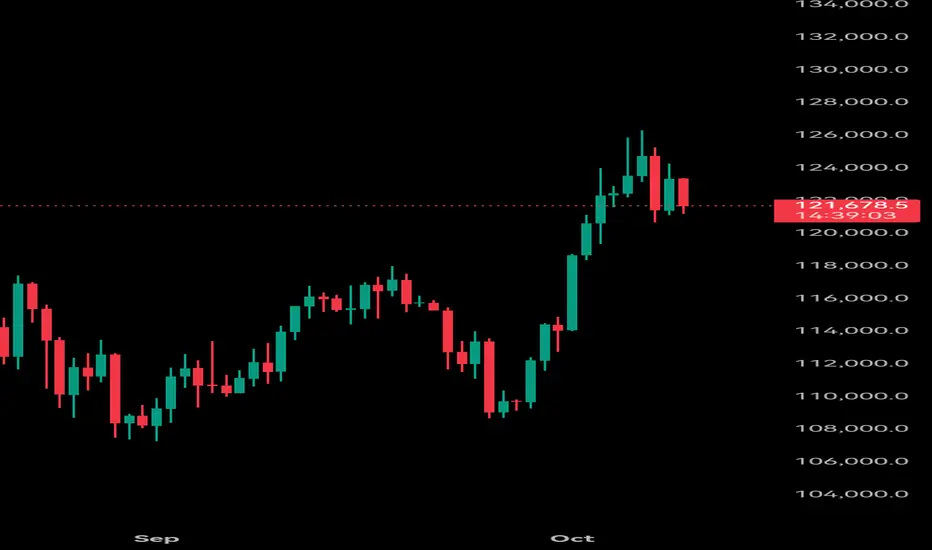
Bitcoin is currently at a critical technical juncture. On the daily chart, the price has been consolidating within a large range between $60,000** and **$68,500, forming a typical converging triangle pattern. The decreasing volatility suggests an impending decisive directional breakout.
The moving average system is highly converged, with the 30-day MA (around $64,000)** and the **60-day MA (around $63,200) intertwined, indicating a lack of clear short-term trend direction. The MACD indicator is hovering around the zero line with weak momentum bars, showing a fragile balance between bullish and bearish forces. The RSI is lingering near the neutral 50 level, reflecting market indecision.
The key resistance is clearly at $68,500**, which aligns with the previous high and the upper trendline of the triangle. The crucial support level rests at the psychological **$60,000 mark, coinciding with the 100-day moving average. Recent trading volume has continued to shrink, highlighting the market's cautious stance ahead of a potential major move.
In summary, Bitcoin's consolidation phase is nearing its end. A decisive break above $68,500** with strong volume would confirm the start of a new upward trend, targeting **$72,000 and beyond. Conversely, a sustained break below $60,000** could trigger a deeper correction towards key support levels like **$56,000. At this pivotal point, patience and waiting for the market to commit to a direction is the more prudent strategy.
Disclaimer
The information and publications are not meant to be, and do not constitute, financial, investment, trading, or other types of advice or recommendations supplied or endorsed by TradingView. Read more in the Terms of Use.
Disclaimer
The information and publications are not meant to be, and do not constitute, financial, investment, trading, or other types of advice or recommendations supplied or endorsed by TradingView. Read more in the Terms of Use.