This idea will cover the Normal Model and why its important to have in your toolbelt while exploring the world of cryptocurrency.
Core of the Normal Model.
Normal Model Build
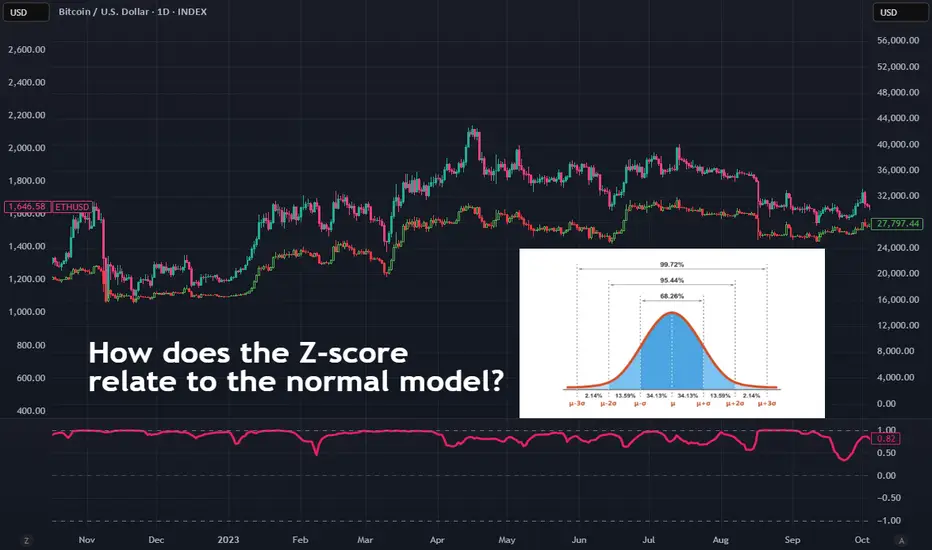
The normal model or the normal distribution is a symmetric bell-shaped probability curve, its core is to measure the mean, median and mode these are located at the center of the distribution.
Normal Model Calculation
The model shows mean at the center.
-1σ / 1σ - (1 standard deviation) covers 68.2% of data.
-2σ / 2σ covers 95.4% of data.
-3σ / 3σ covers 99.7% of data.
This means that 1σ is 1 standard deviation above the mean, while -1σ is 1 standard deviation below the mean.
This applies to 1σ, 2σ, 3σ and -1σ, 2σ, 3σ.
Normal Model Use case
We will now provide an example using a unimodal normal distribution.
Example delivery time, we have a mean of 30 with a standard deviation of 5.
This tells us that.
68.2% of the times are between 25 - 35 mins. Which is -1σ / 1σ.
95.4% of the times are between 20 - 40 mins.Which is -2σ / 2σ.
99.7% of the times are between 15 - 45 mins. Which is -3σ / 3σ
We can now do a calculation with the formula Z = (X - μ) / σ Where X is the data point, μ is the mean, and σ is the standard deviation.
The formula above is the Z-score formula and its used to measure how far a data point is from its mean in terms of standard deviations.

Z-score
Z-score is very valuable to learn and understand and has several use cases. For example, it’s very useful when it comes to identifying outliers a high or low z-score would be unusual compared to the data. If the data follows a normal distribution, the z-score allows you to calculate the probability, helping you understand whether an outcome or value is rare or not.
Imagine you want to compare different crypto coins: Bitcoin gains a few percent while ETH gains 50%+. The z-score allows you to see which coin is moving more extremely relative to its usual volatility. This can be used to identify trends in the market that normal indicators might not be able to see or adjust your risk.

Normal Model / Correlation between assets.
Now that we understand how the Normal Model and Z-Score work, we can apply this knowledge to the markets. There are many use cases, but we’ll focus on the most reliable one: correlation between assets.
Let’s take BTC and ETH as an example. Your correlation indicator gives you a stream of values (e.g., between -1 and +1). We take the history of this indicator's values and treat this history as our normal distribution.
We then calculate the Z-Score for the current correlation value using the historical average and standard deviation of the indicator itself. This tells us if the current correlation is statistically unusual.
By using Z-Scores, we can spot when the correlation is unusually high or low compared to its historical average.
Use case of new knowledge.
If Z-Score is very high, BTC and ETH are moving together more than usual indicating a strong trend continuation.
If the Z-Score is very low, the coins are moving together less than usual could signal a potential reversal.
You can use the information above to adjust your approach manage risk and entries. Now you have more then just a correlation understanding but also a statistical perspective.
Core of the Normal Model.
Normal Model Build
The normal model or the normal distribution is a symmetric bell-shaped probability curve, its core is to measure the mean, median and mode these are located at the center of the distribution.
Normal Model Calculation
The model shows mean at the center.
-1σ / 1σ - (1 standard deviation) covers 68.2% of data.
-2σ / 2σ covers 95.4% of data.
-3σ / 3σ covers 99.7% of data.
This means that 1σ is 1 standard deviation above the mean, while -1σ is 1 standard deviation below the mean.
This applies to 1σ, 2σ, 3σ and -1σ, 2σ, 3σ.
Normal Model Use case
We will now provide an example using a unimodal normal distribution.
Example delivery time, we have a mean of 30 with a standard deviation of 5.
This tells us that.
68.2% of the times are between 25 - 35 mins. Which is -1σ / 1σ.
95.4% of the times are between 20 - 40 mins.Which is -2σ / 2σ.
99.7% of the times are between 15 - 45 mins. Which is -3σ / 3σ
We can now do a calculation with the formula Z = (X - μ) / σ Where X is the data point, μ is the mean, and σ is the standard deviation.
The formula above is the Z-score formula and its used to measure how far a data point is from its mean in terms of standard deviations.
Z-score
Z-score is very valuable to learn and understand and has several use cases. For example, it’s very useful when it comes to identifying outliers a high or low z-score would be unusual compared to the data. If the data follows a normal distribution, the z-score allows you to calculate the probability, helping you understand whether an outcome or value is rare or not.
Imagine you want to compare different crypto coins: Bitcoin gains a few percent while ETH gains 50%+. The z-score allows you to see which coin is moving more extremely relative to its usual volatility. This can be used to identify trends in the market that normal indicators might not be able to see or adjust your risk.
Normal Model / Correlation between assets.
Now that we understand how the Normal Model and Z-Score work, we can apply this knowledge to the markets. There are many use cases, but we’ll focus on the most reliable one: correlation between assets.
Let’s take BTC and ETH as an example. Your correlation indicator gives you a stream of values (e.g., between -1 and +1). We take the history of this indicator's values and treat this history as our normal distribution.
We then calculate the Z-Score for the current correlation value using the historical average and standard deviation of the indicator itself. This tells us if the current correlation is statistically unusual.
By using Z-Scores, we can spot when the correlation is unusually high or low compared to its historical average.
Use case of new knowledge.
If Z-Score is very high, BTC and ETH are moving together more than usual indicating a strong trend continuation.
If the Z-Score is very low, the coins are moving together less than usual could signal a potential reversal.
You can use the information above to adjust your approach manage risk and entries. Now you have more then just a correlation understanding but also a statistical perspective.
Get access to our private indicators: whop.com/lyro-rs
Join our community: discord.gg/kcEBMWaFjS
All material from Lyro RS is for educational purposes only. Past performance does not guarantee future results.
Join our community: discord.gg/kcEBMWaFjS
All material from Lyro RS is for educational purposes only. Past performance does not guarantee future results.
Disclaimer
The information and publications are not meant to be, and do not constitute, financial, investment, trading, or other types of advice or recommendations supplied or endorsed by TradingView. Read more in the Terms of Use.