BTC Monthly: Awaiting Bullish Confirmation from Fibonacci Golden Zone
Hello, traders. This is a high-level, monthly-timeframe analysis of Bitcoin's macro trend.
This idea is based on a clear, repeating pattern that has defined the bull market since September 2023. By understanding this larger structure, we can better frame the current volatility and identify what to look for as confirmation of the next major leg up.
🔍 The Core Analysis
- On the monthly chart, BTC's bullish trend has followed a consistent blueprint:
- A strong impulse move up.
- A corrective pullback into the Fibonacci "Golden Zone" (the area between the 50% and 61.8% retracement levels).
- A period of consolidation in this zone, where support is found.
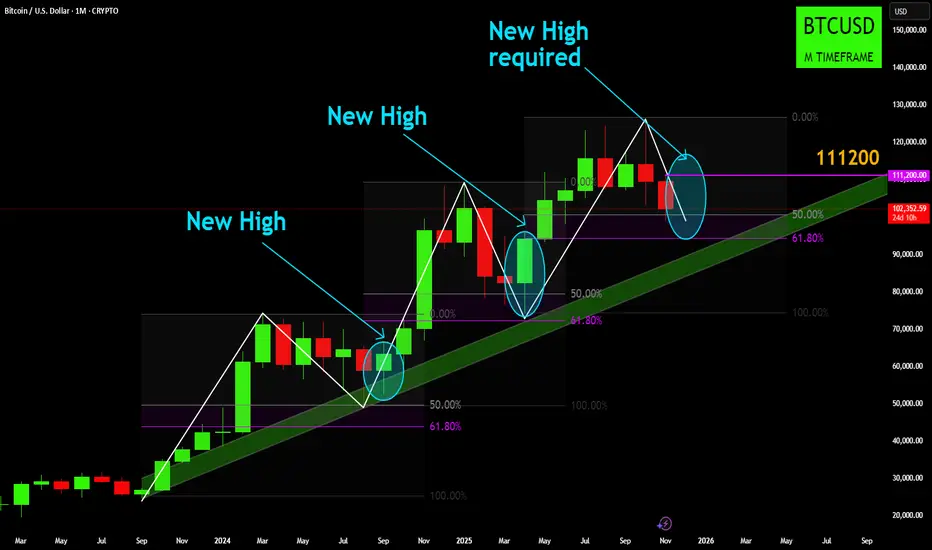
- A breakout from this zone, leading to a New High and continuation of the trend.
- As you can see from the chart, this "pullback-and-breakout" pattern has happened twice already during this uptrend.
📍 Where We Are Now
- Currently, we are at a critical juncture. After posting a significant new high (around $128,000), the price has once again entered a corrective phase.
- Price is currently testing the 50% Fibonacci level at approximately $102,404.
- This places us squarely back inside the "Golden Zone," the same area that has acted as a support and springboard for price in the past.
🐂 The Bullish Thesis (Confirmation)
- For the long-term bullish trend to be confirmed, the pattern must repeat:
- Support must hold within this 50% - 61.8% Fib zone.
- The price must eventually break out of this corrective structure and create a New High above the previous peak.
- This new high is the required confirmation that the pullback is complete and the macro uptrend is continuing.
🐻 The Corrective/Volatile Phase (The "Wait")
- Until that new high is formed, we must respect the current market phase.
- Price is technically in a "pullback mode."
- This means we should expect continued volatility. Price can easily fluctuate for weeks, or even months, within this corrective zone before a clear direction is established.
- A break below the 61.8% Fib level on a monthly closing basis would be a significant warning sign and would challenge the validity of this entire bullish structure.
⚠️ Important: A Macro View
- This is a Monthly Chart. Each candle represents 30 days of price action.
- This analysis is ideal for a long-term perspective (investors, position traders) to understand the bigger picture.
- It is NOT suitable for short-term trading. The moves within this "golden zone" can still be tens of thousands of dollars.
- This same concept (impulse, Fib pullback, new high) can be applied to shorter time frames (like the Daily or 4-Hour) to find short-term trade setups, but this specific chart is strictly a macro view.
Disclaimer:
The information provided in this chart is for educational and informational purposes only and should not be considered as investment advice. Trading and investing involve substantial risk and are not suitable for every investor. You should carefully consider your financial situation and consult with a financial advisor before making any investment decisions. The creator of this chart does not guarantee any specific outcome or profit and is not responsible for any losses incurred as a result of using this information. Past performance is not indicative of future results. Use this information at your own risk. This chart has been created for my own improvement in Trading and Investment Analysis. Please do your own analysis before any investments.
Disclaimer
The information and publications are not meant to be, and do not constitute, financial, investment, trading, or other types of advice or recommendations supplied or endorsed by TradingView. Read more in the Terms of Use.
Disclaimer
The information and publications are not meant to be, and do not constitute, financial, investment, trading, or other types of advice or recommendations supplied or endorsed by TradingView. Read more in the Terms of Use.