BTCUSD 4H Chart Analysis: Potential Reversal and Key Levels
Disclaimer:
The information provided in this chart is for educational and informational purposes only and should not be considered as investment advice. Trading and investing involve substantial risk and are not suitable for every investor. You should carefully consider your financial situation and consult with a financial advisor before making any investment decisions. The creator of this chart does not guarantee any specific outcome or profit and is not responsible for any losses incurred as a result of using this information. Past performance is not indicative of future results. Use this information at your own risk. This chart has been created for my own improvement in Trading and Investment Analysis. Please do your own analysis before any investments.
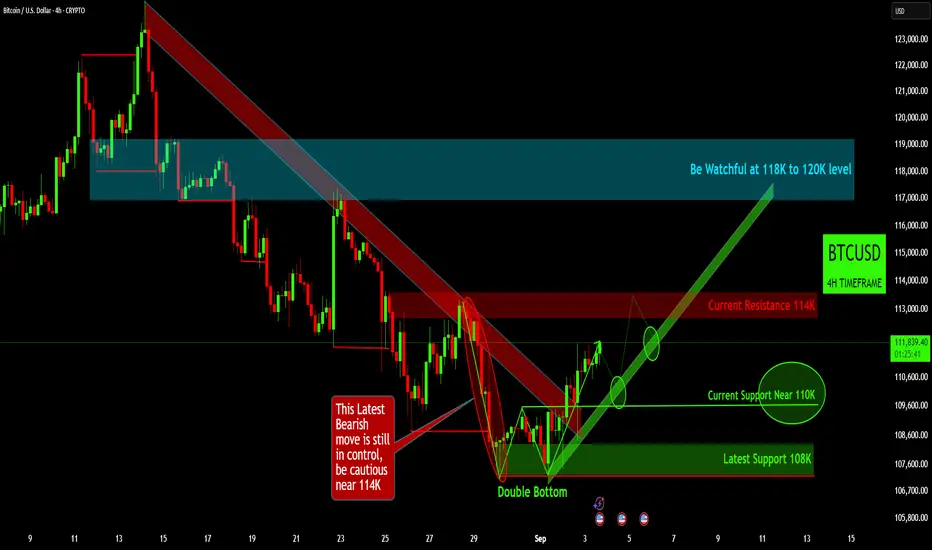
- Prior Bearish Dominance: BTC was in a significant bearish move from mid-August, dropping from highs around 123K and forming a clear descending channel (red shaded area). This bearish trend was identified as "still in control," with caution advised for price action near the 114K level, which acted as a resistance point for much of the late August period.
- Double Bottom Reversal: A crucial bullish reversal pattern, a "Double Bottom" (or W-pattern), has formed at the end of August, with bottoms around the 107K-108K level. This pattern signals a potential exhaustion of the downtrend and a shift in momentum towards the upside, establishing "Latest Support 108K."
- Critical Support & Breakout: Following the Double Bottom, the price has broken above its neckline, establishing "Current Support Near 110K." This 110K level is identified as a key breakout point for the W-pattern. Trade near this trendline support and the 110K W-pattern breakout level is well-aligned with the chart’s indication of a nascent up-trend and strong support. The market is currently trading just above this support.
- Upcoming Resistance & Targets: The immediate hurdle for BTC is "Current Resistance 114K." A successful break and sustain above this level would confirm stronger bullish momentum. The chart projects further upside towards the "118K to 120K level," which is highlighted as a significant area to be watchful of, representing a previous resistance zone from mid-August.
Disclaimer:
The information provided in this chart is for educational and informational purposes only and should not be considered as investment advice. Trading and investing involve substantial risk and are not suitable for every investor. You should carefully consider your financial situation and consult with a financial advisor before making any investment decisions. The creator of this chart does not guarantee any specific outcome or profit and is not responsible for any losses incurred as a result of using this information. Past performance is not indicative of future results. Use this information at your own risk. This chart has been created for my own improvement in Trading and Investment Analysis. Please do your own analysis before any investments.
Disclaimer
The information and publications are not meant to be, and do not constitute, financial, investment, trading, or other types of advice or recommendations supplied or endorsed by TradingView. Read more in the Terms of Use.
Disclaimer
The information and publications are not meant to be, and do not constitute, financial, investment, trading, or other types of advice or recommendations supplied or endorsed by TradingView. Read more in the Terms of Use.